Categories in Luanda
Industries
Business Distribution by Industry in Luanda
| Industry Description | Number of Establishments | Average Age of Business |
|---|---|---|
| Restaurants | 1,593 | — |
| Corporate management | 1,300 | 20 years |
| Shopping | 1,155 | 22 years |
| Education | 928 | 18 years |
| Apartments | 818 | — |
| Churches | 725 | — |
| Electronics stores | 718 | 14 years |
| Bars, pubs and taverns | 672 | — |
| Other accommodation | 545 | — |
| Grocery stores and supermarkets | 483 | — |
| Advertising and marketing | 452 | 12 years |
| Real estate | 445 | — |
Luanda Facts
| Area | 2456.4 km² |
| Population | 8,307,869 |
| Male Population | 4,067,042 (49.0%) |
| Female Population | 4,240,827 (51.0%) |
| Population change (1975 to 2020) | +367342.2% |
| Population change (2000 to 2020) | +1524.6% |
| Median Age | 16.4 years (Male: 15.8, Female: 16.9) |
| Area Codes | 22 |
| Neighborhoods | Ingombota, Maianga, Samba, Luanda Sul, Kilamba Kiaxi |
| Local Time | |
| Timezone | West Africa Time |
| Lat & Lng | -8.83682, 13.23432 |
Map of Luanda
Interactive Map
Luanda Population
Years 1975 to 2020
| Data | 1975 | 1990 | 2000 | 2015 | 2020 |
|---|---|---|---|---|---|
| Population | 2,261 | 61,157 | 511,365 | 7,322,751 | 8,307,869 |
| Population Density | 0.9 / km² | 24.9 / km² | 208.2 / km² | 2,981.1 / km² | 3,382.2 / km² |
Luanda Population change from 2000 to 2015
Increase of 1332% from year 2000 to 2015
| Location | Change since 1975 | Change since 1990 | Change since 2000 |
|---|---|---|---|
| Luanda | +323772.2% | +11873.7% | +1332% |
| Luanda Province | +323772.2% | +11873.7% | +1332% |
| Angola | +251.5% | +125.2% | +66.3% |
Luanda Median Age
Median Age: 16.4 years
| Location | Median Age | Median Age (Female) | Median Age (Male) |
|---|---|---|---|
| Luanda | 16.4 yrs | 16.9 yrs | 15.8 yrs |
| Luanda Province | 16.4 yrs | 16.9 yrs | 15.8 yrs |
| Angola | 16.4 yrs | 16.9 yrs | 15.8 yrs |
Luanda Population Density
Population Density: 3,382 / km²
| Location | Population | Area | Density |
|---|---|---|---|
| Luanda | 8.3 million | 2,456.4 km² | 3,382 / km² |
| Luanda Province | 7.3 million | 2,465.3 km² | 2,970 / km² |
| Angola | 24.8 million | 1,247,144.5 km² | 19.9 / km² |
Luanda Historical and Projected Population
Estimated Population from 1975 to 2100
- JRC (European Commission's Joint Research Centre) work on the GHS built-up grid
- CIESIN (Center for International Earth Science Information Network)
- [Link] Klein Goldewijk, K., Beusen, A., Doelman, J., and Stehfest, E.: Anthropogenic land use estimates for the Holocene – HYDE 3.2, Earth Syst. Sci. Data, 9, 927–953, https://doi.org/10.5194/essd-9-927-2017, 2017.
Neighborhoods in Luanda
Percentage of businesses by neighborhood in Luanda
Area Codes
Percentage Area Codes used by businesses in Luanda
Price Distribution
Business distribution by price for Luanda
Human Development Index (HDI)
Statistic composite index of life expectancy, education, and per capita income.
Luanda CO2 Emissions
Carbon Dioxide (CO2) Emissions Per Capita in Tonnes Per Year
| Location | CO2 Emissions | CO2 Emissions Per Capita | CO2 Emissions Intensity |
|---|---|---|---|
| Luanda | 7,048,662 tn | 0.85 tn | 2,869.5 tons/km² |
| Luanda Province | 6,212,856 tn | 0.85 tn | 2,520.1 tons/km² |
| Angola | 21,454,743 tn | 0.86 tn | 17.2 tons/km² |
| 2013 CO2 emissions (tonnes/year) | 7,048,662 tn |
| 2013 CO2 emissions (tonnes/year) per capita | 0.85 tn |
| 2013 CO2 emissions intensity (tonnes/km²/year) | 2,869.5 tons/km² |
Natural Hazards Risk
Relative risk out of 10
| Hazard | Risk Level |
|---|---|
| Drought | High (9) |
| Flood | Medium (4) |
* Risk, particularly concerning flood or landslide, may not be for the entire area.
- Dilley, M., R.S. Chen, U. Deichmann, A.L. Lerner-Lam, M. Arnold, J. Agwe, P. Buys, O. Kjekstad, B. Lyon, and G. Yetman. 2005. Natural Disaster Hotspots: A Global Risk Analysis. Washington, D.C.: World Bank. https://doi.org/10.1596/0-8213-5930-4.
- Center for Hazards and Risk Research - CHRR - Columbia University, Center for International Earth Science Information Network - CIESIN - Columbia University, and International Research Institute for Climate and Society - IRI - Columbia University. 2005. Global Drought Hazard Frequency and Distribution. Palisades, NY: NASA Socioeconomic Data and Applications Center (SEDAC). https://doi.org/10.7927/H4VX0DFT.
- Center for Hazards and Risk Research - CHRR - Columbia University, Center for International Earth Science Information Network - CIESIN - Columbia University. 2005. Global Flood Hazard Frequency and Distribution. Palisades, NY: NASA Socioeconomic Data and Applications Center (SEDAC). https://doi.org/10.7927/H4668B3D.
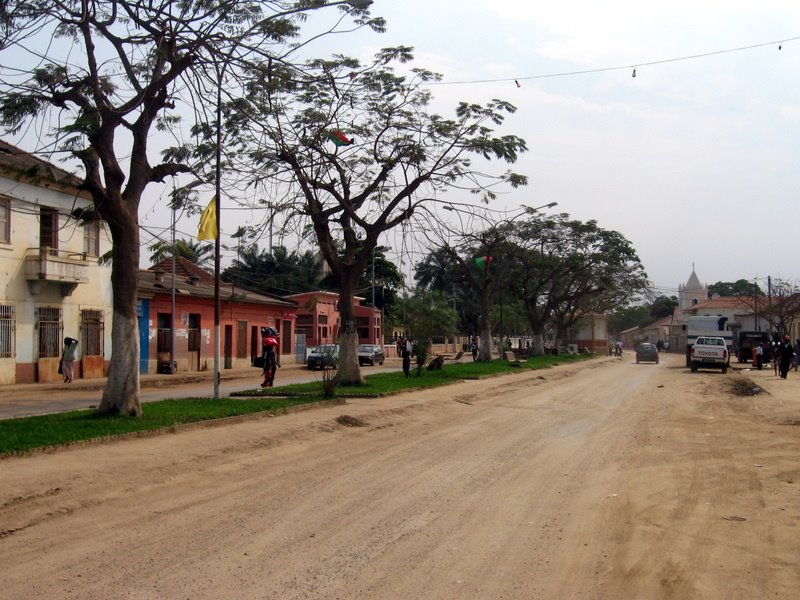
Luanda
, formerly named São Paulo da Assunção de Loanda, is the capital and largest city in Angola, and the country's most populous and important city, primary port and major industrial, cultural and urban centre. Located on Angola's coast with the Atlanti..
Luanda Wikipedia Page

About Our Data
The data on this page is estimated using a number of publicly available tools and resources. It is provided without warranty, and could contain inaccuracies. Use at your own risk.