Categories in Bariloche
Industries
Business Distribution by Industry in Bariloche
| Industry Description | Number of Establishments | Average Age of Business |
|---|---|---|
| Other accommodation | 712 | 23 years |
| Restaurants | 500 | — |
| Shopping | 414 | — |
| Hotels and motels | 226 | — |
| Grocery stores and supermarkets | 205 | — |
| Clothing stores | 200 | — |
| Car repair | 194 | — |
| Real estate | 180 | — |
| Education | 167 | 24 years |
| All food and beverage | 141 | — |
| Travel agencies | 135 | 21 years |
| Bars, pubs and taverns | 125 | — |
Bariloche Facts
| Area | 5859.8 km² |
| Population | 152,240 |
| Male Population | 75,264 (49.4%) |
| Female Population | 76,976 (50.6%) |
| Population change (1975 to 2020) | +161.8% |
| Population change (2000 to 2020) | +37.2% |
| Median Age | 29.9 years (Male: 28.8, Female: 31) |
| Area Codes | 2944 |
| Neighborhoods | Centro, Belgrano, Villa Nahuel Malal, Anagasti, 10 de Diciembre |
| Local Time | |
| Timezone | Argentina Standard Time |
| Lat & Lng | -41.14557, -71.30822 |
Map of Bariloche
Interactive Map
Bariloche Population
Years 1975 to 2020
| Data | 1975 | 1990 | 2000 | 2015 | 2020 |
|---|---|---|---|---|---|
| Population | 58,142 | 87,578 | 110,973 | 151,662 | 152,240 |
| Population Density | 9.9 / km² | 14.9 / km² | 18.9 / km² | 25.9 / km² | 26 / km² |
Bariloche Population change from 2000 to 2015
Increase of 36.7% from year 2000 to 2015
| Location | Change since 1975 | Change since 1990 | Change since 2000 |
|---|---|---|---|
| Bariloche | +160.8% | +73.2% | +36.7% |
| Río Negro Province | +105.8% | +50.3% | +25.7% |
| Argentina | +66.4% | +32.6% | +17.1% |
Bariloche Median Age
Median Age: 29.9 years
| Location | Median Age | Median Age (Female) | Median Age (Male) |
|---|---|---|---|
| Bariloche | 29.9 yrs | 31 yrs | 28.8 yrs |
| Río Negro Province | 29.3 yrs | 30.1 yrs | 28.5 yrs |
| Argentina | 29.8 yrs | 30.9 yrs | 28.7 yrs |
Bariloche Population Density
Population Density: 26 / km²
| Location | Population | Area | Density |
|---|---|---|---|
| Bariloche | 152,240 | 5,859.8 km² | 26 / km² |
| Río Negro Province | 700,534 | 202,307 km² | 3.5 / km² |
| Argentina | 43.2 million | 2,779,516.9 km² | 15.5 / km² |
Bariloche Historical and Projected Population
Estimated Population from 1910 to 2100
- JRC (European Commission's Joint Research Centre) work on the GHS built-up grid
- CIESIN (Center for International Earth Science Information Network)
- [Link] Klein Goldewijk, K., Beusen, A., Doelman, J., and Stehfest, E.: Anthropogenic land use estimates for the Holocene – HYDE 3.2, Earth Syst. Sci. Data, 9, 927–953, https://doi.org/10.5194/essd-9-927-2017, 2017.
Neighborhoods in Bariloche
Percentage of businesses by neighborhood in Bariloche
Price Distribution
Business distribution by price for Bariloche
Human Development Index (HDI)
Statistic composite index of life expectancy, education, and per capita income.
Bariloche CO2 Emissions
Carbon Dioxide (CO2) Emissions Per Capita in Tonnes Per Year
| Location | CO2 Emissions | CO2 Emissions Per Capita | CO2 Emissions Intensity |
|---|---|---|---|
| Bariloche | 870,563 tn | 5.72 tn | 148.6 tons/km² |
| Río Negro Province | 3,139,216 tn | 4.48 tn | 15.5 tons/km² |
| Argentina | 198,107,945 tn | 4.59 tn | 71.3 tons/km² |
| 2013 CO2 emissions (tonnes/year) | 870,563 tn |
| 2013 CO2 emissions (tonnes/year) per capita | 5.72 tn |
| 2013 CO2 emissions intensity (tonnes/km²/year) | 148.6 tons/km² |
Natural Hazards Risk
Relative risk out of 10
| Hazard | Risk Level |
|---|---|
| Earthquake | Medium (6) |
| Landslide | High (9) |
* Risk, particularly concerning flood or landslide, may not be for the entire area.
- Dilley, M., R.S. Chen, U. Deichmann, A.L. Lerner-Lam, M. Arnold, J. Agwe, P. Buys, O. Kjekstad, B. Lyon, and G. Yetman. 2005. Natural Disaster Hotspots: A Global Risk Analysis. Washington, D.C.: World Bank. https://doi.org/10.1596/0-8213-5930-4.
- Center for Hazards and Risk Research - CHRR - Columbia University, Center for International Earth Science Information Network - CIESIN - Columbia University, and Norwegian Geotechnical Institute - NGI. 2005. Global Landslide Hazard Distribution. Palisades, NY: NASA Socioeconomic Data and Applications Center (SEDAC). https://doi.org/10.7927/H4P848VZ.
- Center for Hazards and Risk Research - CHRR - Columbia University, Center for International Earth Science Information Network - CIESIN - Columbia University. 2005. Global Earthquake Hazard Distribution - Peak Ground Acceleration. Palisades, NY: NASA Socioeconomic Data and Applications Center (SEDAC). https://doi.org/10.7927/H4BZ63ZS.
Recent Nearby Earthquakes
Magnitude 3.0 and greater
| Date▼ | Time↕ | Magnitude↕ | Distance↕ | Depth↕ | Location↕ | Link |
|---|---|---|---|---|---|---|
| 10/22/17 | 3:41 PM | 4.4 | 83.2 km | 127,220 m | 58km ENE of Puerto Montt, Chile | usgs.gov |
| 3/6/17 | 2:56 AM | 4.6 | 95.8 km | 144,300 m | 44km NNW of Villa La Angostura, Argentina | usgs.gov |
| 6/4/11 | 5:54 PM | 4.9 | 84.8 km | 14,200 m | Neuquen, Argentina | usgs.gov |
| 6/4/11 | 5:30 PM | 4.4 | 89.9 km | 10,000 m | Los Lagos, Chile | usgs.gov |
| 6/4/11 | 5:00 PM | 4.7 | 96 km | 10,000 m | Los Lagos, Chile | usgs.gov |
| 6/4/11 | 4:28 PM | 5 | 83.3 km | 9,800 m | Los Lagos, Chile | usgs.gov |
| 6/4/11 | 3:19 PM | 4.6 | 78.3 km | 10,000 m | Los Lagos, Chile | usgs.gov |
| 6/4/11 | 3:05 PM | 4.7 | 98.7 km | 7,200 m | Los Lagos, Chile | usgs.gov |
| 6/4/11 | 2:52 PM | 4.4 | 99.2 km | 18,900 m | Los Lagos, Chile | usgs.gov |
| 6/4/11 | 1:48 PM | 4.7 | 90.6 km | 10,000 m | Los Lagos, Chile | usgs.gov |
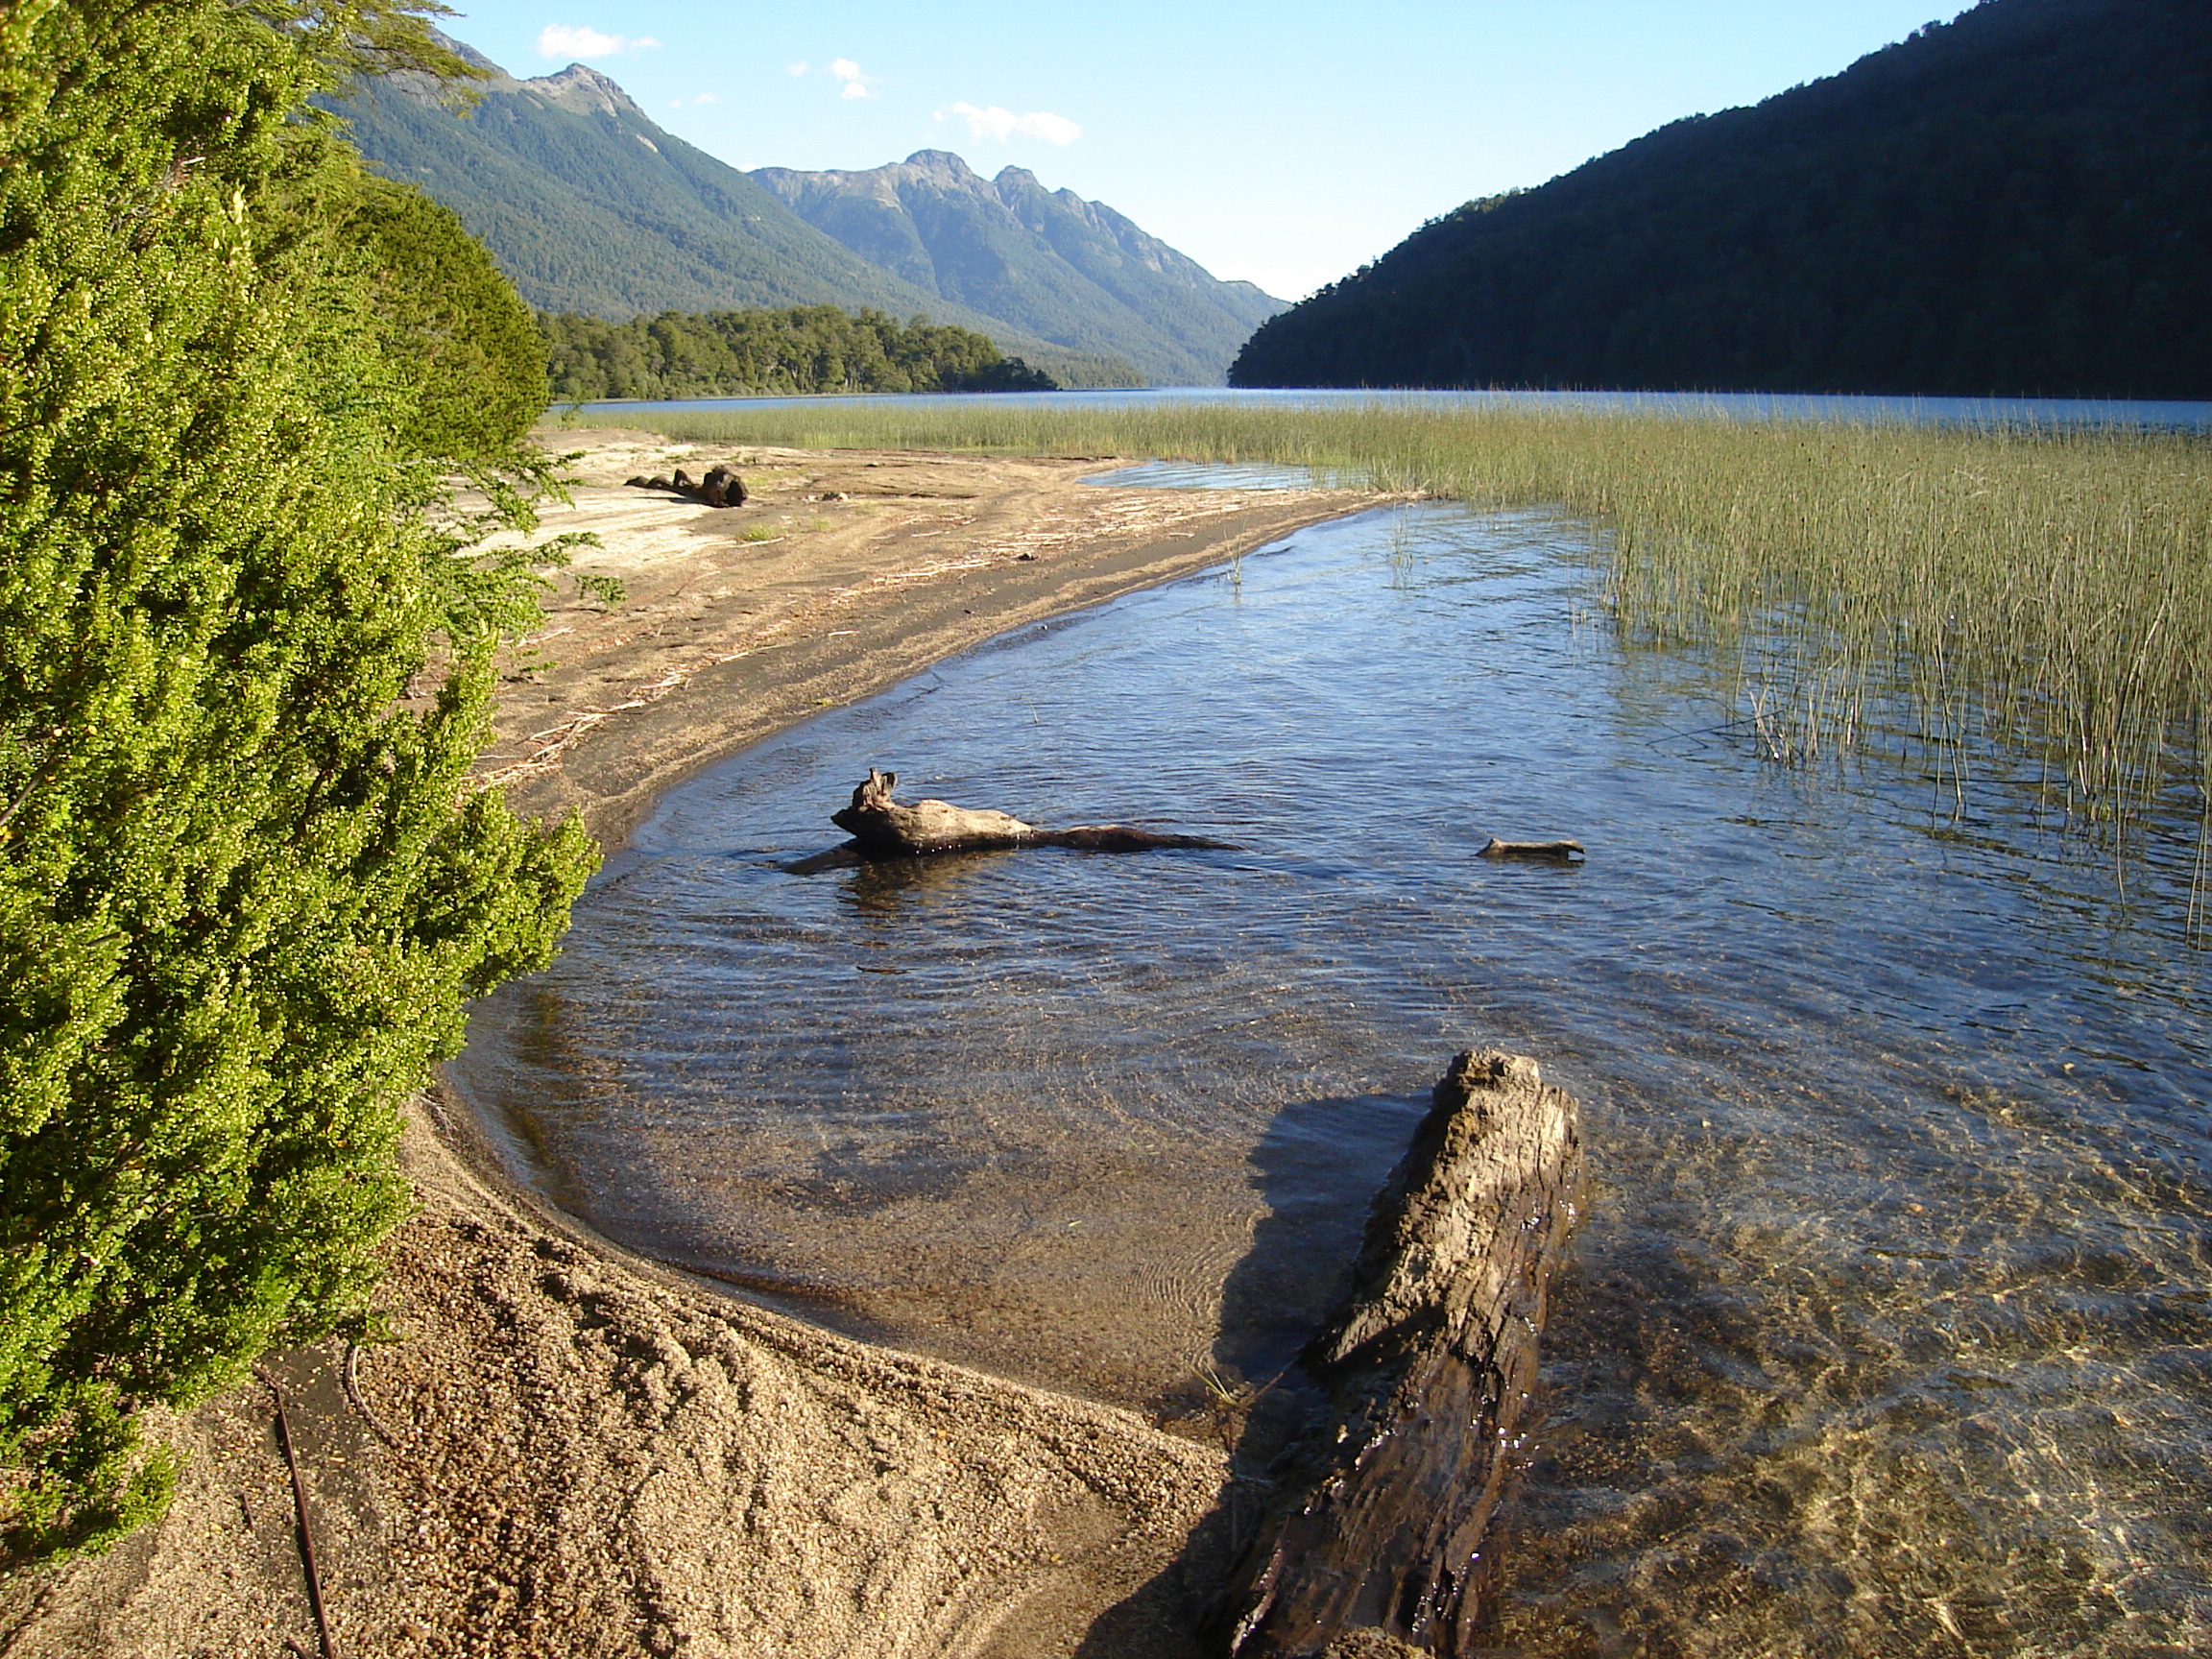
Bariloche
San Carlos de Bariloche, usually known as Bariloche, is a city in the province of Río Negro, Argentina, situated in the foothills of the Andes on the southern shores of Nahuel Huapi Lake. It is located within the Nahuel Huapi National Park. After dev..
Bariloche Wikipedia Page

About Our Data
The data on this page is estimated using a number of publicly available tools and resources. It is provided without warranty, and could contain inaccuracies. Use at your own risk.