Industries
Business Distribution by Industry in Maciá
| Industry Description | Number of Establishments |
|---|---|
| Shopping | 21 |
| Grocery stores and supermarkets | 13 |
| Education | 12 |
| Car repair | 10 |
| Radio broadcasting | 7 |
| Gas station | 7 |
| Churches | 7 |
| Beauty salons | 6 |
| Restaurants | 5 |
| Unreachable | 5 |
| Pharmacies and drug stores | 5 |
| Clothing stores | 5 |
Maciá Facts
| Area | 1.7 km² |
| Population | 4,318 |
| Population change (1975 to 2020) | +1.1% |
| Population change (2000 to 2020) | +3.7% |
| Area Codes | 3445 |
| Local Time | |
| Timezone | Argentina Standard Time |
| Lat & Lng | -32.17220, -59.39947 |
Map of Maciá
Interactive Map
Maciá Population
Years 1975 to 2020
| Data | 1975 | 1990 | 2000 | 2015 | 2020 |
|---|---|---|---|---|---|
| Population | 4,269 | 3,686 | 4,163 | 4,176 | 4,318 |
| Population Density | 2,529.8 / km² | 2,184.3 / km² | 2,467 / km² | 2,474.7 / km² | 2,558.8 / km² |
Maciá Population change from 2000 to 2015
Increase of 0.3% from year 2000 to 2015
| Location | Change since 1975 | Change since 1990 | Change since 2000 |
|---|---|---|---|
| Maciá | -2.2% | +13.3% | +0.3% |
| Entre Ríos Province | +45.3% | +20.5% | +10.1% |
| Argentina | +66.4% | +32.6% | +17.1% |
Maciá Population Density
Population Density: 2,559 / km²
| Location | Population | Area | Density |
|---|---|---|---|
| Maciá | 4,318 | 1.688 km² | 2,559 / km² |
| Entre Ríos Province | 1.3 million | 77,839.2 km² | 16.8 / km² |
| Argentina | 43.2 million | 2,779,516.9 km² | 15.5 / km² |
Maciá Historical and Projected Population
Estimated Population from 1800 to 2100
- JRC (European Commission's Joint Research Centre) work on the GHS built-up grid
- CIESIN (Center for International Earth Science Information Network)
- [Link] Klein Goldewijk, K., Beusen, A., Doelman, J., and Stehfest, E.: Anthropogenic land use estimates for the Holocene – HYDE 3.2, Earth Syst. Sci. Data, 9, 927–953, https://doi.org/10.5194/essd-9-927-2017, 2017.
Human Development Index (HDI)
Statistic composite index of life expectancy, education, and per capita income.
Maciá CO2 Emissions
Carbon Dioxide (CO2) Emissions Per Capita in Tonnes Per Year
| Location | CO2 Emissions | CO2 Emissions Per Capita | CO2 Emissions Intensity |
|---|---|---|---|
| Maciá | 19,330 tn | 4.48 tn | 11,455 tons/km² |
| Entre Ríos Province | 5,944,559 tn | 4.54 tn | 76.4 tons/km² |
| Argentina | 198,107,945 tn | 4.59 tn | 71.3 tons/km² |
| 2013 CO2 emissions (tonnes/year) | 19,330 tn |
| 2013 CO2 emissions (tonnes/year) per capita | 4.48 tn |
| 2013 CO2 emissions intensity (tonnes/km²/year) | 11,455 tons/km² |
Natural Hazards Risk
Relative risk out of 10
| Hazard | Risk Level |
|---|---|
| Drought | Low (2) |
| Flood | Medium (4) |
* Risk, particularly concerning flood or landslide, may not be for the entire area.
- Dilley, M., R.S. Chen, U. Deichmann, A.L. Lerner-Lam, M. Arnold, J. Agwe, P. Buys, O. Kjekstad, B. Lyon, and G. Yetman. 2005. Natural Disaster Hotspots: A Global Risk Analysis. Washington, D.C.: World Bank. https://doi.org/10.1596/0-8213-5930-4.
- Center for Hazards and Risk Research - CHRR - Columbia University, Center for International Earth Science Information Network - CIESIN - Columbia University, and International Research Institute for Climate and Society - IRI - Columbia University. 2005. Global Drought Hazard Frequency and Distribution. Palisades, NY: NASA Socioeconomic Data and Applications Center (SEDAC). https://doi.org/10.7927/H4VX0DFT.
- Center for Hazards and Risk Research - CHRR - Columbia University, Center for International Earth Science Information Network - CIESIN - Columbia University. 2005. Global Flood Hazard Frequency and Distribution. Palisades, NY: NASA Socioeconomic Data and Applications Center (SEDAC). https://doi.org/10.7927/H4668B3D.
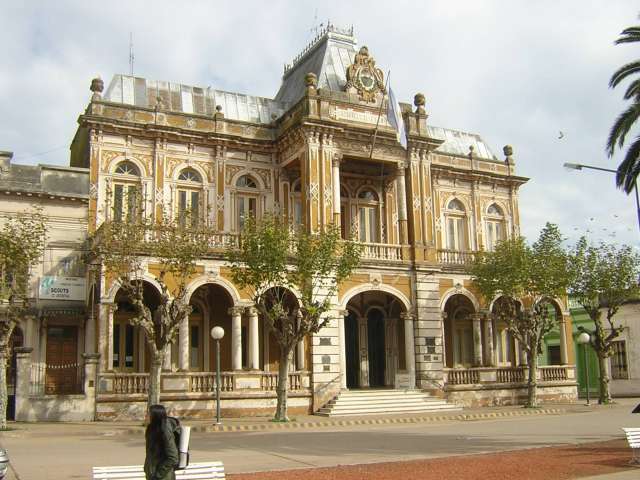
Maciá
Maciá is a village and municipality in Entre Ríos Province in north-eastern Argentina. is named after Salvador Maciá (1855-1929), a physician and provincial governor.
Maciá Wikipedia Page

About Our Data
The data on this page is estimated using a number of publicly available tools and resources. It is provided without warranty, and could contain inaccuracies. Use at your own risk.