Industries
Business Distribution by Industry in Kilb
| Industry Description | Number of Establishments |
|---|---|
| Shopping | 14 |
| Other accommodation | 9 |
| Education | 7 |
| Health and medical | 6 |
| Cafes | 5 |
| Construction of buildings | 5 |
| Car repair | 5 |
Kilb Facts
| Area | 0.4 km² |
| Population | 634 |
| Male Population | 310 (48.9%) |
| Female Population | 324 (51.1%) |
| Population change (1975 to 2020) | -41.6% |
| Population change (2000 to 2020) | -9.4% |
| Median Age | 41.4 years (Male: 41, Female: 41.9) |
| Area Codes | 2722, 2723, 2748, 2755 |
| Local Time | |
| Timezone | Central European Summer Time |
| Lat & Lng | 48.10101, 15.40850 |
Map of Kilb
Interactive Map
Kilb Population
Years 1975 to 2020
| Data | 1975 | 1990 | 2000 | 2015 | 2020 |
|---|---|---|---|---|---|
| Population | 1,085 | 774 | 700 | 628 | 634 |
| Population Density | 2,480 / km² | 1,769.1 / km² | 1,600 / km² | 1,435.4 / km² | 1,449.1 / km² |
Sources: JRC (European Commission's Joint Research Centre) work on the GHS built-up grid
Kilb Population change from 2000 to 2015
Decrease of 10.3% from year 2000 to 2015
| Location | Change since 1975 | Change since 1990 | Change since 2000 |
|---|---|---|---|
| Kilb | -42.1% | -18.9% | -10.3% |
| Lower Austria | +10.3% | +9.9% | +5.6% |
| Austria | +12.1% | +10.9% | +6.1% |
Sources: JRC (European Commission's Joint Research Centre) work on the GHS built-up grid
Kilb Median Age
Median Age: 41.4 years
| Location | Median Age | Median Age (Female) | Median Age (Male) |
|---|---|---|---|
| Kilb | 41.4 yrs | 41.9 yrs | 41 yrs |
| Lower Austria | 43.4 yrs | 44.4 yrs | 42.3 yrs |
| Austria | 42.3 yrs | 43.5 yrs | 41.1 yrs |
Sources: CIESIN (Center for International Earth Science Information Network)
Kilb Population Density
Population Density: 1,449 / km²
| Location | Population | Area | Density |
|---|---|---|---|
| Kilb | 634 | 0.438 km² | 1,449 / km² |
| Lower Austria | 1.6 million | 19,195.1 km² | 85.7 / km² |
| Austria | 8.5 million | 83,905.5 km² | 102 / km² |
Sources: JRC (European Commission's Joint Research Centre) work on the GHS built-up grid
Kilb Historical and Projected Population
Estimated Population from 0 to 2100
Sources:
- JRC (European Commission's Joint Research Centre) work on the GHS built-up grid
- CIESIN (Center for International Earth Science Information Network)
- [Link] Klein Goldewijk, K., Beusen, A., Doelman, J., and Stehfest, E.: Anthropogenic land use estimates for the Holocene – HYDE 3.2, Earth Syst. Sci. Data, 9, 927–953, https://doi.org/10.5194/essd-9-927-2017, 2017.
Human Development Index (HDI)
Statistic composite index of life expectancy, education, and per capita income.
Source: [Link] Kummu, M., Taka, M. &Guillaume, J. Gridded global datasets for Gross Domestic Product and Human Development Index over 1990–2015. Sci Data 5, 180004 (2018) doi:10.1038/sdata.2018.4
Kilb CO2 Emissions
Carbon Dioxide (CO2) Emissions Per Capita in Tonnes Per Year
| Location | CO2 Emissions | CO2 Emissions Per Capita | CO2 Emissions Intensity |
|---|---|---|---|
| Kilb | 6,936 tn | 10.94 tn | 15,852.8 tons/km² |
| Lower Austria | 18,266,371 tn | 11.11 tn | 951.6 tons/km² |
| Austria | 91,216,590 tn | 10.69 tn | 1,087.1 tons/km² |
Sources: [Link] Moran, D., Kanemoto K; Jiborn, M., Wood, R., Többen, J., and Seto, K.C. (2018) Carbon footprints of 13,000 cities. Environmental Research Letters DOI: 10.1088/1748-9326/aac72a
Kilb CO2 Emissions
| 2013 CO2 emissions (tonnes/year) | 6,936 tn |
| 2013 CO2 emissions (tonnes/year) per capita | 10.94 tn |
| 2013 CO2 emissions intensity (tonnes/km²/year) | 15,852.8 tons/km² |
Natural Hazards Risk
Relative risk out of 10
| Hazard | Risk Level |
|---|---|
| Flood | Medium (4) |
| Earthquake | Medium (4) |
* Risk, particularly concerning flood or landslide, may not be for the entire area.
Sources:
- Dilley, M., R.S. Chen, U. Deichmann, A.L. Lerner-Lam, M. Arnold, J. Agwe, P. Buys, O. Kjekstad, B. Lyon, and G. Yetman. 2005. Natural Disaster Hotspots: A Global Risk Analysis. Washington, D.C.: World Bank. https://doi.org/10.1596/0-8213-5930-4.
- Center for Hazards and Risk Research - CHRR - Columbia University, Center for International Earth Science Information Network - CIESIN - Columbia University. 2005. Global Flood Hazard Frequency and Distribution. Palisades, NY: NASA Socioeconomic Data and Applications Center (SEDAC). https://doi.org/10.7927/H4668B3D.
- Center for Hazards and Risk Research - CHRR - Columbia University, Center for International Earth Science Information Network - CIESIN - Columbia University. 2005. Global Earthquake Hazard Distribution - Peak Ground Acceleration. Palisades, NY: NASA Socioeconomic Data and Applications Center (SEDAC). https://doi.org/10.7927/H4BZ63ZS.
Recent Nearby Earthquakes
Magnitude 3.0 and greater
| Date▼ | Time↕ | Magnitude↕ | Distance↕ | Depth↕ | Location↕ | Link |
|---|---|---|---|---|---|---|
| 4/25/16 | 10:28 AM | 4.2 | 54.7 km | 3,460 m | 3km NNE of Heiligenkreuz, Austria | usgs.gov |
| 10/2/13 | 5:17 PM | 3.6 | 78.9 km | 11,550 m | 2km SW of Mitterndorf an der Fischa, Austria | usgs.gov |
| 9/20/13 | 2:06 AM | 4.2 | 81.7 km | 14,570 m | 1km SSE of Leithaprodersdorf, Austria | usgs.gov |
| 5/7/09 | 9:27 PM | 4.2 | 62.5 km | 11,900 m | Austria | usgs.gov |
| 12/7/08 | 2:47 AM | 3.9 | 58.7 km | 10,000 m | Austria | usgs.gov |
| 6/22/08 | 3:05 PM | 3.2 | 94.9 km | 1,300 m | Austria | usgs.gov |
| 6/3/08 | 7:42 PM | 3.1 | 49.9 km | 6,600 m | Austria | usgs.gov |
| 2/26/08 | 7:57 PM | 3.9 | 65.4 km | 10,000 m | Austria | usgs.gov |
| 1/30/08 | 2:54 PM | 3.8 | 70.3 km | 10,000 m | Austria | usgs.gov |
| 11/12/06 | 7:26 PM | 3.5 | 88.3 km | 10,000 m | Austria | usgs.gov |
Source: U.S. Geological Survey (USGS)
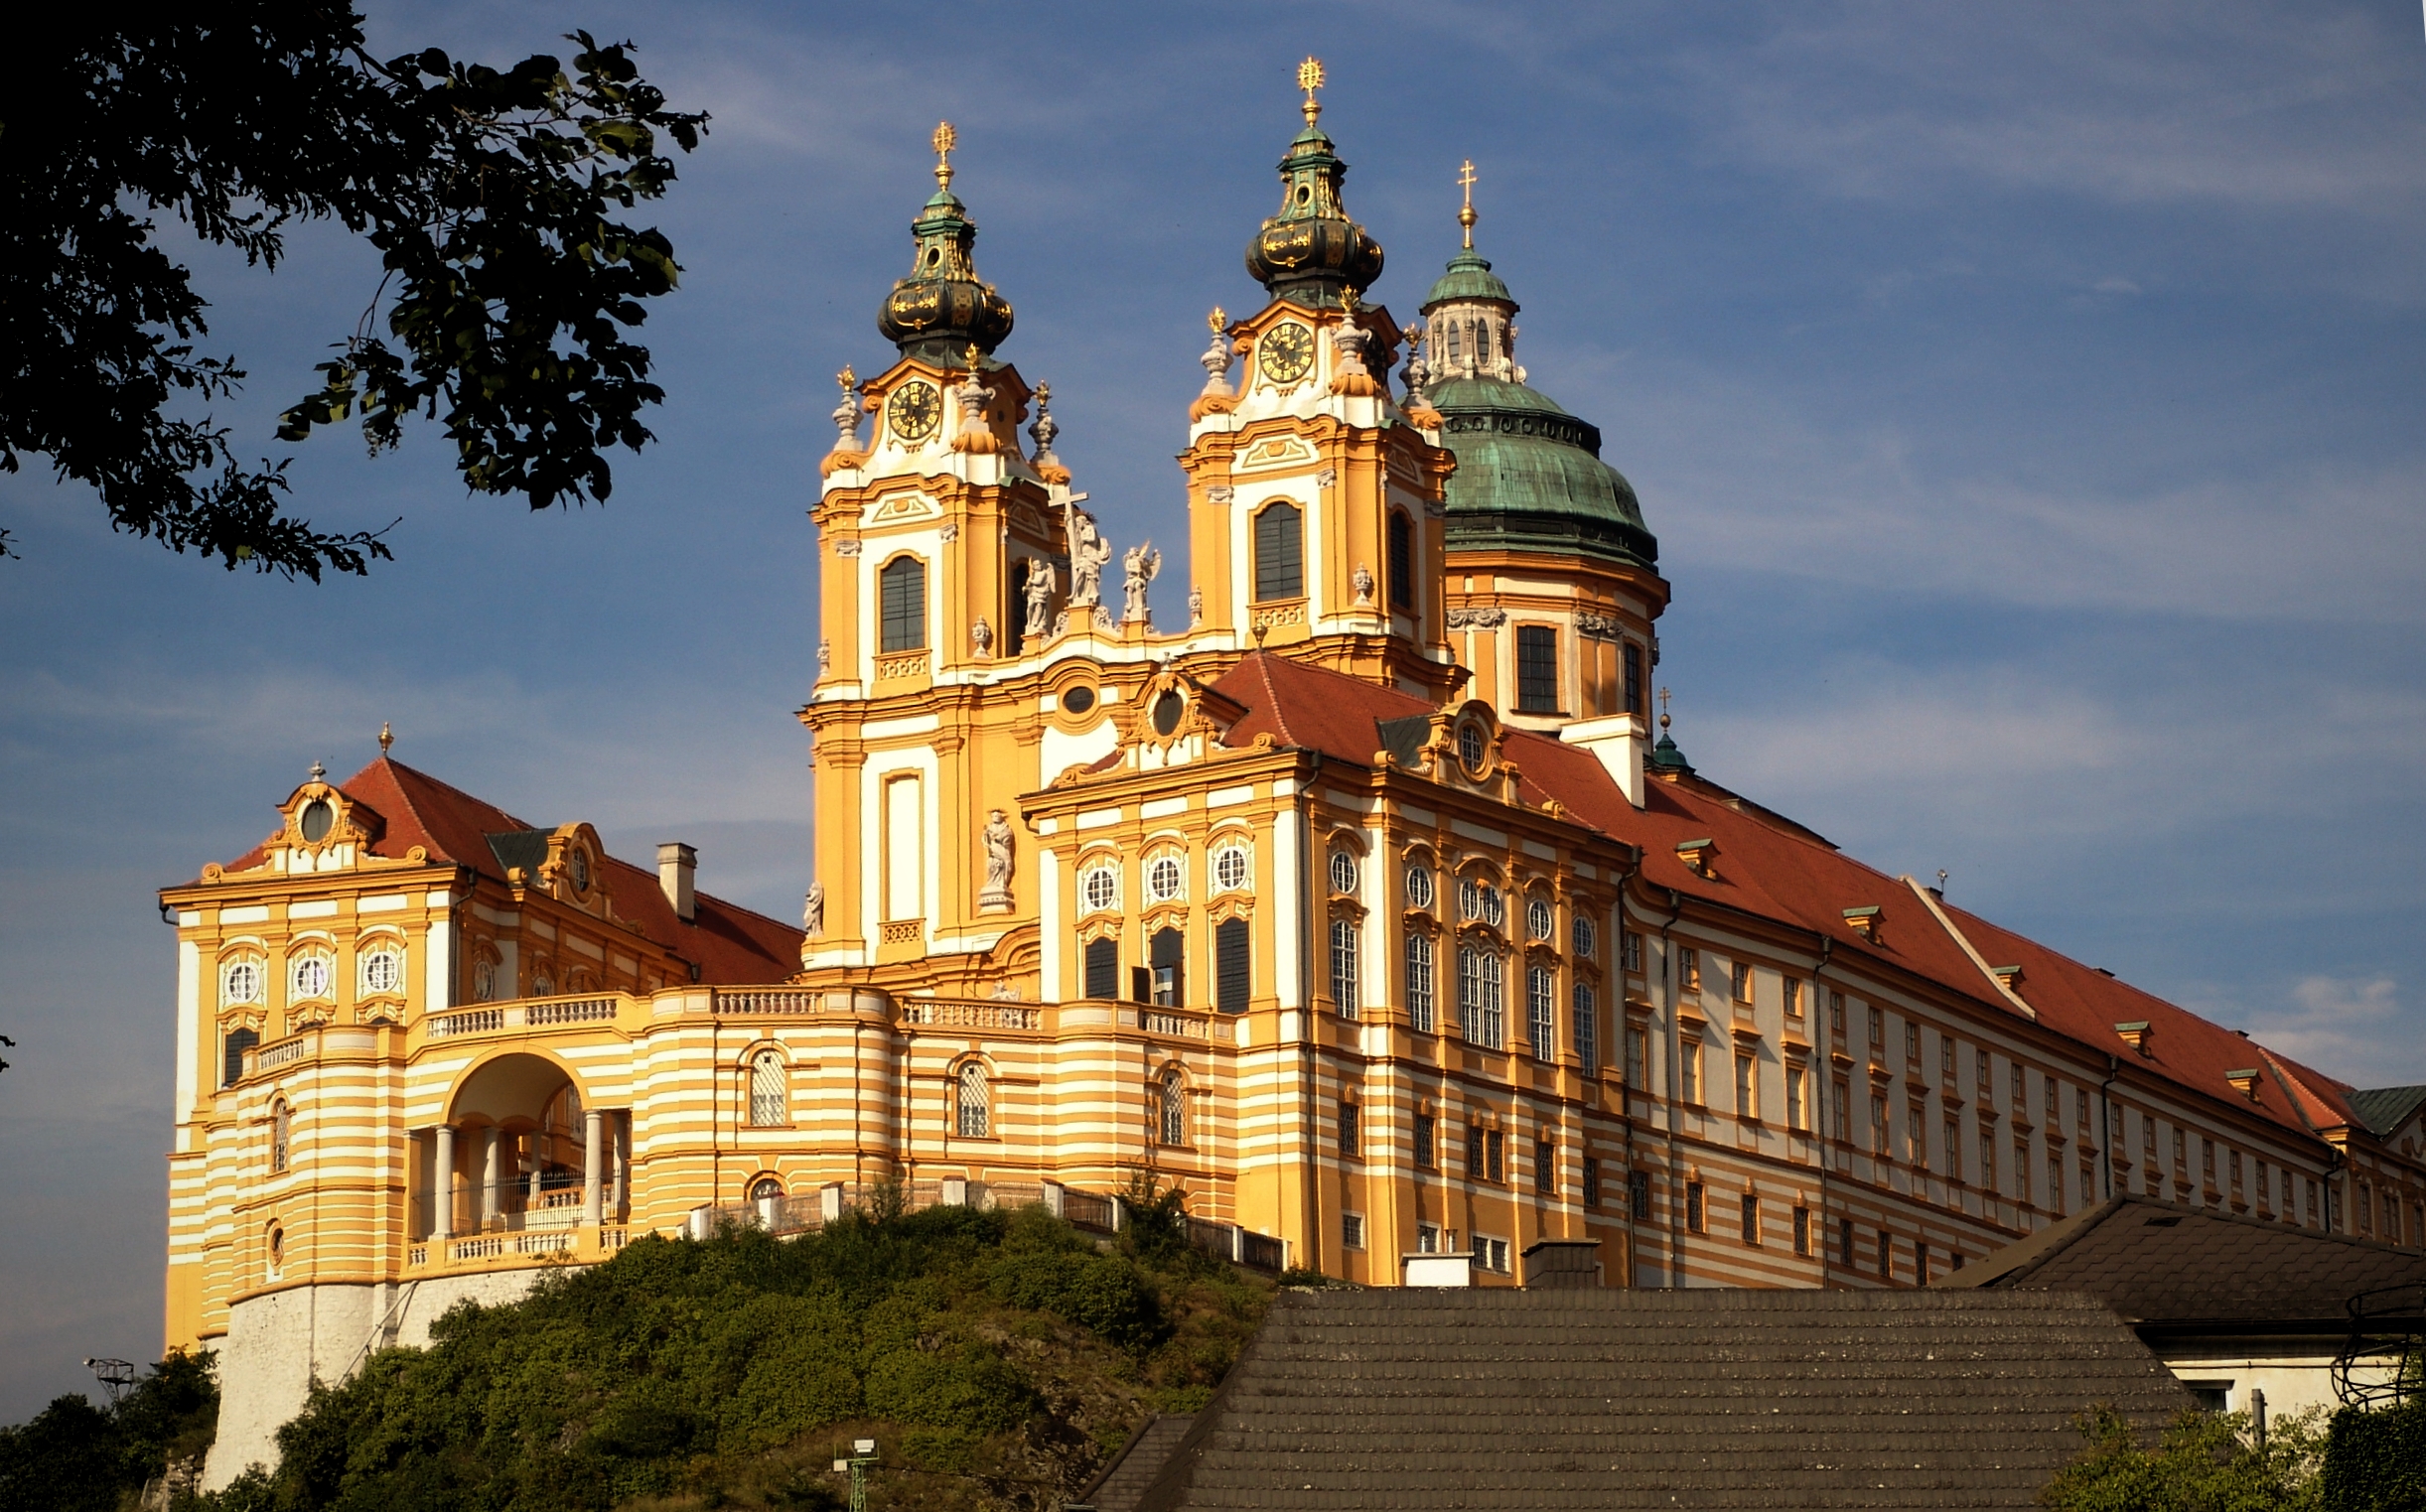
Kilb
Kilb is a town in the district of Melk in the Austrian state of Lower Austria.
Kilb Wikipedia Page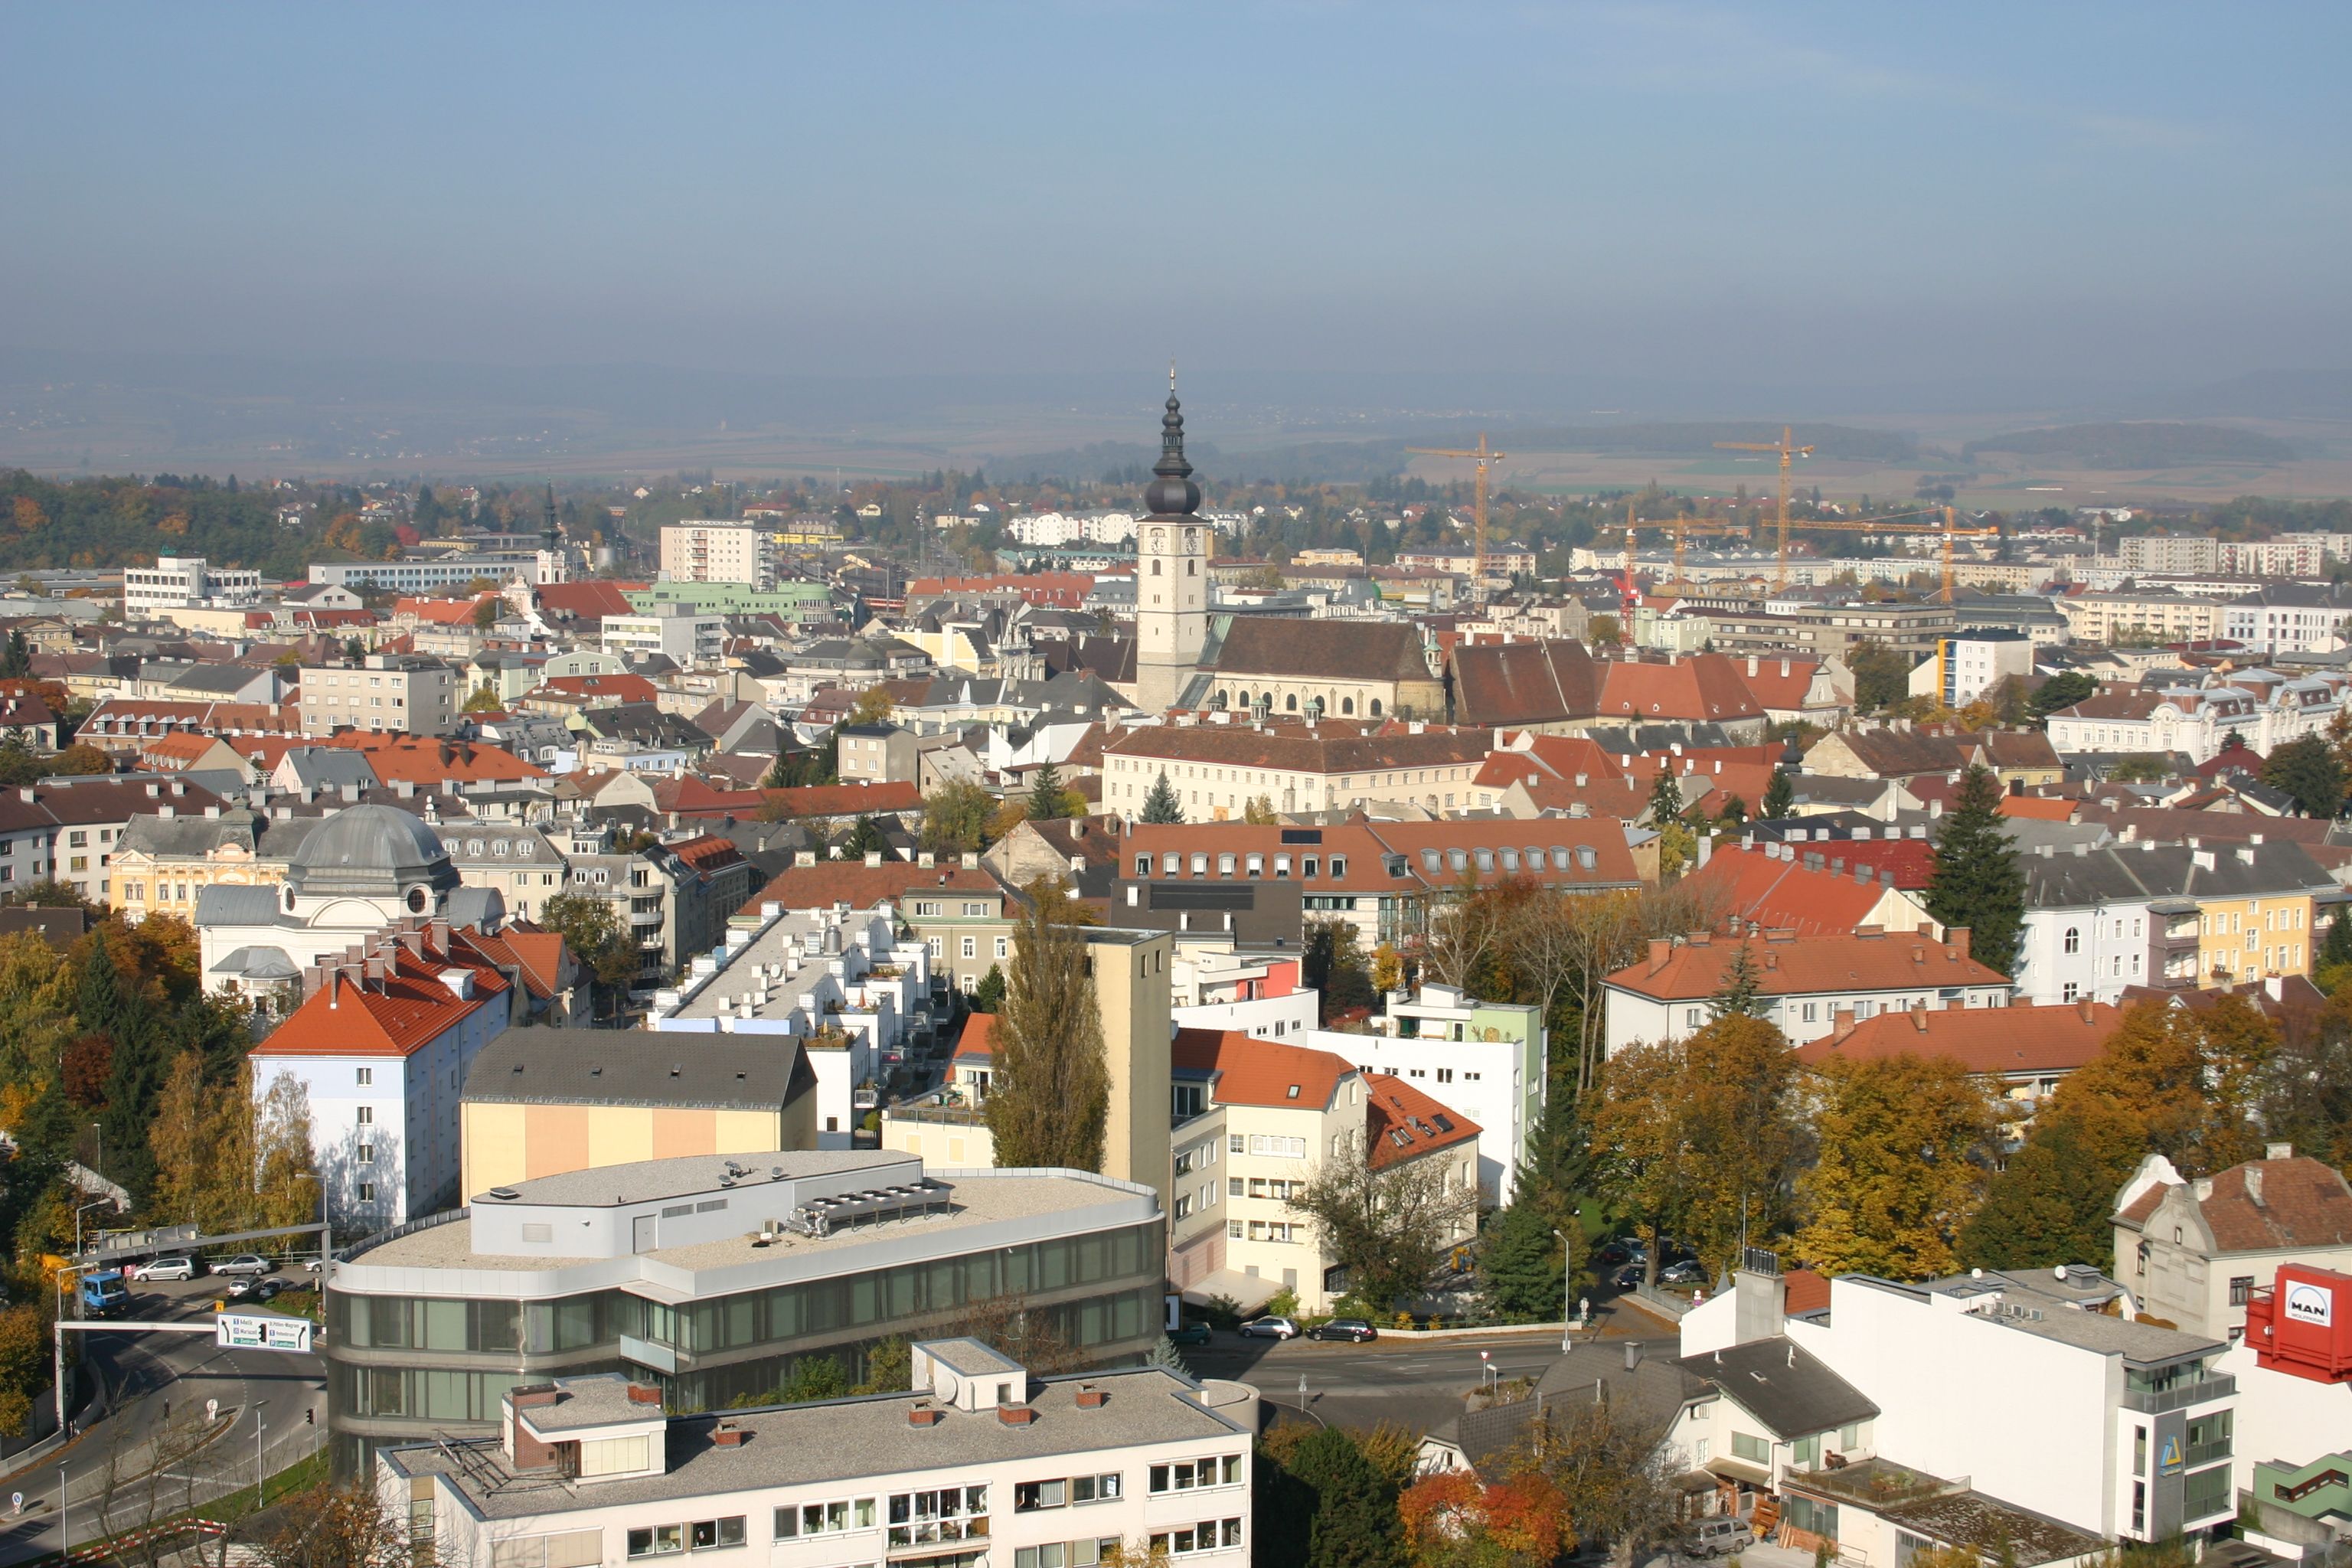

About Our Data
The data on this page is estimated using a number of publicly available tools and resources. It is provided without warranty, and could contain inaccuracies. Use at your own risk.