Categories in Kinrooi
Industries
Business Distribution by Industry in Kinrooi
| Industry Description | Number of Establishments | Average Age of Business |
|---|---|---|
| Restaurants | 78 | 16 years |
| Unreachable | 63 | 21 years |
| Shopping | 59 | 34 years |
| Other construction | 54 | — |
| Beauty salons | 52 | — |
| Corporate management | 49 | 24 years |
| Construction of buildings | 42 | 25 years |
| Hairdressers | 40 | — |
| Sports clubs | 37 | — |
| Health and medical | 37 | — |
| Cafes | 33 | — |
| Car repair | 30 | — |
| Fruits and vegetables | 30 | — |
| Construction of houses | 28 | — |
| Hardware store | 27 | 37 years |
Kinrooi Facts
| Area | 3.0 km² |
| Population | 2,363 |
| Male Population | 1,205 (51.0%) |
| Female Population | 1,158 (49.0%) |
| Population change (1975 to 2020) | -12.7% |
| Population change (2000 to 2020) | -3.3% |
| Median Age | 44.5 years (Male: 44.5, Female: 44.4) |
| Neighborhoods | Mol, Balen, Ekeren, Kinrooi, Ophoven |
| Local Time | |
| Timezone | Central European Summer Time |
| Lat & Lng | 51.14543, 5.74207 |
Map of Kinrooi
Interactive Map
Kinrooi Population
Years 1975 to 2020
| Data | 1975 | 1990 | 2000 | 2015 | 2020 |
|---|---|---|---|---|---|
| Population | 2,708 | 2,871 | 2,443 | 2,336 | 2,363 |
| Population Density | 902.7 / km² | 957 / km² | 814.3 / km² | 778.7 / km² | 787.7 / km² |
Kinrooi Population change from 2000 to 2015
Decrease of 4.4% from year 2000 to 2015
| Location | Change since 1975 | Change since 1990 | Change since 2000 |
|---|---|---|---|
| Kinrooi | -13.7% | -18.6% | -4.4% |
| Belgium | +15.7% | +13.2% | +10% |
Kinrooi Median Age
Median Age: 44.5 years
| Location | Median Age | Median Age (Female) | Median Age (Male) |
|---|---|---|---|
| Kinrooi | 44.5 yrs | 44.4 yrs | 44.5 yrs |
| Belgium | 41.3 yrs | 42.5 yrs | 40.3 yrs |
Kinrooi Population Density
Population Density: 788 / km²
| Location | Population | Area | Density |
|---|---|---|---|
| Kinrooi | 2,363 | 3 km² | 788 / km² |
| Belgium | 11.3 million | 30,664.8 km² | 368 / km² |
Kinrooi Historical and Projected Population
Estimated Population from 0 to 2100
- JRC (European Commission's Joint Research Centre) work on the GHS built-up grid
- CIESIN (Center for International Earth Science Information Network)
- [Link] Klein Goldewijk, K., Beusen, A., Doelman, J., and Stehfest, E.: Anthropogenic land use estimates for the Holocene – HYDE 3.2, Earth Syst. Sci. Data, 9, 927–953, https://doi.org/10.5194/essd-9-927-2017, 2017.
Neighborhoods in Kinrooi
Percentage of businesses by neighborhood in Kinrooi
Area Codes
Percentage Area Codes used by businesses in Kinrooi
Price Distribution
Business distribution by price for Kinrooi
Human Development Index (HDI)
Statistic composite index of life expectancy, education, and per capita income.
Kinrooi CO2 Emissions
Carbon Dioxide (CO2) Emissions Per Capita in Tonnes Per Year
| Location | CO2 Emissions | CO2 Emissions Per Capita | CO2 Emissions Intensity |
|---|---|---|---|
| Kinrooi | 18,784 tn | 7.95 tn | 6,261.2 tons/km² |
| Belgium | 92,691,347 tn | 8.22 tn | 3,022.7 tons/km² |
| 2013 CO2 emissions (tonnes/year) | 18,784 tn |
| 2013 CO2 emissions (tonnes/year) per capita | 7.95 tn |
| 2013 CO2 emissions intensity (tonnes/km²/year) | 6,261.2 tons/km² |
Natural Hazards Risk
Relative risk out of 10
| Hazard | Risk Level |
|---|---|
| Flood | Medium (4) |
| Earthquake | Low (2) |
* Risk, particularly concerning flood or landslide, may not be for the entire area.
- Dilley, M., R.S. Chen, U. Deichmann, A.L. Lerner-Lam, M. Arnold, J. Agwe, P. Buys, O. Kjekstad, B. Lyon, and G. Yetman. 2005. Natural Disaster Hotspots: A Global Risk Analysis. Washington, D.C.: World Bank. https://doi.org/10.1596/0-8213-5930-4.
- Center for Hazards and Risk Research - CHRR - Columbia University, Center for International Earth Science Information Network - CIESIN - Columbia University. 2005. Global Flood Hazard Frequency and Distribution. Palisades, NY: NASA Socioeconomic Data and Applications Center (SEDAC). https://doi.org/10.7927/H4668B3D.
- Center for Hazards and Risk Research - CHRR - Columbia University, Center for International Earth Science Information Network - CIESIN - Columbia University. 2005. Global Earthquake Hazard Distribution - Peak Ground Acceleration. Palisades, NY: NASA Socioeconomic Data and Applications Center (SEDAC). https://doi.org/10.7927/H4BZ63ZS.
Recent Nearby Earthquakes
Magnitude 3.0 and greater
| Date▼ | Time↕ | Magnitude↕ | Distance↕ | Depth↕ | Location↕ | Link |
|---|---|---|---|---|---|---|
| 9/8/11 | 7:02 PM | 4.2 | 63 km | 6,000 m | Germany | usgs.gov |
| 12/8/08 | 5:21 PM | 3 | 52 km | 2,000 m | Germany | usgs.gov |
| 3/11/08 | 6:17 PM | 3.4 | 59.3 km | 10,000 m | Germany | usgs.gov |
| 1/24/08 | 3:30 AM | 3.7 | 63.2 km | 10,000 m | Germany | usgs.gov |
| 12/12/07 | 2:52 PM | 3.7 | 64.1 km | 5,000 m | Germany | usgs.gov |
| 11/25/07 | 3:10 AM | 3.7 | 78.4 km | 13,000 m | Belgium | usgs.gov |
| 3/31/07 | 6:46 AM | 3 | 74.7 km | 15,600 m | Belgium | usgs.gov |
| 1/24/07 | 3:23 PM | 3 | 65.7 km | 2,600 m | Germany | usgs.gov |
| 11/28/06 | 8:19 AM | 3.1 | 14.2 km | 4,000 m | The Netherlands | usgs.gov |
| 5/20/05 | 7:38 AM | 3 | 66.4 km | 10,000 m | Belgium | usgs.gov |
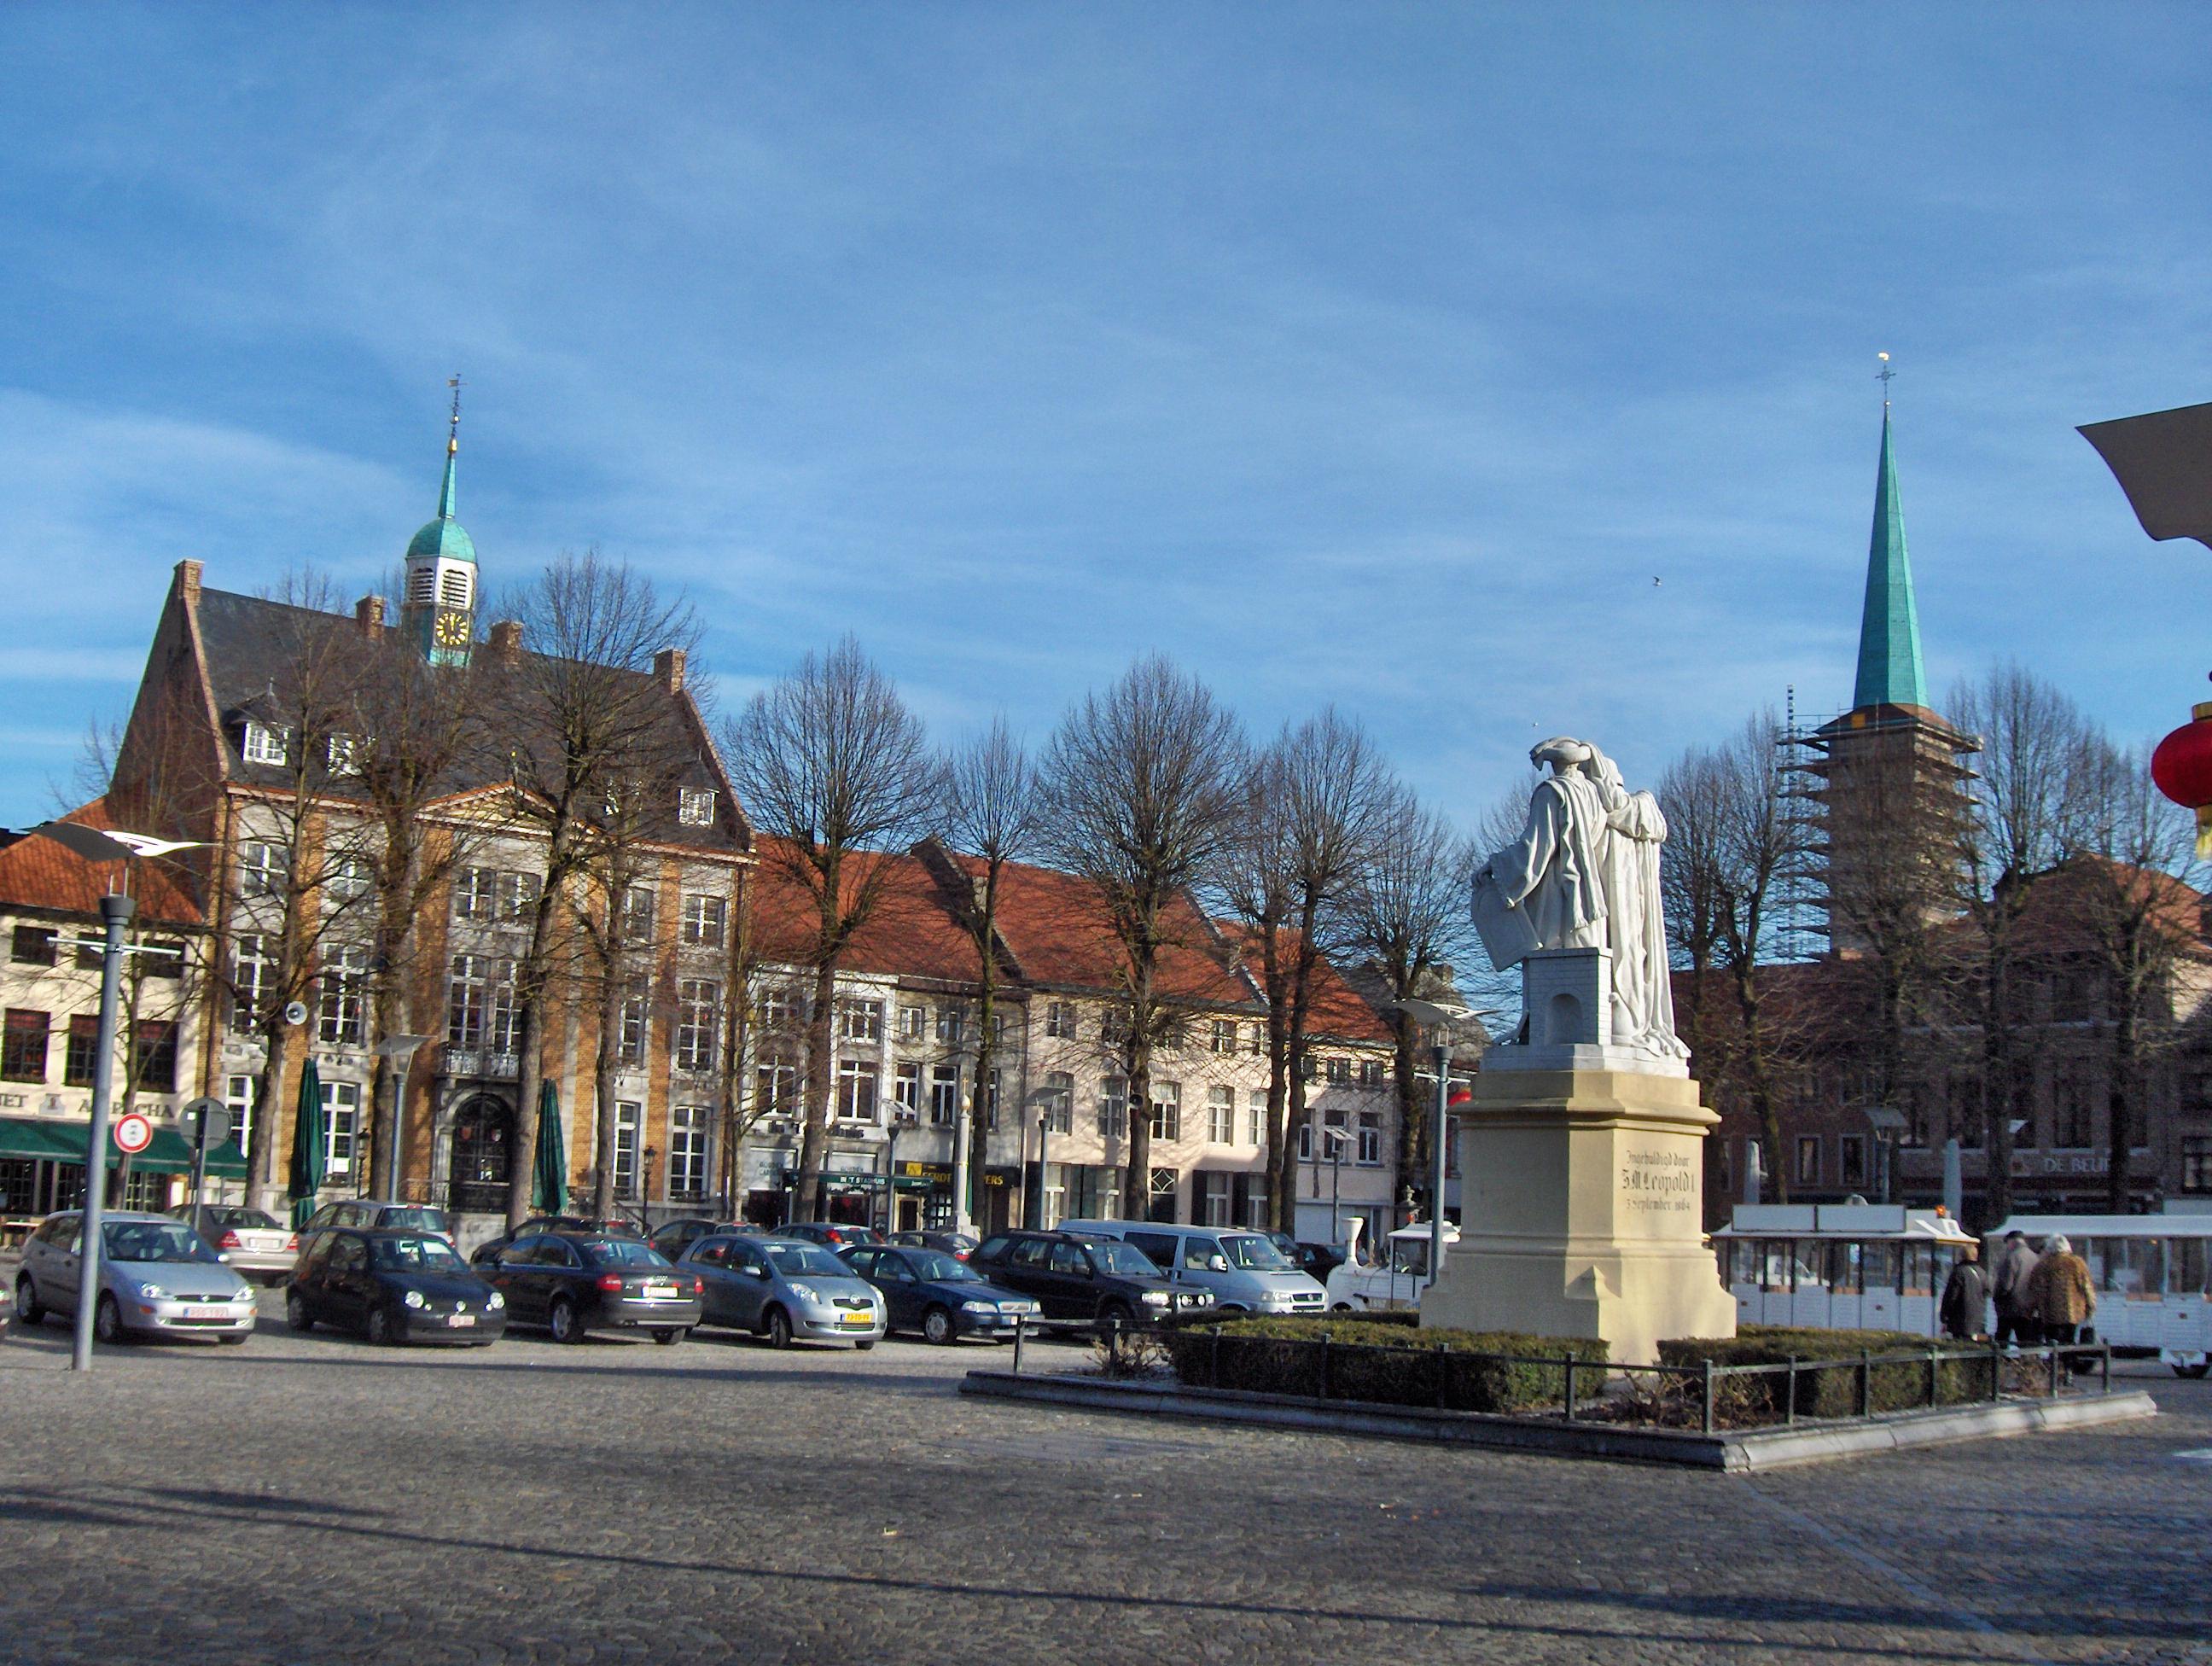
Kinrooi
Kinrooi is a municipality located in the Belgian province of Limburg, between Maaseik and Bree. On January 1, 2006, Kinrooi had a total population of 11,977. The total area is 54.76 km² which gives a population density of 219 inhabitants per km². wa..
Kinrooi Wikipedia Page

About Our Data
The data on this page is estimated using a number of publicly available tools and resources. It is provided without warranty, and could contain inaccuracies. Use at your own risk.