Categories in Sainte-Ode
Industries
Business Distribution by Industry in Sainte-Ode
| Industry Description | Number of Establishments |
|---|---|
| Other accommodation | 25 |
| Unreachable | 23 |
| Health and medical | 16 |
| Cemeteries and crematoriums | 10 |
| Restaurants | 10 |
| Beauty salons | 10 |
| Sports clubs | 10 |
| Physiotherapy | 9 |
| Shopping | 9 |
| Car repair | 8 |
Sainte-Ode Facts
| Area | 122.9 km² |
| Population | 2,524 |
| Male Population | 1,267 (50.2%) |
| Female Population | 1,257 (49.8%) |
| Population change (1975 to 2020) | +19.2% |
| Population change (2000 to 2020) | +10.6% |
| Median Age | 40.7 years (Male: 40.1, Female: 41.3) |
| Neighborhoods | Amberloup, Tillet, Lavacherie |
| Local Time | |
| Timezone | Central European Summer Time |
| Lat & Lng | 50.01723, 5.51926 |
| Postal Codes | 6680, 6681 |
Map of Sainte-Ode
Interactive Map
Sainte-Ode Population
Years 1975 to 2020
| Data | 1975 | 1990 | 2000 | 2015 | 2020 |
|---|---|---|---|---|---|
| Population | 2,117 | 2,211 | 2,282 | 2,546 | 2,524 |
| Population Density | 17.2 / km² | 18 / km² | 18.6 / km² | 20.7 / km² | 20.5 / km² |
Sainte-Ode Population change from 2000 to 2015
Increase of 11.6% from year 2000 to 2015
| Location | Change since 1975 | Change since 1990 | Change since 2000 |
|---|---|---|---|
| Sainte-Ode | +20.3% | +15.2% | +11.6% |
| Belgium | +15.7% | +13.2% | +10% |
Sainte-Ode Median Age
Median Age: 40.7 years
| Location | Median Age | Median Age (Female) | Median Age (Male) |
|---|---|---|---|
| Sainte-Ode | 40.7 yrs | 41.3 yrs | 40.1 yrs |
| Belgium | 41.3 yrs | 42.5 yrs | 40.3 yrs |
Sainte-Ode Population Density
Population Density: 20.5 / km²
| Location | Population | Area | Density |
|---|---|---|---|
| Sainte-Ode | 2,524 | 122.9 km² | 20.5 / km² |
| Belgium | 11.3 million | 30,664.8 km² | 368 / km² |
Sainte-Ode Historical and Projected Population
Estimated Population from 0 to 2100
- JRC (European Commission's Joint Research Centre) work on the GHS built-up grid
- CIESIN (Center for International Earth Science Information Network)
- [Link] Klein Goldewijk, K., Beusen, A., Doelman, J., and Stehfest, E.: Anthropogenic land use estimates for the Holocene – HYDE 3.2, Earth Syst. Sci. Data, 9, 927–953, https://doi.org/10.5194/essd-9-927-2017, 2017.
Neighborhoods in Sainte-Ode
Percentage of businesses by neighborhood in Sainte-Ode
Area Codes
Percentage Area Codes used by businesses in Sainte-Ode
Price Distribution
Business distribution by price for Sainte-Ode
Human Development Index (HDI)
Statistic composite index of life expectancy, education, and per capita income.
Sainte-Ode CO2 Emissions
Carbon Dioxide (CO2) Emissions Per Capita in Tonnes Per Year
| Location | CO2 Emissions | CO2 Emissions Per Capita | CO2 Emissions Intensity |
|---|---|---|---|
| Sainte-Ode | 20,193 tn | 8 tn | 164.3 tons/km² |
| Belgium | 92,691,347 tn | 8.22 tn | 3,022.7 tons/km² |
| 2013 CO2 emissions (tonnes/year) | 20,193 tn |
| 2013 CO2 emissions (tonnes/year) per capita | 8 tn |
| 2013 CO2 emissions intensity (tonnes/km²/year) | 164.3 tons/km² |
Natural Hazards Risk
Relative risk out of 10
| Hazard | Risk Level |
|---|---|
| Flood | Medium (7) |
| Earthquake | Low (2) |
* Risk, particularly concerning flood or landslide, may not be for the entire area.
- Dilley, M., R.S. Chen, U. Deichmann, A.L. Lerner-Lam, M. Arnold, J. Agwe, P. Buys, O. Kjekstad, B. Lyon, and G. Yetman. 2005. Natural Disaster Hotspots: A Global Risk Analysis. Washington, D.C.: World Bank. https://doi.org/10.1596/0-8213-5930-4.
- Center for Hazards and Risk Research - CHRR - Columbia University, Center for International Earth Science Information Network - CIESIN - Columbia University. 2005. Global Flood Hazard Frequency and Distribution. Palisades, NY: NASA Socioeconomic Data and Applications Center (SEDAC). https://doi.org/10.7927/H4668B3D.
- Center for Hazards and Risk Research - CHRR - Columbia University, Center for International Earth Science Information Network - CIESIN - Columbia University. 2005. Global Earthquake Hazard Distribution - Peak Ground Acceleration. Palisades, NY: NASA Socioeconomic Data and Applications Center (SEDAC). https://doi.org/10.7927/H4BZ63ZS.
Recent Nearby Earthquakes
Magnitude 3.0 and greater
| Date▼ | Time↕ | Magnitude↕ | Distance↕ | Depth↕ | Location↕ | Link |
|---|---|---|---|---|---|---|
| 9/13/08 | 1:14 AM | 3.3 | 67.5 km | 5,000 m | Belgium | usgs.gov |
| 7/13/08 | 1:45 PM | 3.8 | 95.9 km | 4,000 m | Belgium | usgs.gov |
| 11/25/07 | 3:10 AM | 3.7 | 53.7 km | 13,000 m | Belgium | usgs.gov |
| 3/31/07 | 6:46 AM | 3 | 53.1 km | 15,600 m | Belgium | usgs.gov |
| 7/14/06 | 12:30 PM | 3.2 | 98.4 km | 7,000 m | Germany | usgs.gov |
| 5/20/05 | 7:38 AM | 3 | 83.3 km | 10,000 m | Belgium | usgs.gov |
| 8/31/02 | 9:28 PM | 3.2 | 97.4 km | 10,000 m | Belgium | usgs.gov |
| 7/22/02 | 12:39 PM | 3.2 | 94.1 km | 10,000 m | Belgium | usgs.gov |
| 7/22/02 | 9:09 AM | 3.3 | 86.6 km | 10,000 m | Belgium | usgs.gov |
| 4/22/02 | 9:16 PM | 3.5 | 95.9 km | 10,000 m | Germany | usgs.gov |
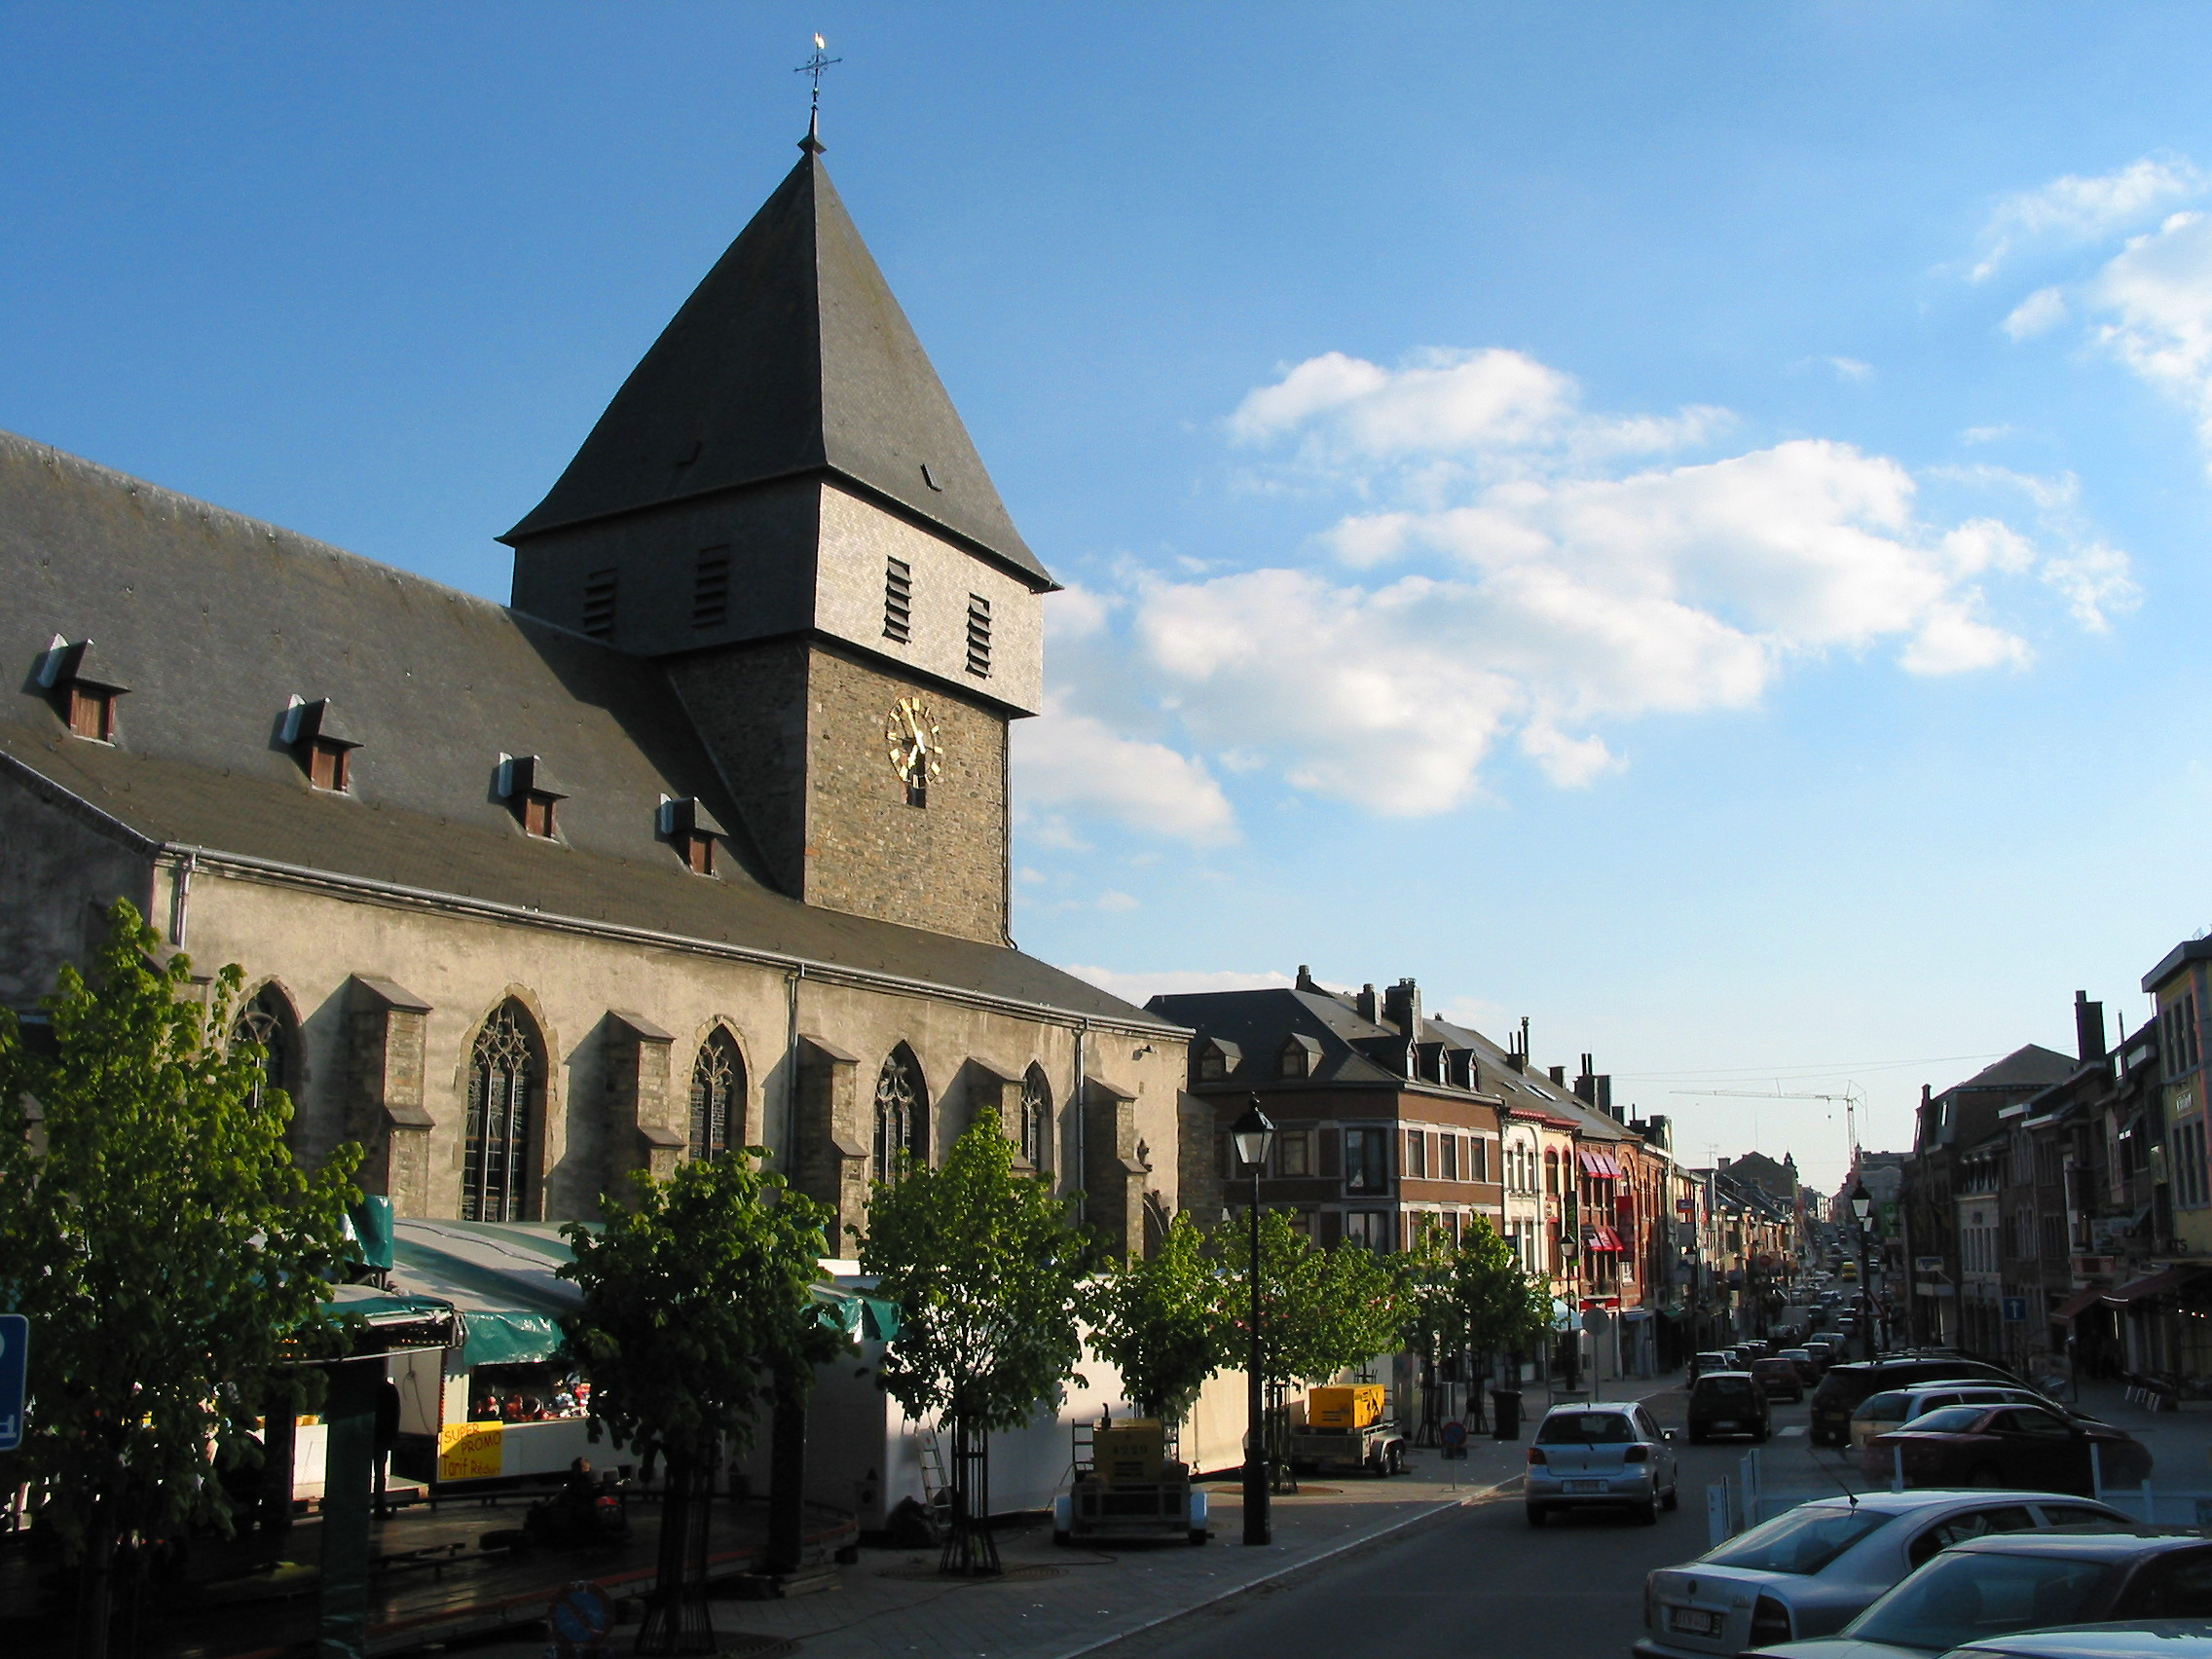
Sainte-Ode
Sainte-Ode is a Walloon municipality of Belgium located in the province of Luxembourg. On 1 January, 2007, the municipality, which covers 97.87 km², had 2,305 inhabitants, giving a population density of 23.6 inhabitants per km². municipality consist..
Sainte-Ode Wikipedia Page


About Our Data
The data on this page is estimated using a number of publicly available tools and resources. It is provided without warranty, and could contain inaccuracies. Use at your own risk.