Industries
Business Distribution by Industry in Muyinga
| Industry Description | Number of Establishments |
|---|---|
| Hotels and motels | 9 |
Muyinga Facts
| Area | 333.9 km² |
| Population | 226,943 |
| Male Population | 111,899 (49.3%) |
| Female Population | 115,044 (50.7%) |
| Population change (1975 to 2020) | +422.8% |
| Population change (2000 to 2020) | +107.8% |
| Median Age | 16.5 years (Male: 16.9, Female: 16.2) |
| Local Time | |
| Timezone | Central Africa Time |
| Lat & Lng | -2.84510, 30.34140 |
Map of Muyinga
Interactive Map
Muyinga Population
Years 1975 to 2020
| Data | 1975 | 1990 | 2000 | 2015 | 2020 |
|---|---|---|---|---|---|
| Population | 43,412 | 86,894 | 109,223 | 199,606 | 226,943 |
| Population Density | 130 / km² | 260.3 / km² | 327.1 / km² | 597.8 / km² | 679.7 / km² |
Muyinga Population change from 2000 to 2015
Increase of 82.8% from year 2000 to 2015
| Location | Change since 1975 | Change since 1990 | Change since 2000 |
|---|---|---|---|
| Muyinga | +359.8% | +129.7% | +82.8% |
| Muyinga Province | +194.7% | +124.3% | +89% |
| Burundi | +203.5% | +99% | +65.1% |
Muyinga Median Age
Median Age: 16.5 years
| Location | Median Age | Median Age (Female) | Median Age (Male) |
|---|---|---|---|
| Muyinga | 16.5 yrs | 16.2 yrs | 16.9 yrs |
| Muyinga Province | 16.1 yrs | 16.1 yrs | 16.1 yrs |
| Burundi | 17.1 yrs | 16.9 yrs | 17.3 yrs |
Muyinga Population Density
Population Density: 680 / km²
| Location | Population | Area | Density |
|---|---|---|---|
| Muyinga | 226,943 | 333.9 km² | 680 / km² |
| Muyinga Province | 957,406 | 1,691.1 km² | 566 / km² |
| Burundi | 11.2 million | 26,825.9 km² | 416 / km² |
Muyinga Historical and Projected Population
Estimated Population from 1200 to 2100
- JRC (European Commission's Joint Research Centre) work on the GHS built-up grid
- CIESIN (Center for International Earth Science Information Network)
- [Link] Klein Goldewijk, K., Beusen, A., Doelman, J., and Stehfest, E.: Anthropogenic land use estimates for the Holocene – HYDE 3.2, Earth Syst. Sci. Data, 9, 927–953, https://doi.org/10.5194/essd-9-927-2017, 2017.
Human Development Index (HDI)
Statistic composite index of life expectancy, education, and per capita income.
Muyinga CO2 Emissions
Carbon Dioxide (CO2) Emissions Per Capita in Tonnes Per Year
| Location | CO2 Emissions | CO2 Emissions Per Capita | CO2 Emissions Intensity |
|---|---|---|---|
| Muyinga | 20,447 tn | 0.09 tn | 61.2 tons/km² |
| Muyinga Province | 67,517 tn | 0.07 tn | 39.9 tons/km² |
| Burundi | 724,365 tn | 0.06 tn | 27 tons/km² |
| 2013 CO2 emissions (tonnes/year) | 20,447 tn |
| 2013 CO2 emissions (tonnes/year) per capita | 0.09 tn |
| 2013 CO2 emissions intensity (tonnes/km²/year) | 61.2 tons/km² |
Natural Hazards Risk
Relative risk out of 10
| Hazard | Risk Level |
|---|---|
| Drought | Medium (5) |
| Flood | High (8) |
* Risk, particularly concerning flood or landslide, may not be for the entire area.
- Dilley, M., R.S. Chen, U. Deichmann, A.L. Lerner-Lam, M. Arnold, J. Agwe, P. Buys, O. Kjekstad, B. Lyon, and G. Yetman. 2005. Natural Disaster Hotspots: A Global Risk Analysis. Washington, D.C.: World Bank. https://doi.org/10.1596/0-8213-5930-4.
- Center for Hazards and Risk Research - CHRR - Columbia University, Center for International Earth Science Information Network - CIESIN - Columbia University, and International Research Institute for Climate and Society - IRI - Columbia University. 2005. Global Drought Hazard Frequency and Distribution. Palisades, NY: NASA Socioeconomic Data and Applications Center (SEDAC). https://doi.org/10.7927/H4VX0DFT.
- Center for Hazards and Risk Research - CHRR - Columbia University, Center for International Earth Science Information Network - CIESIN - Columbia University. 2005. Global Flood Hazard Frequency and Distribution. Palisades, NY: NASA Socioeconomic Data and Applications Center (SEDAC). https://doi.org/10.7927/H4668B3D.
Recent Nearby Earthquakes
Magnitude 3.0 and greater
| Date▼ | Time↕ | Magnitude↕ | Distance↕ | Depth↕ | Location↕ | Link |
|---|---|---|---|---|---|---|
| 9/2/18 | 11:55 PM | 4.3 | 99.7 km | 10,000 m | 11km NE of Bubanza, Burundi | usgs.gov |
| 5/21/15 | 1:19 PM | 4.4 | 89.6 km | 10,000 m | 12km S of Gitega, Burundi | usgs.gov |
| 9/25/10 | 6:15 AM | 3.8 | 90.6 km | 10,000 m | Burundi | usgs.gov |
| 4/8/06 | 2:22 AM | 4.2 | 93 km | 3,400 m | Rwanda | usgs.gov |
| 5/16/04 | 11:21 AM | 4.7 | 94.7 km | 10,000 m | Burundi | usgs.gov |
| 3/20/03 | 6:15 AM | 5.2 | 98.9 km | 10,000 m | Rwanda | usgs.gov |
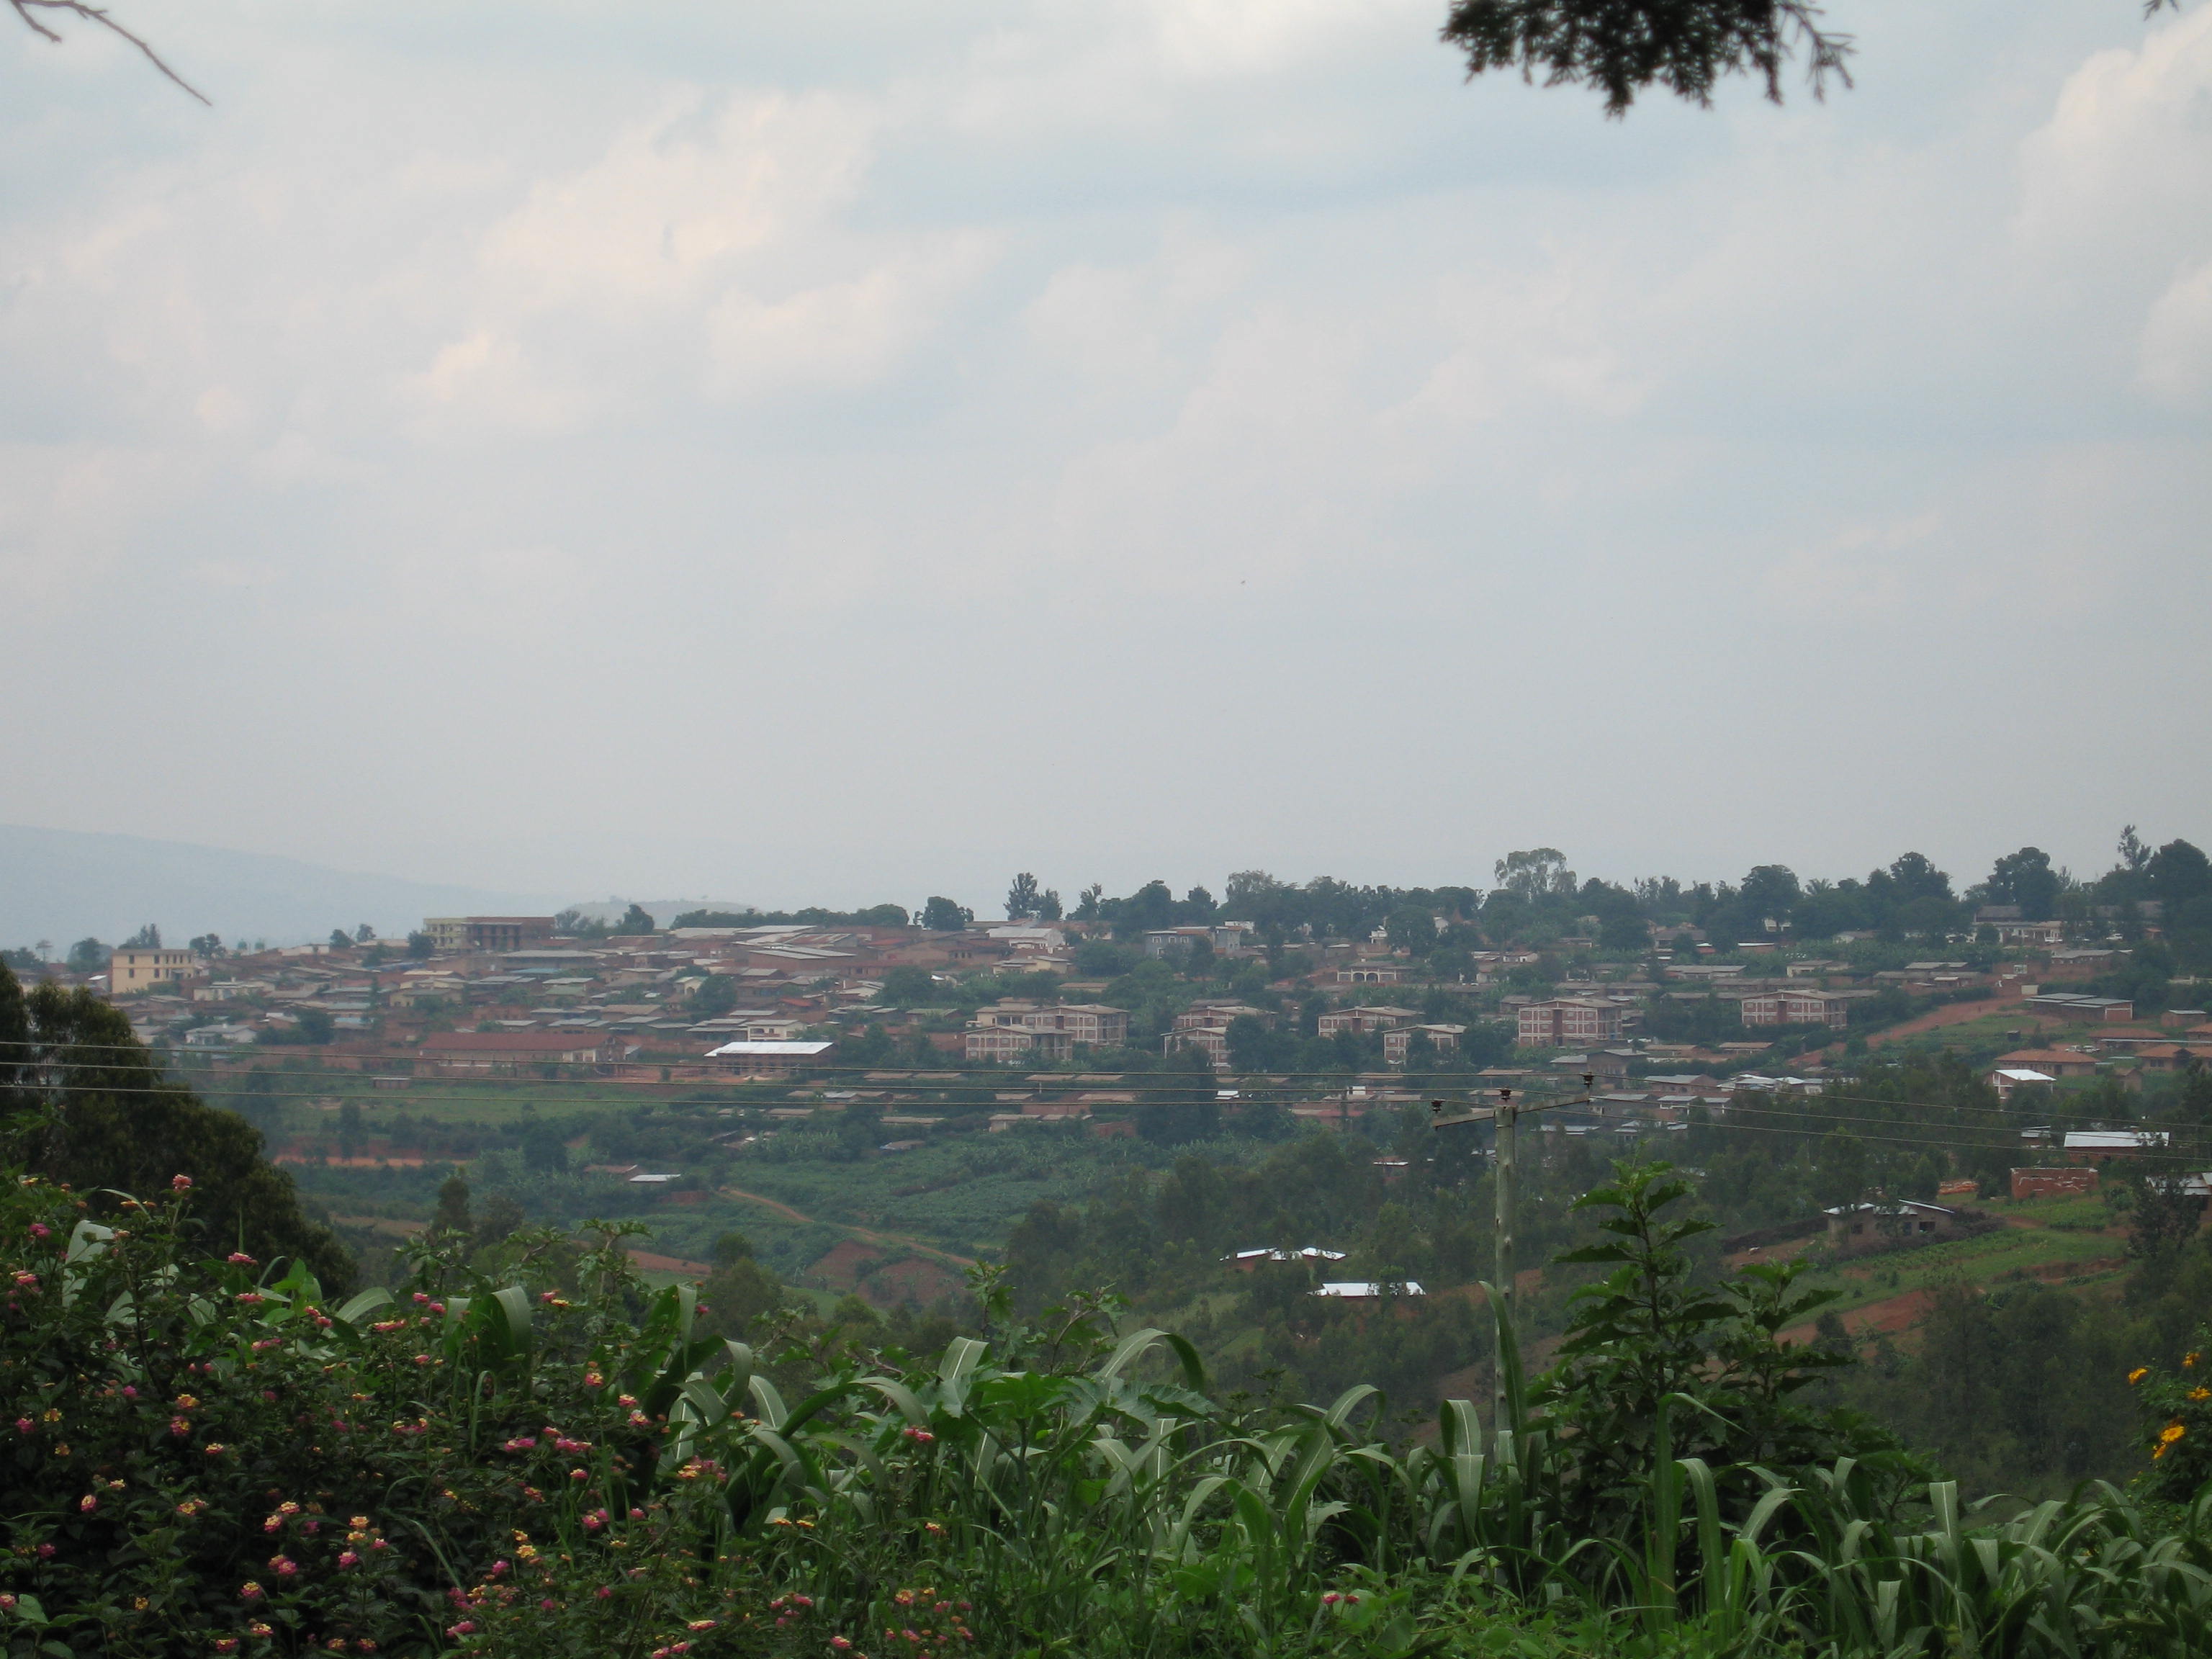
Muyinga
Muyinga is a city located in northern Burundi. It is the capital city of Muyinga Province. It lies at an altitude of 1731 m and has a population of 100,715.
Muyinga Wikipedia Page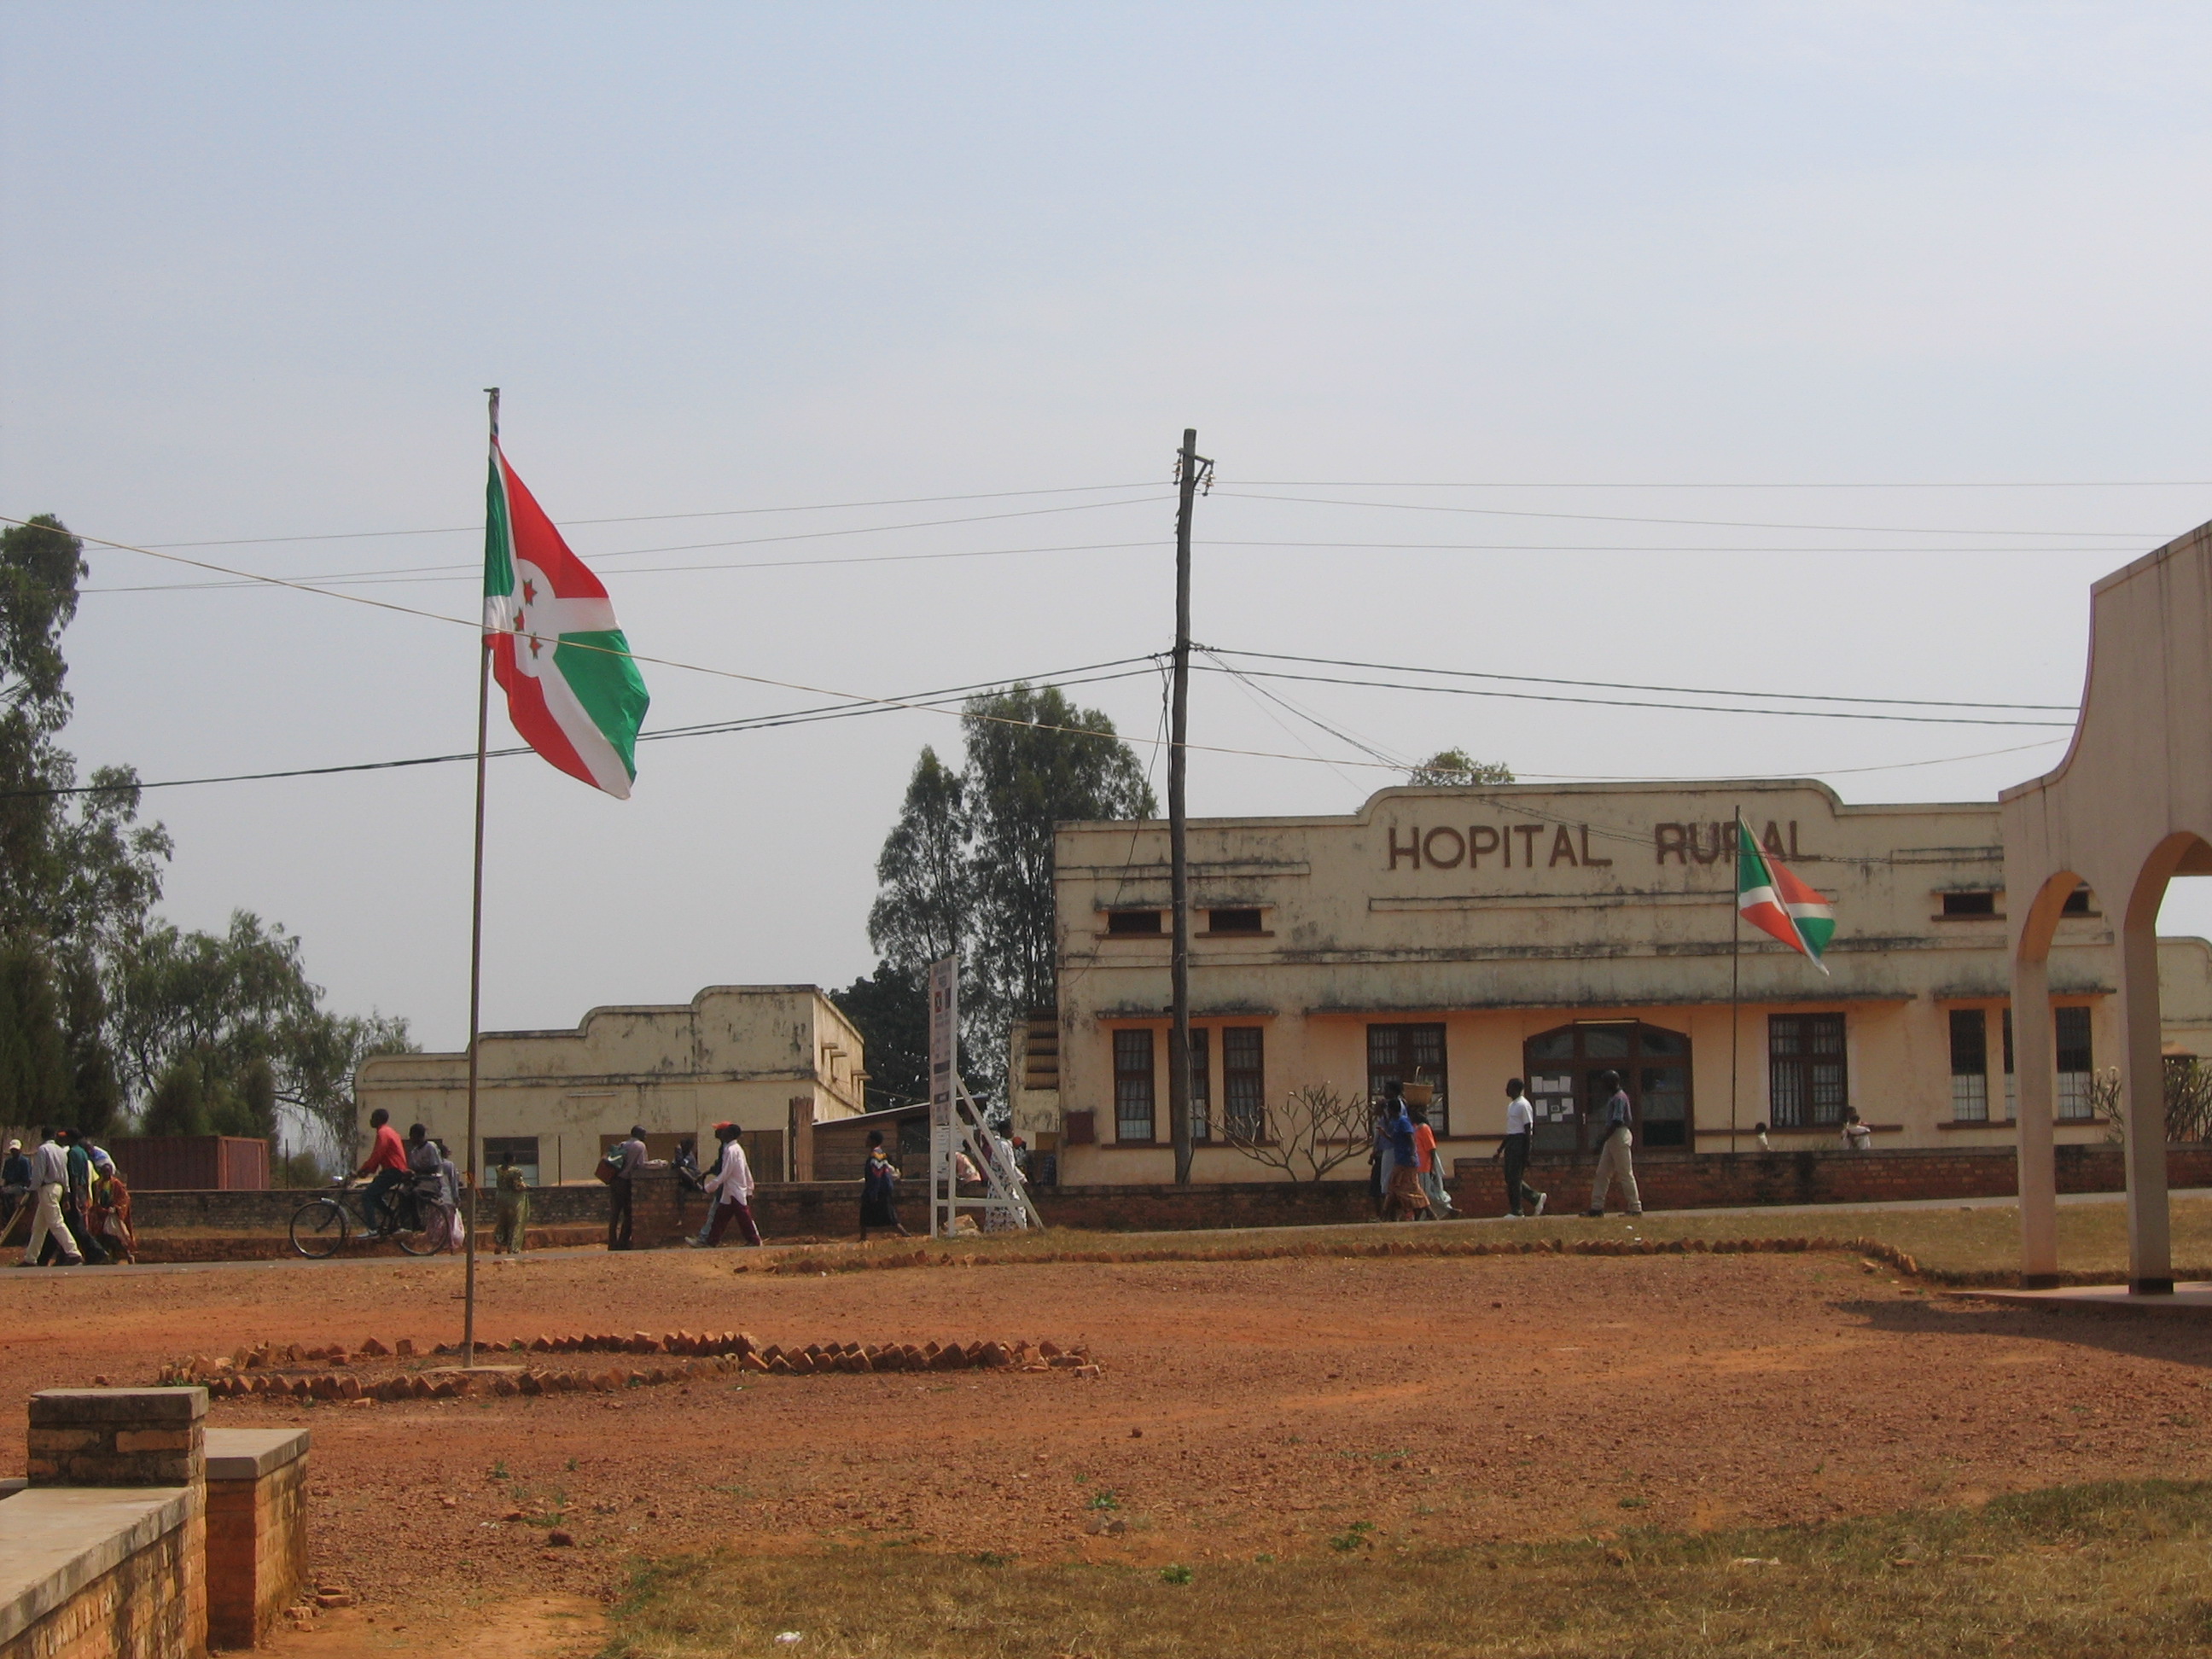
About Our Data
The data on this page is estimated using a number of publicly available tools and resources. It is provided without warranty, and could contain inaccuracies. Use at your own risk.