Categories in Sucre
Industries
Business Distribution by Industry in Sucre
| Industry Description | Number of Establishments | Average Age of Business |
|---|---|---|
| Restaurants | 888 | — |
| Shopping | 490 | — |
| Education | 274 | 34 years |
| Corporate management | 252 | 41 years |
| Grocery stores and supermarkets | 224 | — |
| Clothing stores | 222 | — |
| Car repair | 167 | — |
| Pharmacies and drug stores | 156 | — |
| Bars, pubs and taverns | 138 | — |
Sucre Facts
| Area | 40.7 km² |
| Population | 282,314 |
| Male Population | 134,744 (47.7%) |
| Female Population | 147,570 (52.3%) |
| Population change (1975 to 2020) | +189.8% |
| Population change (2000 to 2020) | +36.8% |
| Median Age | 23.3 years (Male: 22.5, Female: 24) |
| Area Codes | 4 |
| Neighborhoods | Casco Viejo, Surapata, Zona Patacón |
| Local Time | |
| Timezone | Bolivia Time |
| Lat & Lng | -19.03332, -65.26274 |
Map of Sucre
Interactive Map
Sucre Population
Years 1975 to 2020
| Data | 1975 | 1990 | 2000 | 2015 | 2020 |
|---|---|---|---|---|---|
| Population | 97,406 | 156,966 | 206,387 | 263,329 | 282,314 |
| Population Density | 2,394 / km² | 3,857.8 / km² | 5,072.5 / km² | 6,472 / km² | 6,938.6 / km² |
Sucre Population change from 2000 to 2015
Increase of 27.6% from year 2000 to 2015
| Location | Change since 1975 | Change since 1990 | Change since 2000 |
|---|---|---|---|
| Sucre | +170.3% | +67.8% | +27.6% |
| Chuquisaca Department | +50.1% | +24.8% | +11.2% |
| Bolivia | +113.9% | +56.1% | +28.5% |
Sucre Median Age
Median Age: 23.3 years
| Location | Median Age | Median Age (Female) | Median Age (Male) |
|---|---|---|---|
| Sucre | 23.3 yrs | 24 yrs | 22.5 yrs |
| Chuquisaca Department | 23 yrs | 23.8 yrs | 22.3 yrs |
| Bolivia | 23.9 yrs | 24.4 yrs | 23.5 yrs |
Sucre Population Density
Population Density: 6,939 / km²
| Location | Population | Area | Density |
|---|---|---|---|
| Sucre | 282,314 | 40.7 km² | 6,939 / km² |
| Chuquisaca Department | 603,672 | 50,962.4 km² | 11.8 / km² |
| Bolivia | 10.8 million | 1,083,759.7 km² | 9.9 / km² |
Sucre Historical and Projected Population
Estimated Population from 1830 to 2100
- JRC (European Commission's Joint Research Centre) work on the GHS built-up grid
- CIESIN (Center for International Earth Science Information Network)
- [Link] Klein Goldewijk, K., Beusen, A., Doelman, J., and Stehfest, E.: Anthropogenic land use estimates for the Holocene – HYDE 3.2, Earth Syst. Sci. Data, 9, 927–953, https://doi.org/10.5194/essd-9-927-2017, 2017.
Neighborhoods in Sucre
Percentage of businesses by neighborhood in Sucre
Area Codes
Percentage Area Codes used by businesses in Sucre
Price Distribution
Business distribution by price for Sucre
Human Development Index (HDI)
Statistic composite index of life expectancy, education, and per capita income.
Sucre CO2 Emissions
Carbon Dioxide (CO2) Emissions Per Capita in Tonnes Per Year
| Location | CO2 Emissions | CO2 Emissions Per Capita | CO2 Emissions Intensity |
|---|---|---|---|
| Sucre | 424,236 tn | 1.5 tn | 10,426.7 tons/km² |
| Chuquisaca Department | 858,041 tn | 1.42 tn | 16.8 tons/km² |
| Bolivia | 16,583,283 tn | 1.54 tn | 15.3 tons/km² |
| 2013 CO2 emissions (tonnes/year) | 424,236 tn |
| 2013 CO2 emissions (tonnes/year) per capita | 1.5 tn |
| 2013 CO2 emissions intensity (tonnes/km²/year) | 10,426.7 tons/km² |
Natural Hazards Risk
Relative risk out of 10
| Hazard | Risk Level |
|---|---|
| Drought | Medium (5) |
| Flood | Medium (7) |
| Earthquake | Medium (6) |
* Risk, particularly concerning flood or landslide, may not be for the entire area.
- Dilley, M., R.S. Chen, U. Deichmann, A.L. Lerner-Lam, M. Arnold, J. Agwe, P. Buys, O. Kjekstad, B. Lyon, and G. Yetman. 2005. Natural Disaster Hotspots: A Global Risk Analysis. Washington, D.C.: World Bank. https://doi.org/10.1596/0-8213-5930-4.
- Center for Hazards and Risk Research - CHRR - Columbia University, Center for International Earth Science Information Network - CIESIN - Columbia University, and International Research Institute for Climate and Society - IRI - Columbia University. 2005. Global Drought Hazard Frequency and Distribution. Palisades, NY: NASA Socioeconomic Data and Applications Center (SEDAC). https://doi.org/10.7927/H4VX0DFT.
- Center for Hazards and Risk Research - CHRR - Columbia University, Center for International Earth Science Information Network - CIESIN - Columbia University. 2005. Global Flood Hazard Frequency and Distribution. Palisades, NY: NASA Socioeconomic Data and Applications Center (SEDAC). https://doi.org/10.7927/H4668B3D.
- Center for Hazards and Risk Research - CHRR - Columbia University, Center for International Earth Science Information Network - CIESIN - Columbia University. 2005. Global Earthquake Hazard Distribution - Peak Ground Acceleration. Palisades, NY: NASA Socioeconomic Data and Applications Center (SEDAC). https://doi.org/10.7927/H4BZ63ZS.
Recent Nearby Earthquakes
Magnitude 3.0 and greater
| Date▼ | Time↕ | Magnitude↕ | Distance↕ | Depth↕ | Location↕ | Link |
|---|---|---|---|---|---|---|
| 9/28/18 | 10:54 AM | 4.3 | 92.2 km | 10,000 m | 10km WNW of San Pedro, Bolivia | usgs.gov |
| 9/4/15 | 9:30 PM | 4.4 | 70.4 km | 289,690 m | 43km WSW of Potolo, Bolivia | usgs.gov |
| 8/5/13 | 4:47 PM | 4.3 | 88.2 km | 24,310 m | 22km S of Tomina, Bolivia | usgs.gov |
| 6/27/13 | 7:29 PM | 4.5 | 71.5 km | 282,700 m | Potosi, Bolivia | usgs.gov |
| 4/23/08 | 10:55 PM | 4 | 54.3 km | 36,800 m | Cochabamba, Bolivia | usgs.gov |
| 2/22/76 | 8:09 AM | 5.3 | 75.5 km | 41,000 m | Cochabamba, Bolivia | usgs.gov |
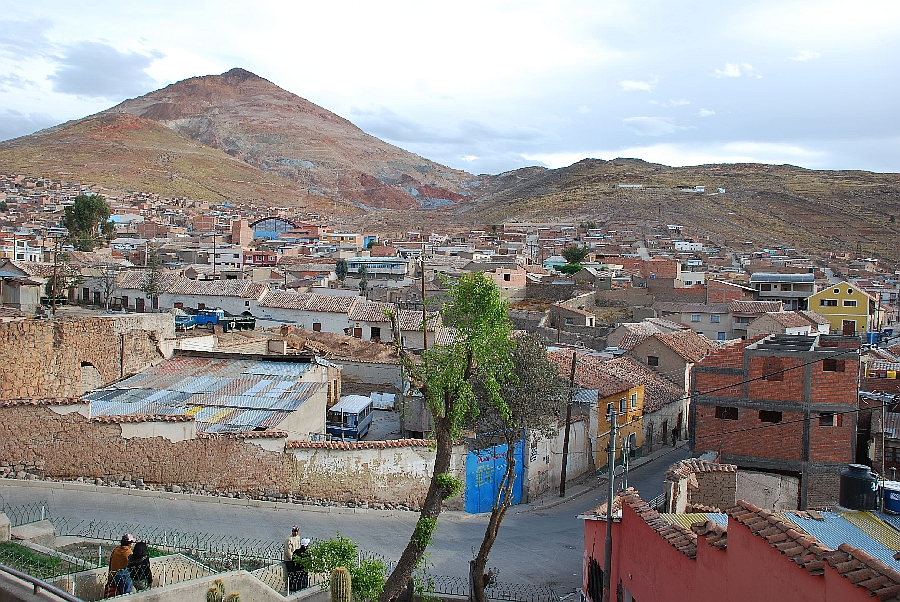
Sucre
Sucre (Spanish pronunciation: [ˈsukɾe]), also known historically as Charcas [ˈtʃarkas], La Plata [la ˈplata] and Chuquisaca [tʃikiˈsaka] (population 247,300 in 2006), is the constitutional capital of Bolivia, the capital of the Chuquisaca Department,..
Sucre Wikipedia Page


About Our Data
The data on this page is estimated using a number of publicly available tools and resources. It is provided without warranty, and could contain inaccuracies. Use at your own risk.