Categories in Belmopan
Industries
Business Distribution by Industry in Belmopan
| Industry Description | Number of Establishments |
|---|---|
| Restaurants | 139 |
| Public administration | 59 |
| Churches | 47 |
| Shopping | 46 |
| Other accommodation | 46 |
| Corporate management | 42 |
| Grocery stores and supermarkets | 32 |
| Car repair | 29 |
| Clothing stores | 29 |
| Education | 26 |
| Hotels and motels | 23 |
| Real estate | 21 |
| Electronics stores | 20 |
| Beauty salons | 20 |
| Fast food restaurants | 19 |
Belmopan Facts
| Area | 24.3 km² |
| Population | 30,479 |
| Male Population | 15,208 (49.9%) |
| Female Population | 15,271 (50.1%) |
| Population change (1975 to 2020) | +269.6% |
| Population change (2000 to 2020) | +75.4% |
| Median Age | 20.2 years (Male: 19.9, Female: 20.5) |
| Local Time | |
| Timezone | Central Standard Time |
| Lat & Lng | 17.25000, -88.76667 |
Map of Belmopan
Interactive Map
Belmopan Population
Years 1975 to 2020
| Data | 1975 | 1990 | 2000 | 2015 | 2020 |
|---|---|---|---|---|---|
| Population | 8,246 | 10,510 | 17,374 | 28,075 | 30,479 |
| Population Density | 339.2 / km² | 432.3 / km² | 714.6 / km² | 1,154.8 / km² | 1,253.6 / km² |
Belmopan Population change from 2000 to 2015
Increase of 61.6% from year 2000 to 2015
| Location | Change since 1975 | Change since 1990 | Change since 2000 |
|---|---|---|---|
| Belmopan | +240.5% | +167.1% | +61.6% |
| Cayo District | +251.9% | +124.3% | +59.2% |
| Belize | +172.3% | +92.8% | +45.3% |
Belmopan Median Age
Median Age: 20.2 years
| Location | Median Age | Median Age (Female) | Median Age (Male) |
|---|---|---|---|
| Belmopan | 20.2 yrs | 20.5 yrs | 19.9 yrs |
| Cayo District | 20.1 yrs | 20.4 yrs | 19.8 yrs |
| Belize | 22 yrs | 22.1 yrs | 21.8 yrs |
Belmopan Population Density
Population Density: 1,254 / km²
| Location | Population | Area | Density |
|---|---|---|---|
| Belmopan | 30,479 | 24.3 km² | 1,254 / km² |
| Cayo District | 86,135 | 5,249.7 km² | 16.4 / km² |
| Belize | 349,968 | 22,282.9 km² | 15.7 / km² |
Belmopan Historical and Projected Population
Estimated Population from 1850 to 2100
- JRC (European Commission's Joint Research Centre) work on the GHS built-up grid
- CIESIN (Center for International Earth Science Information Network)
- [Link] Klein Goldewijk, K., Beusen, A., Doelman, J., and Stehfest, E.: Anthropogenic land use estimates for the Holocene – HYDE 3.2, Earth Syst. Sci. Data, 9, 927–953, https://doi.org/10.5194/essd-9-927-2017, 2017.
Area Codes
Percentage Area Codes used by businesses in Belmopan
Price Distribution
Business distribution by price for Belmopan
Human Development Index (HDI)
Statistic composite index of life expectancy, education, and per capita income.
Belmopan CO2 Emissions
Carbon Dioxide (CO2) Emissions Per Capita in Tonnes Per Year
| Location | CO2 Emissions | CO2 Emissions Per Capita | CO2 Emissions Intensity |
|---|---|---|---|
| Belmopan | 82,028 tn | 2.69 tn | 3,373.9 tons/km² |
| Cayo District | 229,849 tn | 2.67 tn | 43.8 tons/km² |
| Belize | 920,961 tn | 2.63 tn | 41.3 tons/km² |
| 2013 CO2 emissions (tonnes/year) | 82,028 tn |
| 2013 CO2 emissions (tonnes/year) per capita | 2.69 tn |
| 2013 CO2 emissions intensity (tonnes/km²/year) | 3,373.9 tons/km² |
Natural Hazards Risk
Relative risk out of 10
| Hazard | Risk Level |
|---|---|
| Flood | Medium (4) |
| Earthquake | Medium (4) |
| Cyclone | High (8) |
* Risk, particularly concerning flood or landslide, may not be for the entire area.
- Dilley, M., R.S. Chen, U. Deichmann, A.L. Lerner-Lam, M. Arnold, J. Agwe, P. Buys, O. Kjekstad, B. Lyon, and G. Yetman. 2005. Natural Disaster Hotspots: A Global Risk Analysis. Washington, D.C.: World Bank. https://doi.org/10.1596/0-8213-5930-4.
- Center for Hazards and Risk Research - CHRR - Columbia University, Center for International Earth Science Information Network - CIESIN - Columbia University, International Bank for Reconstruction and Development - The World Bank, and United Nations Environment Programme Global Resource Information Database Geneva - UNEP/GRID-Geneva. 2005. Global Cyclone Hazard Frequency and Distribution. Palisades, NY: NASA Socioeconomic Data and Applications Center (SEDAC). https://doi.org/10.7927/H4CZ353K.
- Center for Hazards and Risk Research - CHRR - Columbia University, Center for International Earth Science Information Network - CIESIN - Columbia University. 2005. Global Flood Hazard Frequency and Distribution. Palisades, NY: NASA Socioeconomic Data and Applications Center (SEDAC). https://doi.org/10.7927/H4668B3D.
- Center for Hazards and Risk Research - CHRR - Columbia University, Center for International Earth Science Information Network - CIESIN - Columbia University. 2005. Global Earthquake Hazard Distribution - Peak Ground Acceleration. Palisades, NY: NASA Socioeconomic Data and Applications Center (SEDAC). https://doi.org/10.7927/H4BZ63ZS.
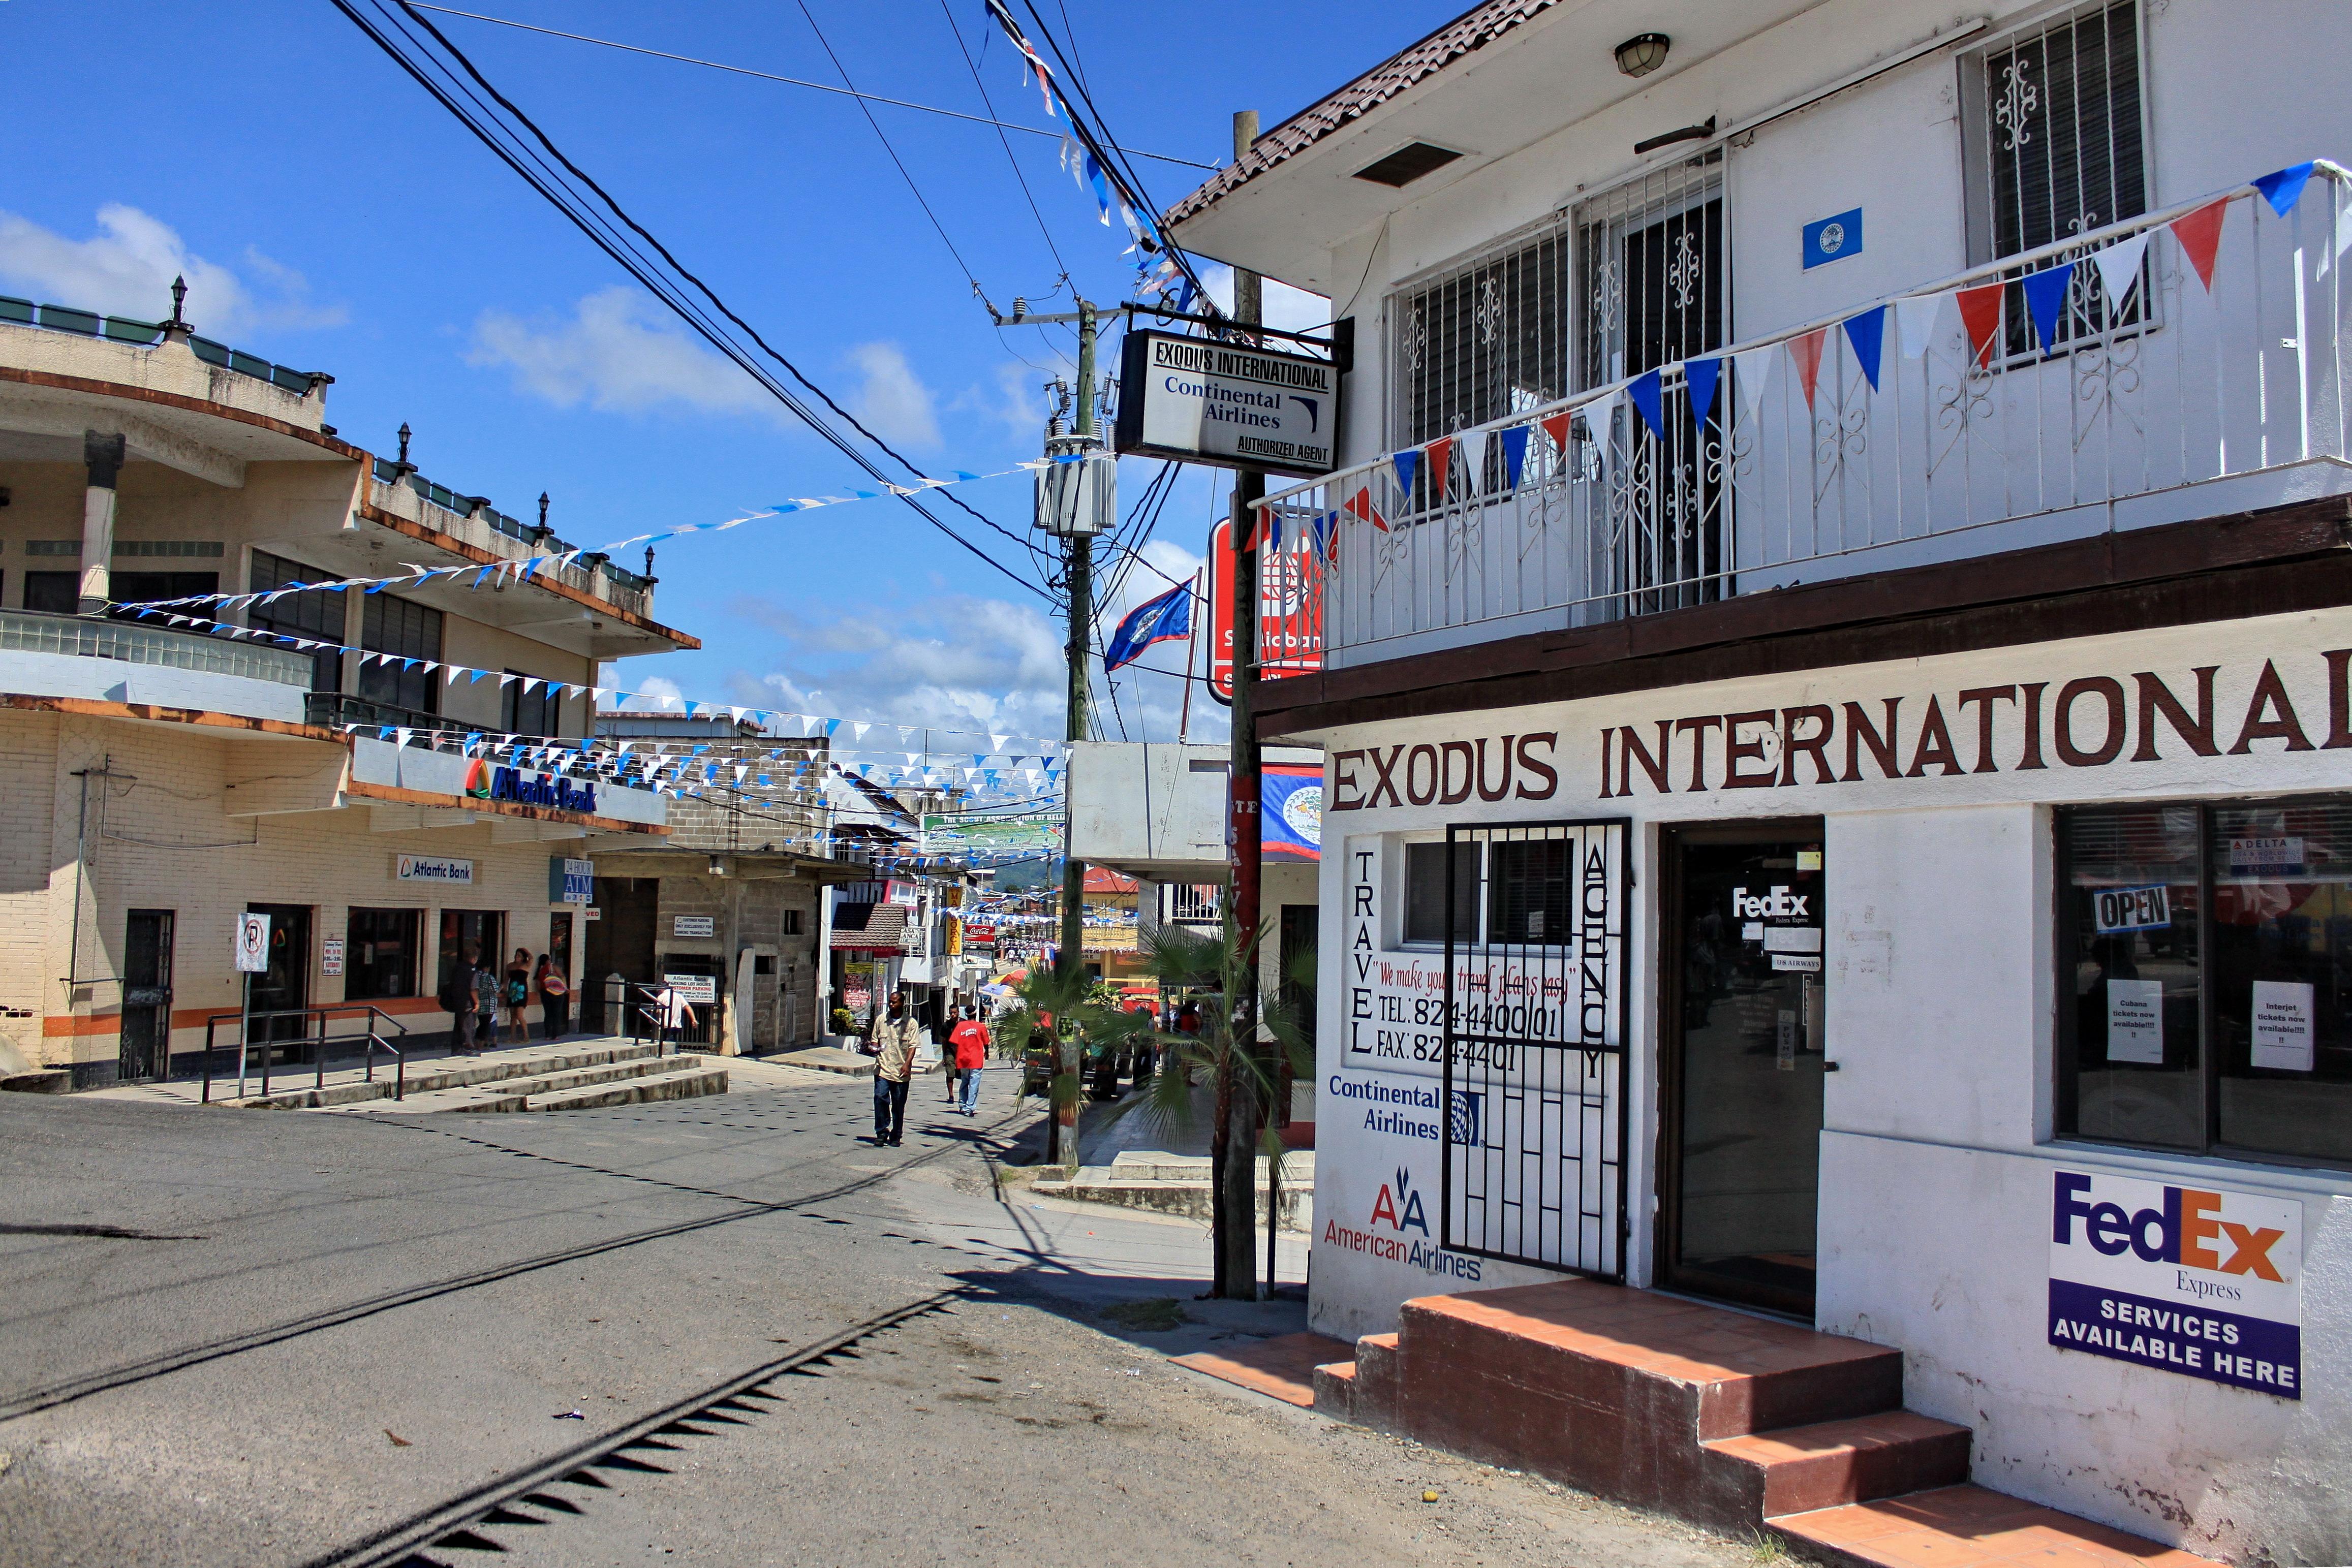
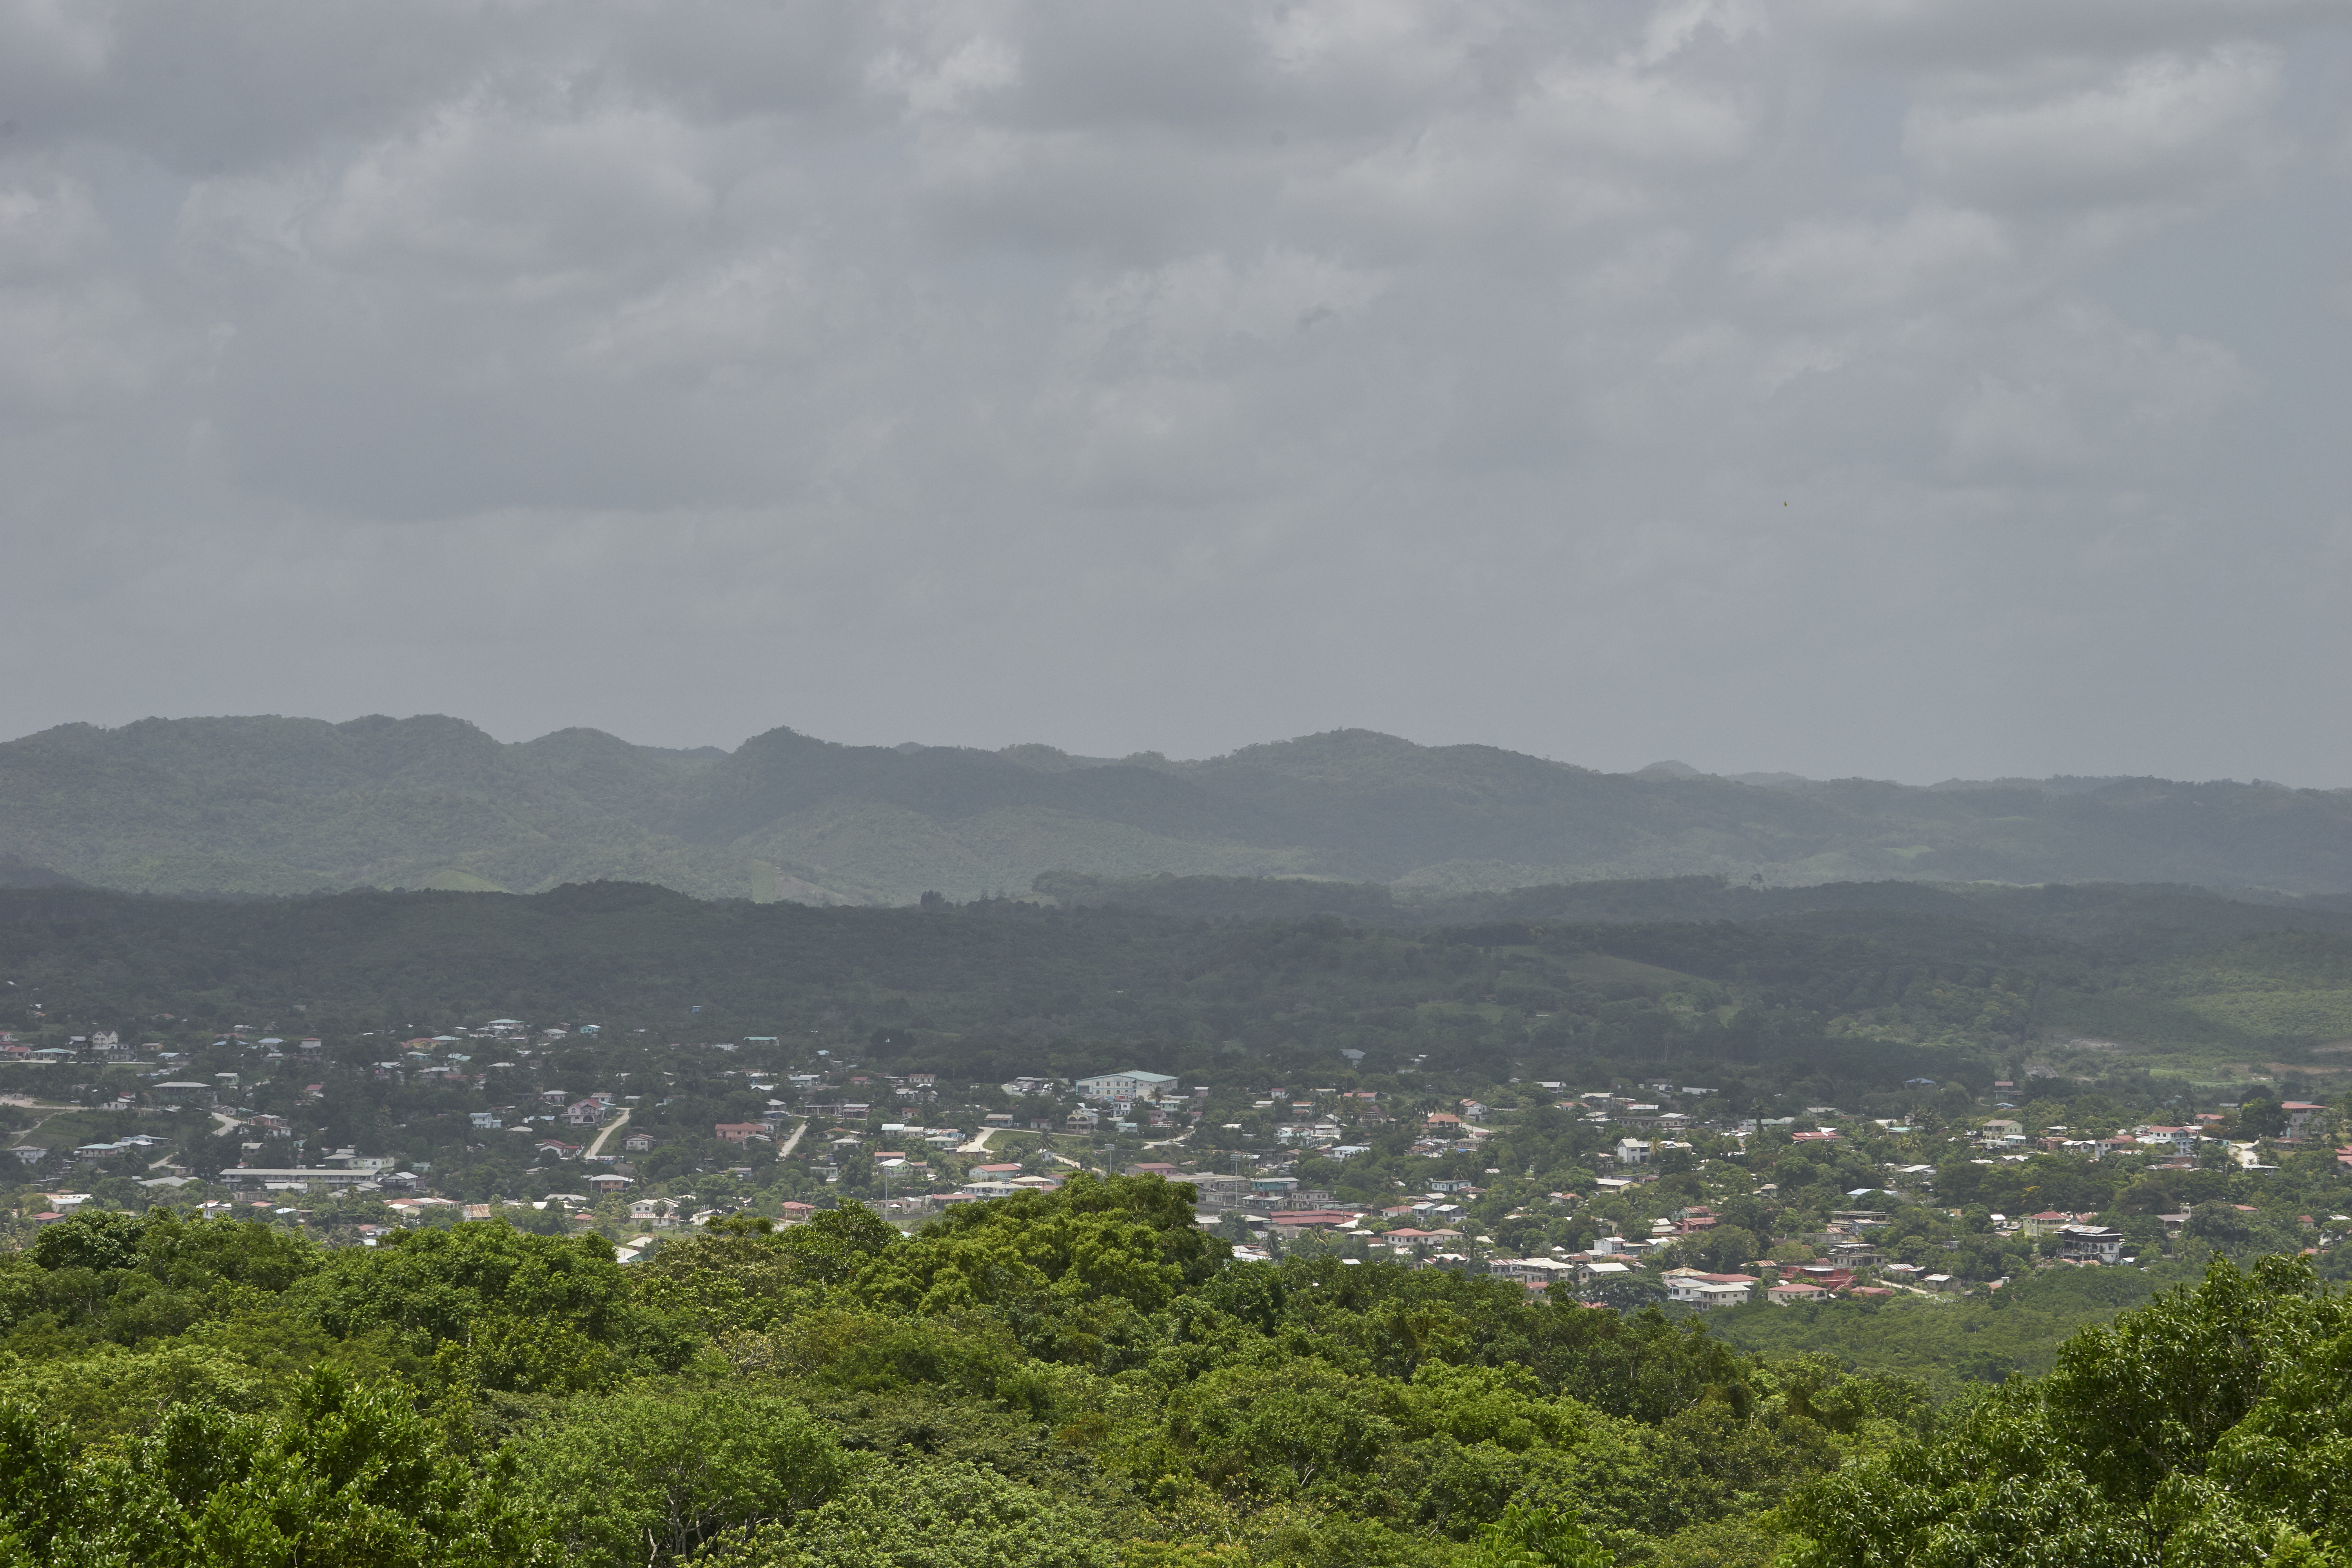
Belmopan
Belmopan (/ˌbɛlmoʊˈpæn/) is the capital city of Belize. Its population in 2010 was 16,451. Although the smallest capital city in the continental Americas by population, Belmopan is the third-largest settlement in Belize, behind Belize City and San Ig..
Belmopan Wikipedia Page

About Our Data
The data on this page is estimated using a number of publicly available tools and resources. It is provided without warranty, and could contain inaccuracies. Use at your own risk.