Categories in Causapscal
Industries
Business Distribution by Industry in Causapscal
| Industry Description | Number of Establishments | Average Age of Business |
|---|---|---|
| Public administration | 6 | 27 years |
Causapscal Facts
| Area | 162.1 km² |
| Population | 2,592 |
| Male Population | 1,290 (49.8%) |
| Female Population | 1,302 (50.2%) |
| Population change (1975 to 2020) | -16.5% |
| Population change (2000 to 2020) | -5.5% |
| Median Age | 49.5 years (Male: 49.1, Female: 49.9) |
| Local Time | |
| Timezone | Eastern Daylight Time |
| Lat & Lng | 48.36401, -67.23255 |
| Postal Codes | G0J |
Map of Causapscal
Interactive Map
Causapscal Population
Years 1975 to 2020
| Data | 1975 | 1990 | 2000 | 2015 | 2020 |
|---|---|---|---|---|---|
| Population | 3,105 | 2,927 | 2,743 | 2,451 | 2,592 |
| Population Density | 19.2 / km² | 18.1 / km² | 16.9 / km² | 15.1 / km² | 16 / km² |
Causapscal Population change from 2000 to 2015
Decrease of 10.6% from year 2000 to 2015
| Location | Change since 1975 | Change since 1990 | Change since 2000 |
|---|---|---|---|
| Causapscal | -21.1% | -16.3% | -10.6% |
| Quebec | +42.5% | +22.6% | +12.9% |
| Canada | +55.8% | +30.2% | +17.2% |
Causapscal Median Age
Median Age: 49.5 years
| Location | Median Age | Median Age (Female) | Median Age (Male) |
|---|---|---|---|
| Causapscal | 49.5 yrs | 49.9 yrs | 49.1 yrs |
| Quebec | 42.2 yrs | 43.2 yrs | 41.1 yrs |
| Canada | 40.6 yrs | 41.5 yrs | 39.6 yrs |
Causapscal Population Density
Population Density: 16 / km²
| Location | Population | Area | Density |
|---|---|---|---|
| Causapscal | 2,592 | 162.1 km² | 16 / km² |
| Quebec | 7 million | 1,519,626.9 km² | 4.6 / km² |
| Canada | 35.5 million | 9,875,295.4 km² | 3.6 / km² |
Causapscal Historical and Projected Population
Estimated Population from 1710 to 2100
- JRC (European Commission's Joint Research Centre) work on the GHS built-up grid
- CIESIN (Center for International Earth Science Information Network)
- [Link] Klein Goldewijk, K., Beusen, A., Doelman, J., and Stehfest, E.: Anthropogenic land use estimates for the Holocene – HYDE 3.2, Earth Syst. Sci. Data, 9, 927–953, https://doi.org/10.5194/essd-9-927-2017, 2017.
Human Development Index (HDI)
Statistic composite index of life expectancy, education, and per capita income.
Causapscal CO2 Emissions
Carbon Dioxide (CO2) Emissions Per Capita in Tonnes Per Year
| Location | CO2 Emissions | CO2 Emissions Per Capita | CO2 Emissions Intensity |
|---|---|---|---|
| Causapscal | 33,706 tn | 13 tn | 207.9 tons/km² |
| Quebec | 96,902,370 tn | 13.87 tn | 63.8 tons/km² |
| Canada | 521,999,336 tn | 14.7 tn | 52.9 tons/km² |
| 2013 CO2 emissions (tonnes/year) | 33,706 tn |
| 2013 CO2 emissions (tonnes/year) per capita | 13 tn |
| 2013 CO2 emissions intensity (tonnes/km²/year) | 207.9 tons/km² |
Natural Hazards Risk
Relative risk out of 10
| Hazard | Risk Level |
|---|---|
| Earthquake | Medium (4) |
| Cyclone | Medium (5) |
* Risk, particularly concerning flood or landslide, may not be for the entire area.
- Dilley, M., R.S. Chen, U. Deichmann, A.L. Lerner-Lam, M. Arnold, J. Agwe, P. Buys, O. Kjekstad, B. Lyon, and G. Yetman. 2005. Natural Disaster Hotspots: A Global Risk Analysis. Washington, D.C.: World Bank. https://doi.org/10.1596/0-8213-5930-4.
- Center for Hazards and Risk Research - CHRR - Columbia University, Center for International Earth Science Information Network - CIESIN - Columbia University, International Bank for Reconstruction and Development - The World Bank, and United Nations Environment Programme Global Resource Information Database Geneva - UNEP/GRID-Geneva. 2005. Global Cyclone Hazard Frequency and Distribution. Palisades, NY: NASA Socioeconomic Data and Applications Center (SEDAC). https://doi.org/10.7927/H4CZ353K.
- Center for Hazards and Risk Research - CHRR - Columbia University, Center for International Earth Science Information Network - CIESIN - Columbia University. 2005. Global Earthquake Hazard Distribution - Peak Ground Acceleration. Palisades, NY: NASA Socioeconomic Data and Applications Center (SEDAC). https://doi.org/10.7927/H4BZ63ZS.
Recent Nearby Earthquakes
Magnitude 3.0 and greater
| Date▼ | Time↕ | Magnitude↕ | Distance↕ | Depth↕ | Location↕ | Link |
|---|---|---|---|---|---|---|
| 10/6/17 | 6:16 AM | 3.3 | 92.5 km | 22,000 m | 24km SE of Baie-Comeau, Canada | usgs.gov |
| 5/26/14 | 9:33 PM | 3.7 | 88.1 km | 21,000 m | 29km SSE of Baie-Comeau, Canada | usgs.gov |
| 11/27/12 | 7:55 AM | 4.2 | 50.9 km | 17,000 m | Gaspe Peninsula, Quebec, Canada | usgs.gov |
| 4/20/95 | 4:37 AM | 3.3 | 94.7 km | 15,000 m | St. Lawrence Valley region, Quebec, Canada | usgs.gov |
| 1/17/83 | 7:35 PM | 4.5 | 85 km | 18,000 m | Gaspe Peninsula, Quebec, Canada | usgs.gov |
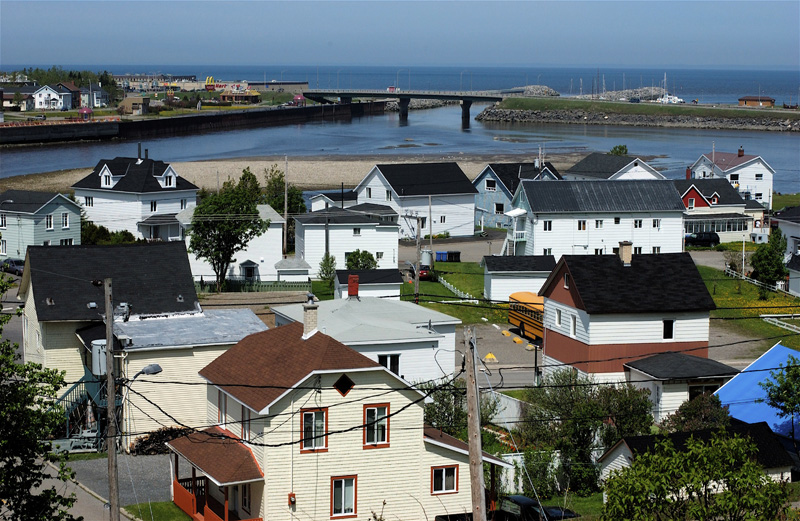
Causapscal
Causapscal (/koʊˈzɑːpskæl/) is a city in the Canadian province of Quebec, located in La Matapédia Regional County Municipality. It is located at the confluence of the Matapédia and Causapscal Rivers, along Quebec Route 132, approximately halfway betw..
Causapscal Wikipedia Page

About Our Data
The data on this page is estimated using a number of publicly available tools and resources. It is provided without warranty, and could contain inaccuracies. Use at your own risk.