Categories in Howick, Quebec
Howick, Quebec Facts
| Area | 0.9 km² |
| Population | 602 |
| Male Population | 303 (50.3%) |
| Female Population | 299 (49.7%) |
| Population change (1975 to 2020) | -17.9% |
| Population change (2000 to 2020) | -6.2% |
| Median Age | 39.3 years (Male: 38.6, Female: 40.4) |
| Area Codes | 450 |
| Local Time | |
| Timezone | Eastern Daylight Time |
| Lat & Lng | 45.18338, -73.84920 |
| Postal Codes | J0S |
Map of Howick, Quebec
Interactive Map
Howick, Quebec Population
Years 1975 to 2020
| Data | 1975 | 1990 | 2000 | 2015 | 2020 |
|---|---|---|---|---|---|
| Population | 733 | 687 | 642 | 570 | 602 |
| Population Density | 837.7 / km² | 785.1 / km² | 733.7 / km² | 651.4 / km² | 688 / km² |
Howick, Quebec Population change from 2000 to 2015
Decrease of 11.2% from year 2000 to 2015
| Location | Change since 1975 | Change since 1990 | Change since 2000 |
|---|---|---|---|
| Howick, Quebec | -22.2% | -17% | -11.2% |
| Quebec | +42.5% | +22.6% | +12.9% |
| Canada | +55.8% | +30.2% | +17.2% |
Howick, Quebec Median Age
Median Age: 39.3 years
| Location | Median Age | Median Age (Female) | Median Age (Male) |
|---|---|---|---|
| Howick, Quebec | 39.3 yrs | 40.4 yrs | 38.6 yrs |
| Quebec | 42.2 yrs | 43.2 yrs | 41.1 yrs |
| Canada | 40.6 yrs | 41.5 yrs | 39.6 yrs |
Howick, Quebec Population Density
Population Density: 688 / km²
| Location | Population | Area | Density |
|---|---|---|---|
| Howick, Quebec | 602 | 0.875 km² | 688 / km² |
| Quebec | 7 million | 1,519,626.9 km² | 4.6 / km² |
| Canada | 35.5 million | 9,875,295.4 km² | 3.6 / km² |
Howick, Quebec Historical and Projected Population
Estimated Population from 1710 to 2100
- JRC (European Commission's Joint Research Centre) work on the GHS built-up grid
- CIESIN (Center for International Earth Science Information Network)
- [Link] Klein Goldewijk, K., Beusen, A., Doelman, J., and Stehfest, E.: Anthropogenic land use estimates for the Holocene – HYDE 3.2, Earth Syst. Sci. Data, 9, 927–953, https://doi.org/10.5194/essd-9-927-2017, 2017.
Area Codes
Percentage Area Codes used by businesses in Howick, Quebec
Price Distribution
Business distribution by price for Howick, Quebec
Human Development Index (HDI)
Statistic composite index of life expectancy, education, and per capita income.
Howick, Quebec CO2 Emissions
Carbon Dioxide (CO2) Emissions Per Capita in Tonnes Per Year
| Location | CO2 Emissions | CO2 Emissions Per Capita | CO2 Emissions Intensity |
|---|---|---|---|
| Howick, Quebec | 8,027 tn | 13.33 tn | 9,174 tons/km² |
| Quebec | 96,902,370 tn | 13.87 tn | 63.8 tons/km² |
| Canada | 521,999,336 tn | 14.7 tn | 52.9 tons/km² |
| 2013 CO2 emissions (tonnes/year) | 8,027 tn |
| 2013 CO2 emissions (tonnes/year) per capita | 13.33 tn |
| 2013 CO2 emissions intensity (tonnes/km²/year) | 9,174 tons/km² |
Natural Hazards Risk
Relative risk out of 10
| Hazard | Risk Level |
|---|---|
| Earthquake | Medium (6) |
| Cyclone | Medium (5) |
* Risk, particularly concerning flood or landslide, may not be for the entire area.
- Dilley, M., R.S. Chen, U. Deichmann, A.L. Lerner-Lam, M. Arnold, J. Agwe, P. Buys, O. Kjekstad, B. Lyon, and G. Yetman. 2005. Natural Disaster Hotspots: A Global Risk Analysis. Washington, D.C.: World Bank. https://doi.org/10.1596/0-8213-5930-4.
- Center for Hazards and Risk Research - CHRR - Columbia University, Center for International Earth Science Information Network - CIESIN - Columbia University, International Bank for Reconstruction and Development - The World Bank, and United Nations Environment Programme Global Resource Information Database Geneva - UNEP/GRID-Geneva. 2005. Global Cyclone Hazard Frequency and Distribution. Palisades, NY: NASA Socioeconomic Data and Applications Center (SEDAC). https://doi.org/10.7927/H4CZ353K.
- Center for Hazards and Risk Research - CHRR - Columbia University, Center for International Earth Science Information Network - CIESIN - Columbia University. 2005. Global Earthquake Hazard Distribution - Peak Ground Acceleration. Palisades, NY: NASA Socioeconomic Data and Applications Center (SEDAC). https://doi.org/10.7927/H4BZ63ZS.
Recent Nearby Earthquakes
Magnitude 3.0 and greater
| Date▼ | Time↕ | Magnitude↕ | Distance↕ | Depth↕ | Location↕ | Link |
|---|---|---|---|---|---|---|
| 11/28/15 | 5:16 AM | 3.23 | 73 km | 5,000 m | 4km S of Cornwall, Canada | usgs.gov |
| 7/15/15 | 10:00 PM | 3.27 | 63.3 km | 10,230 m | 13km SSE of Hawkesbury, Canada | usgs.gov |
| 11/6/12 | 9:05 AM | 3.74 | 76.2 km | 11,070 m | Ontario-Quebec border region, Canada | usgs.gov |
| 10/10/12 | 4:19 AM | 3.93 | 78.1 km | 8,550 m | southern Quebec, Canada | usgs.gov |
| 8/24/11 | 5:14 PM | 3.19 | 68 km | 5,000 m | New York | usgs.gov |
| 3/16/11 | 5:36 PM | 3.87 | 72.2 km | 10,000 m | Ontario-Quebec border region, Canada | usgs.gov |
| 2/28/10 | 3:51 AM | 3.41 | 76.8 km | 7,370 m | Ontario-Quebec border region, Canada | usgs.gov |
| 2/26/06 | 4:09 AM | 3.19 | 78 km | 13,540 m | Ontario-Quebec border region, Canada | usgs.gov |
| 1/9/06 | 3:35 PM | 3.72 | 17.7 km | 12,690 m | southern Quebec, Canada | usgs.gov |
| 4/8/03 | 3:06 PM | 3.7 | 74.1 km | 10,000 m | New York | usgs.gov |
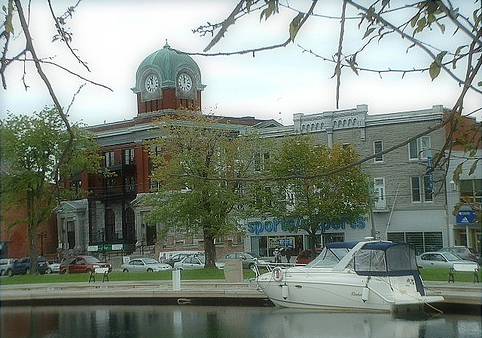
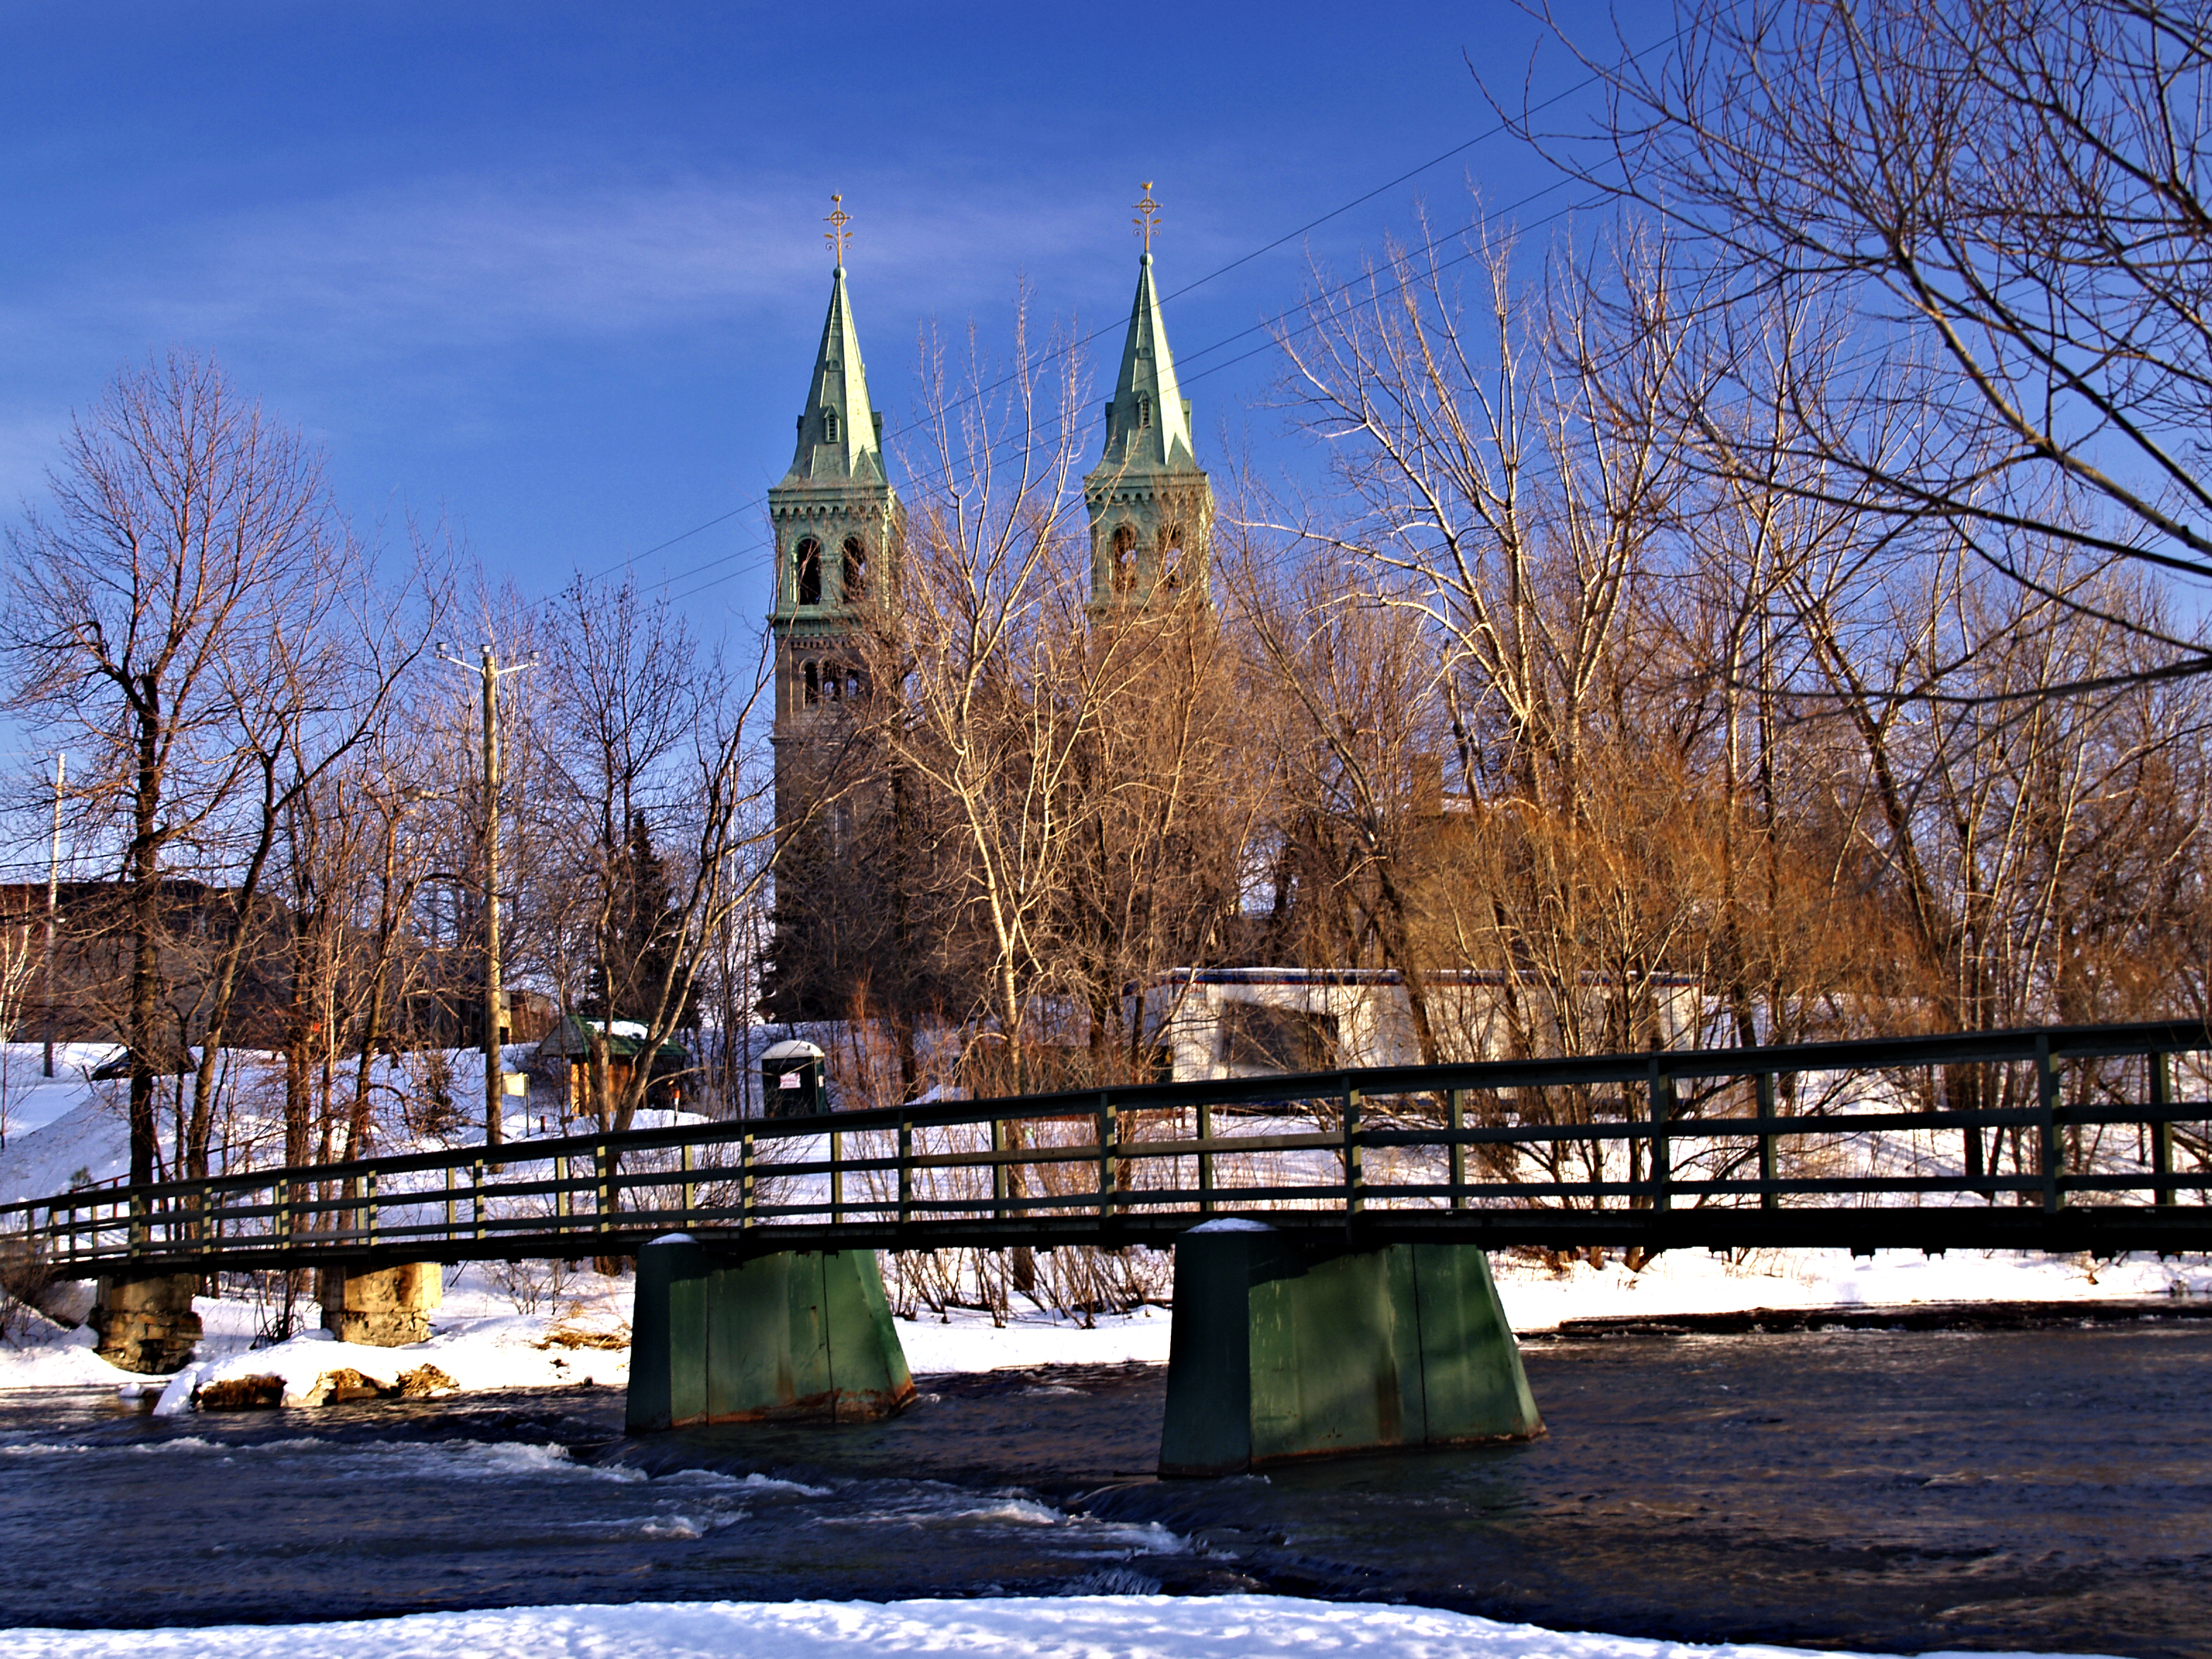
Howick, Quebec
Howick is the third smallest municipality in the Canadian province of Quebec, located in Le Haut-Saint-Laurent Regional County Municipality. The population as of the Canada 2011 Census was 630, of which over 60% are Francophones. Situated along the E..
Howick, Quebec Wikipedia Page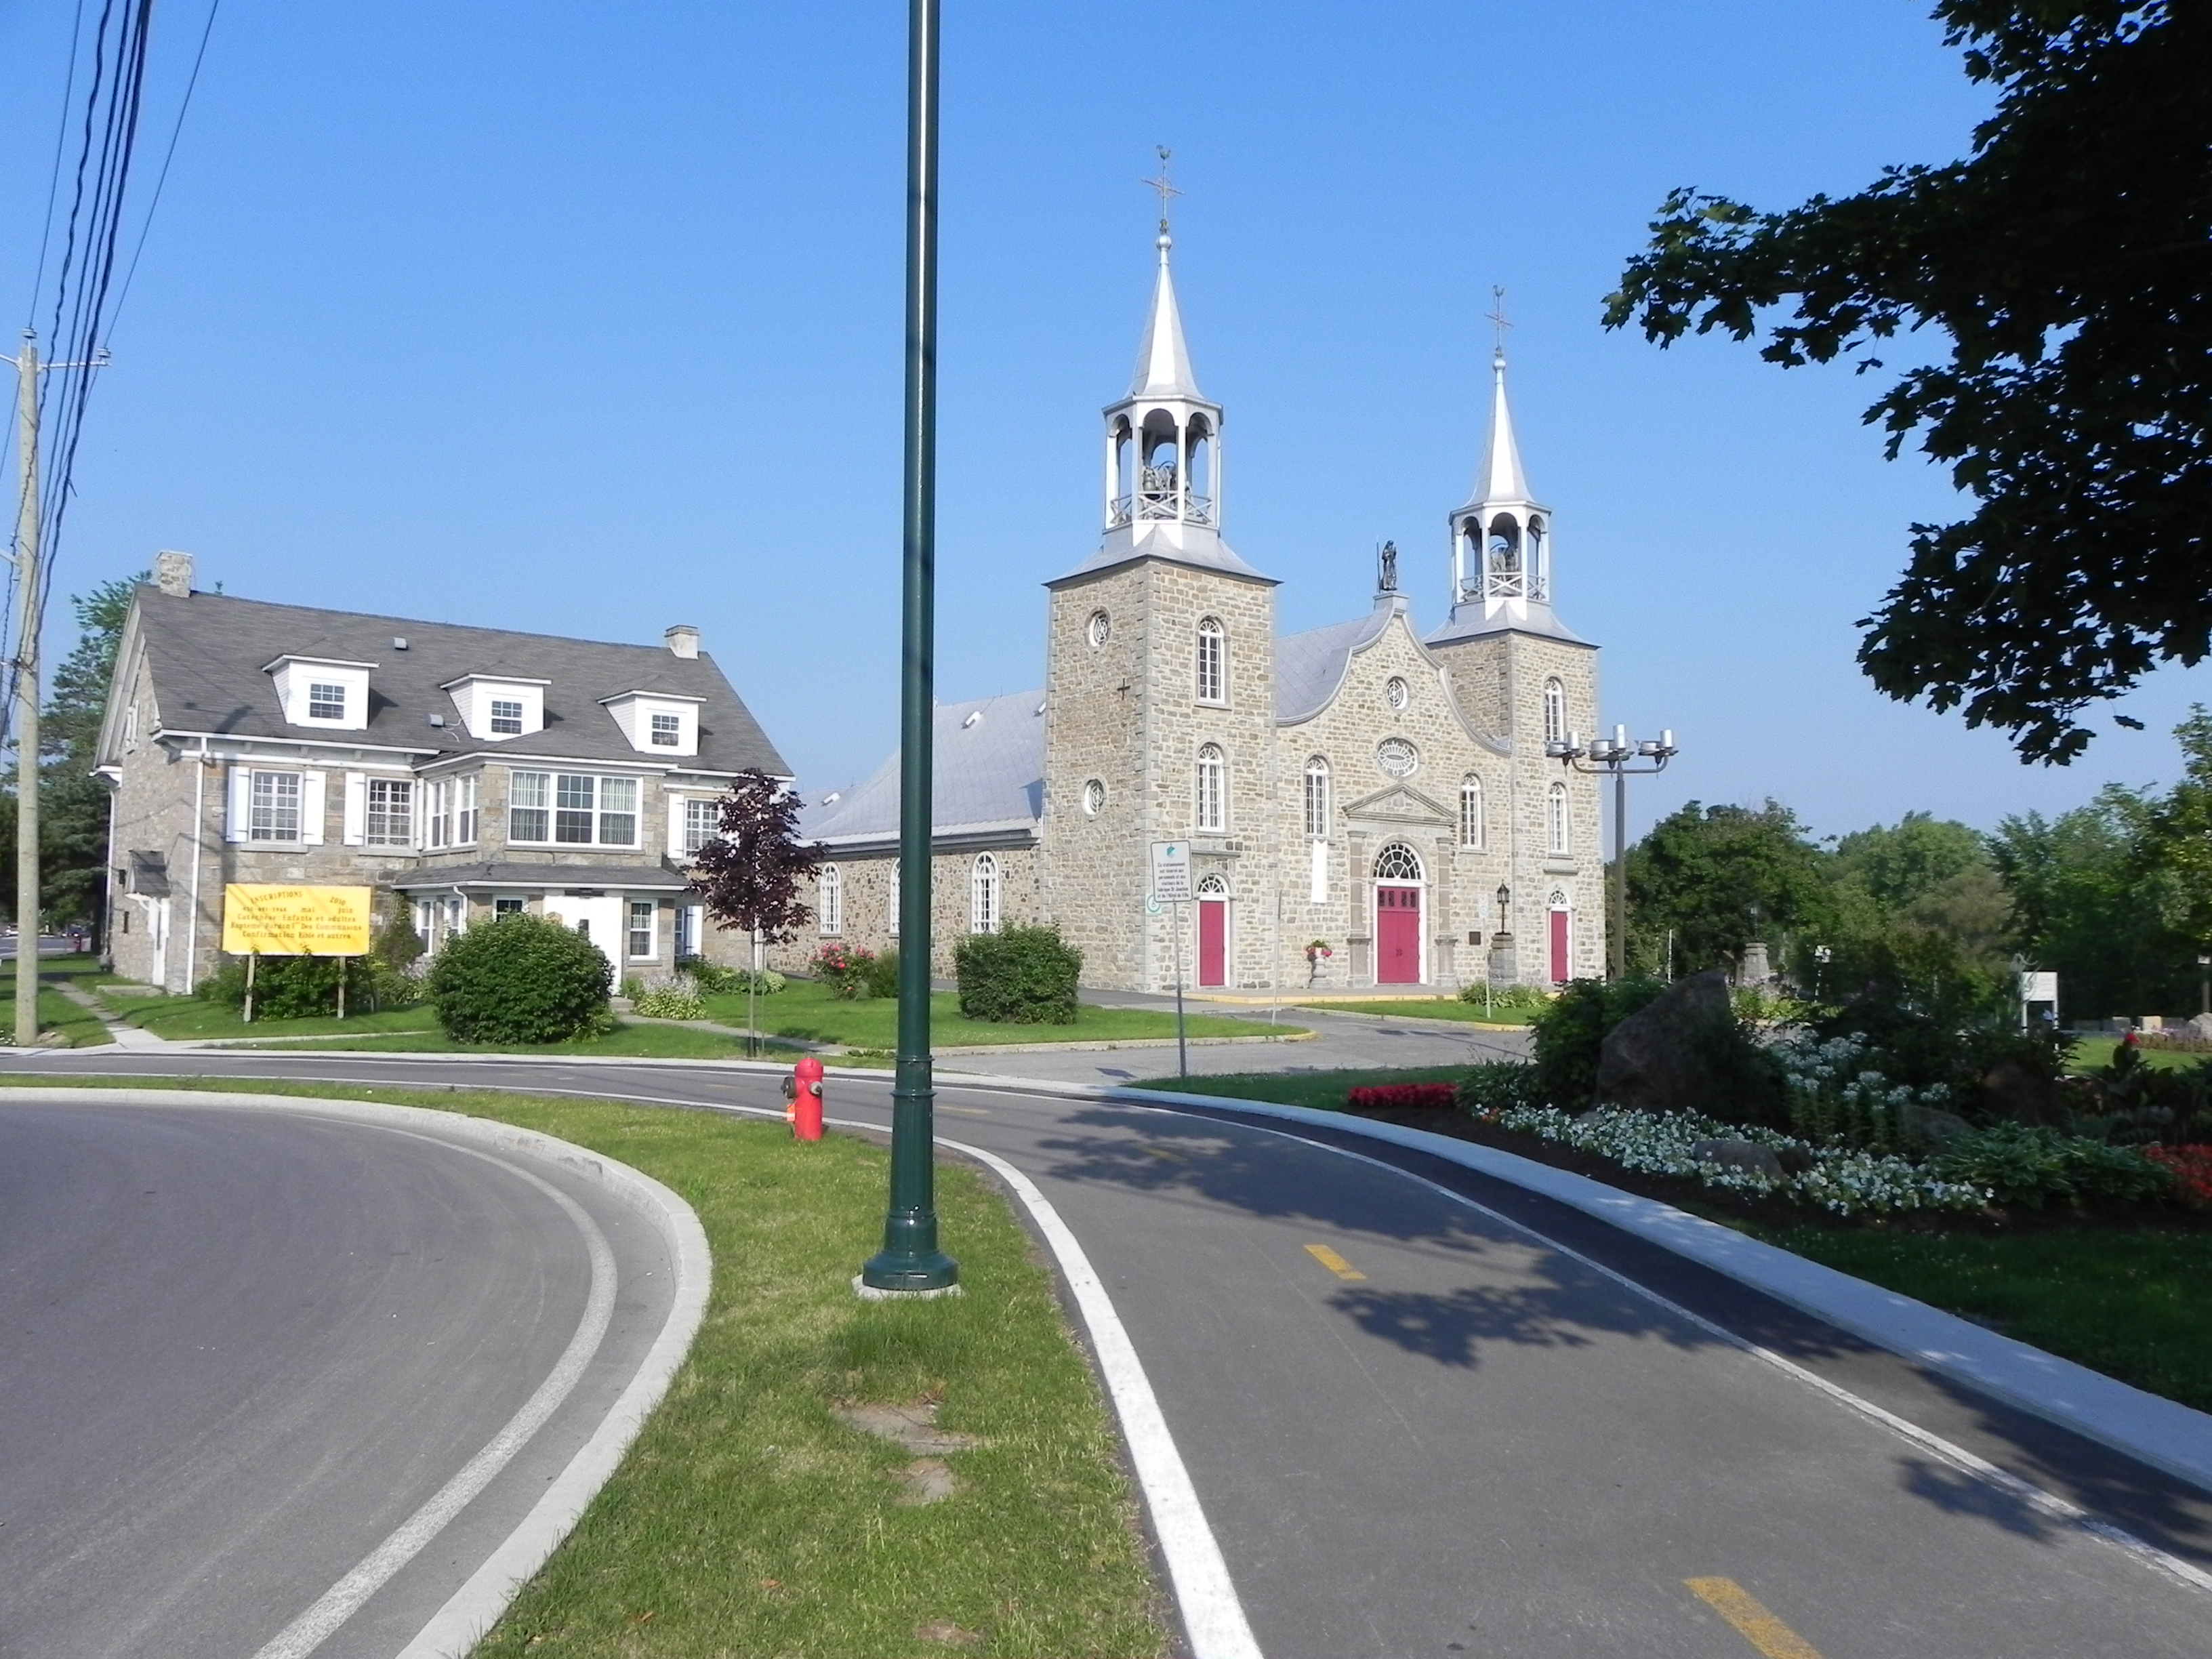
About Our Data
The data on this page is estimated using a number of publicly available tools and resources. It is provided without warranty, and could contain inaccuracies. Use at your own risk.