Categories in Innisfil
Industries
Business Distribution by Industry in Innisfil
| Industry Description | Number of Establishments | Average Age of Business |
|---|---|---|
| Restaurants | 94 | 23 years |
| Construction of buildings | 87 | 23 years |
| Shopping | 85 | 20 years |
| General contractors | 67 | 22 years |
| Shopping other | 60 | 24 years |
| Car repair | 58 | 19 years |
| Corporate management | 58 | 22 years |
| Other construction | 58 | 22 years |
| Real estate | 49 | 27 years |
| Beauty salons | 49 | 19 years |
Innisfil Facts
| Area | 284.2 km² |
| Population | 36,981 |
| Male Population | 18,473 (50.0%) |
| Female Population | 18,508 (50.0%) |
| Population change (1975 to 2020) | +68.8% |
| Population change (2000 to 2020) | +22.6% |
| Median Age | 41.6 years (Male: 41.1, Female: 42) |
| Area Codes | 705, 905 |
| Neighborhoods | Alcona, Cookstown, Holly, Gilford, Belle Ewart |
| Local Time | |
| Timezone | Eastern Daylight Time |
| Lat & Lng | 44.30011, -79.64964 |
| Postal Codes | L0L, L4N, L9J, L9S |
Map of Innisfil
Interactive Map
Innisfil Population
Years 1975 to 2020
| Data | 1975 | 1990 | 2000 | 2015 | 2020 |
|---|---|---|---|---|---|
| Population | 21,905 | 27,016 | 30,171 | 35,107 | 36,981 |
| Population Density | 77.1 / km² | 95.1 / km² | 106.2 / km² | 123.5 / km² | 130.1 / km² |
Innisfil Population change from 2000 to 2015
Increase of 16.4% from year 2000 to 2015
| Location | Change since 1975 | Change since 1990 | Change since 2000 |
|---|---|---|---|
| Innisfil | +60.3% | +29.9% | +16.4% |
| Ontario | +52.6% | +28.6% | +16.4% |
| Canada | +55.8% | +30.2% | +17.2% |
Innisfil Median Age
Median Age: 41.6 years
| Location | Median Age | Median Age (Female) | Median Age (Male) |
|---|---|---|---|
| Innisfil | 41.6 yrs | 42 yrs | 41.1 yrs |
| Ontario | 40.6 yrs | 41.4 yrs | 39.6 yrs |
| Canada | 40.6 yrs | 41.5 yrs | 39.6 yrs |
Innisfil Population Density
Population Density: 130 / km²
| Location | Population | Area | Density |
|---|---|---|---|
| Innisfil | 36,981 | 284.2 km² | 130 / km² |
| Ontario | 13.8 million | 1,078,182.8 km² | 12.8 / km² |
| Canada | 35.5 million | 9,875,295.4 km² | 3.6 / km² |
Innisfil Historical and Projected Population
Estimated Population from 1830 to 2100
- JRC (European Commission's Joint Research Centre) work on the GHS built-up grid
- CIESIN (Center for International Earth Science Information Network)
- [Link] Klein Goldewijk, K., Beusen, A., Doelman, J., and Stehfest, E.: Anthropogenic land use estimates for the Holocene – HYDE 3.2, Earth Syst. Sci. Data, 9, 927–953, https://doi.org/10.5194/essd-9-927-2017, 2017.
Neighborhoods in Innisfil
Percentage of businesses by neighborhood in Innisfil
Area Codes
Percentage Area Codes used by businesses in Innisfil
Postal Codes
Percentage of businesses by Postal Codes in Innisfil
Price Distribution
Business distribution by price for Innisfil
Human Development Index (HDI)
Statistic composite index of life expectancy, education, and per capita income.
Innisfil CO2 Emissions
Carbon Dioxide (CO2) Emissions Per Capita in Tonnes Per Year
| Location | CO2 Emissions | CO2 Emissions Per Capita | CO2 Emissions Intensity |
|---|---|---|---|
| Innisfil | 561,735 tn | 15.19 tn | 1,976.6 tons/km² |
| Ontario | 197,940,137 tn | 14.38 tn | 183.6 tons/km² |
| Canada | 521,999,336 tn | 14.7 tn | 52.9 tons/km² |
| 2013 CO2 emissions (tonnes/year) | 561,735 tn |
| 2013 CO2 emissions (tonnes/year) per capita | 15.19 tn |
| 2013 CO2 emissions intensity (tonnes/km²/year) | 1,976.6 tons/km² |
Recent Nearby Earthquakes
Magnitude 3.0 and greater
| Date▼ | Time↕ | Magnitude↕ | Distance↕ | Depth↕ | Location↕ | Link |
|---|---|---|---|---|---|---|
| 5/8/18 | 9:27 PM | 3 | 84.3 km | 5,050 m | 14km SSE of Ajax, Canada | usgs.gov |
| 10/20/05 | 9:16 PM | 4.2 | 78.3 km | 11,000 m | southern Ontario, Canada | usgs.gov |
| 5/24/00 | 10:22 AM | 3.1 | 70.4 km | 18,000 m | southern Ontario, Canada | usgs.gov |
| 11/26/99 | 10:33 PM | 3.8 | 83.9 km | 12,800 m | New York | usgs.gov |
| 7/23/87 | 9:32 AM | 3.4 | 91 km | 6,800 m | southern Ontario, Canada | usgs.gov |
| 10/4/83 | 5:18 PM | 3.1 | 96.2 km | 2,000 m | southern Ontario, Canada | usgs.gov |
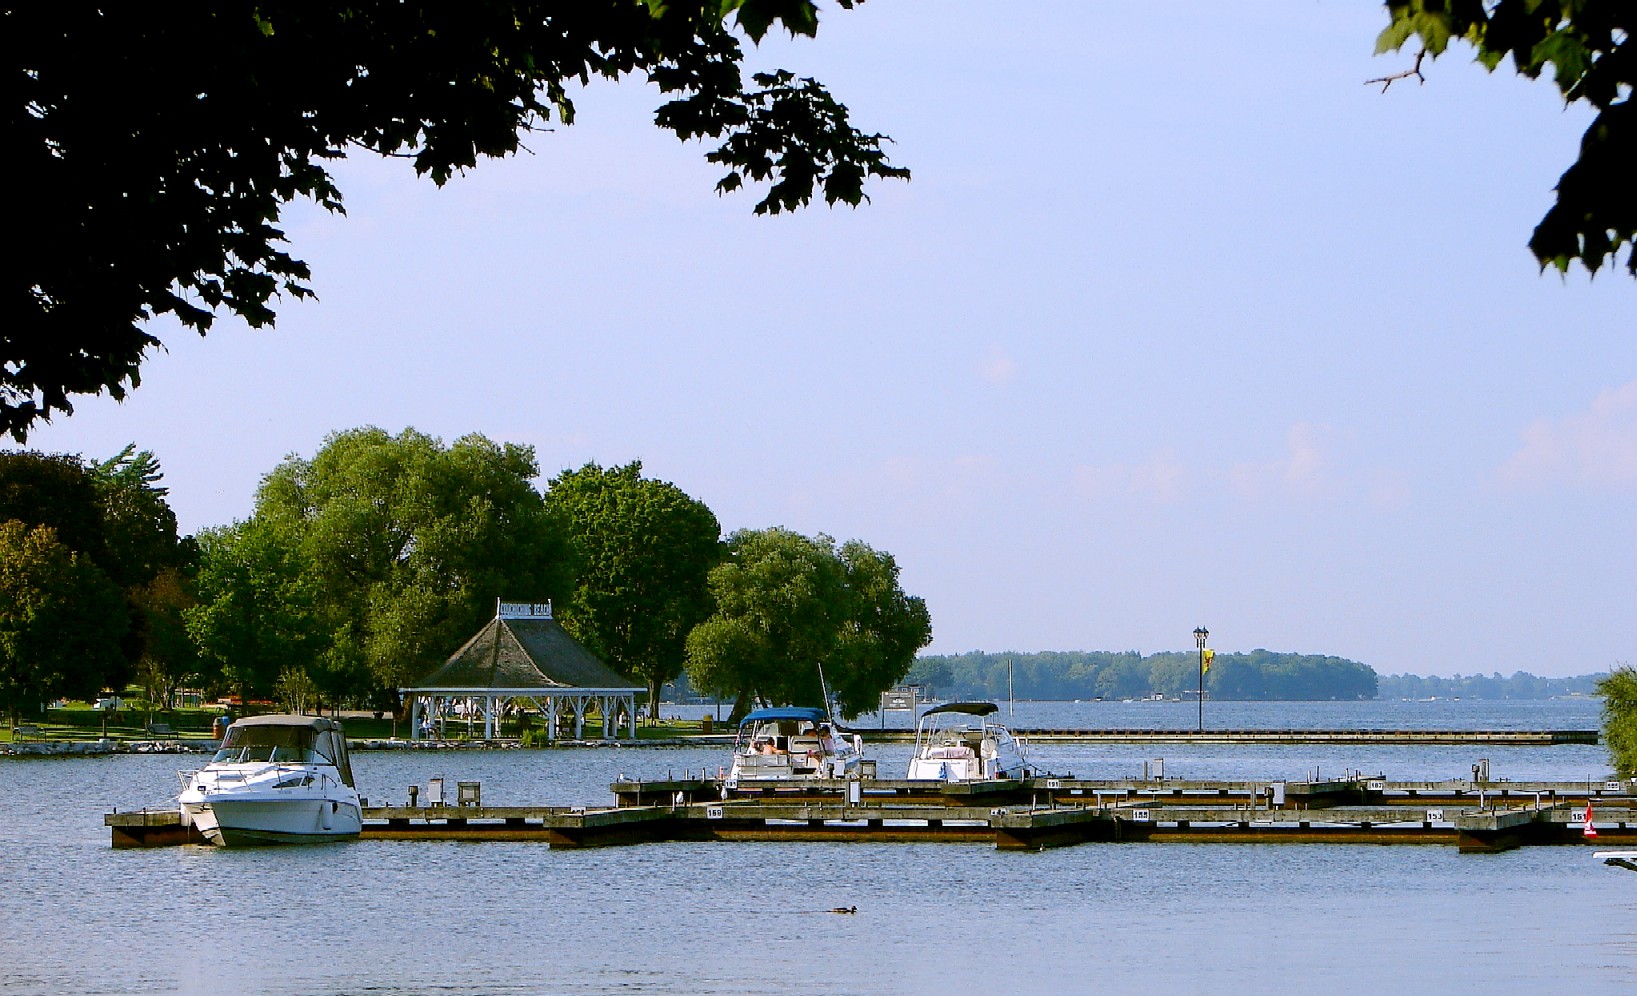
Innisfil
is a town in Ontario, Canada, located on the western shore of Lake Simcoe in Simcoe County, immediately south of Barrie and 80 kilometres north of Toronto. It has historically been a rural area, but growth in the Barrie area and the Greater Toronto..
Innisfil Wikipedia Page

About Our Data
The data on this page is estimated using a number of publicly available tools and resources. It is provided without warranty, and could contain inaccuracies. Use at your own risk.