Categories in Macamic, Quebec
Industries
Business Distribution by Industry in Macamic, Quebec
| Industry Description | Number of Establishments | Average Age of Business |
|---|---|---|
| Public administration | 15 | 29 years |
| Restaurants | 14 | 21 years |
Macamic, Quebec Facts
| Area | 239.8 km² |
| Population | 2,925 |
| Male Population | 1,454 (49.7%) |
| Female Population | 1,471 (50.3%) |
| Population change (1975 to 2020) | +14.9% |
| Population change (2000 to 2020) | +4.7% |
| Median Age | 46.2 years (Male: 46.2, Female: 46.3) |
| Local Time | |
| Timezone | Eastern Daylight Time |
| Lat & Lng | 48.75018, -78.99962 |
| Postal Codes | J0Z |
Map of Macamic, Quebec
Interactive Map
Macamic, Quebec Population
Years 1975 to 2020
| Data | 1975 | 1990 | 2000 | 2015 | 2020 |
|---|---|---|---|---|---|
| Population | 2,546 | 2,733 | 2,793 | 2,841 | 2,925 |
| Population Density | 10.6 / km² | 11.4 / km² | 11.6 / km² | 11.8 / km² | 12.2 / km² |
Macamic, Quebec Population change from 2000 to 2015
Increase of 1.7% from year 2000 to 2015
| Location | Change since 1975 | Change since 1990 | Change since 2000 |
|---|---|---|---|
| Macamic, Quebec | +11.6% | +4% | +1.7% |
| Quebec | +42.5% | +22.6% | +12.9% |
| Canada | +55.8% | +30.2% | +17.2% |
Macamic, Quebec Median Age
Median Age: 46.2 years
| Location | Median Age | Median Age (Female) | Median Age (Male) |
|---|---|---|---|
| Macamic, Quebec | 46.2 yrs | 46.3 yrs | 46.2 yrs |
| Quebec | 42.2 yrs | 43.2 yrs | 41.1 yrs |
| Canada | 40.6 yrs | 41.5 yrs | 39.6 yrs |
Macamic, Quebec Population Density
Population Density: 12.2 / km²
| Location | Population | Area | Density |
|---|---|---|---|
| Macamic, Quebec | 2,925 | 239.8 km² | 12.2 / km² |
| Quebec | 7 million | 1,519,626.9 km² | 4.6 / km² |
| Canada | 35.5 million | 9,875,295.4 km² | 3.6 / km² |
Macamic, Quebec Historical and Projected Population
Estimated Population from 1500 to 2100
- JRC (European Commission's Joint Research Centre) work on the GHS built-up grid
- CIESIN (Center for International Earth Science Information Network)
- [Link] Klein Goldewijk, K., Beusen, A., Doelman, J., and Stehfest, E.: Anthropogenic land use estimates for the Holocene – HYDE 3.2, Earth Syst. Sci. Data, 9, 927–953, https://doi.org/10.5194/essd-9-927-2017, 2017.
Price Distribution
Business distribution by price for Macamic, Quebec
Human Development Index (HDI)
Statistic composite index of life expectancy, education, and per capita income.
Macamic, Quebec CO2 Emissions
Carbon Dioxide (CO2) Emissions Per Capita in Tonnes Per Year
| Location | CO2 Emissions | CO2 Emissions Per Capita | CO2 Emissions Intensity |
|---|---|---|---|
| Macamic, Quebec | 40,011 tn | 13.68 tn | 166.9 tons/km² |
| Quebec | 96,902,370 tn | 13.87 tn | 63.8 tons/km² |
| Canada | 521,999,336 tn | 14.7 tn | 52.9 tons/km² |
| 2013 CO2 emissions (tonnes/year) | 40,011 tn |
| 2013 CO2 emissions (tonnes/year) per capita | 13.68 tn |
| 2013 CO2 emissions intensity (tonnes/km²/year) | 166.9 tons/km² |
Recent Nearby Earthquakes
Magnitude 3.0 and greater
| Date▼ | Time↕ | Magnitude↕ | Distance↕ | Depth↕ | Location↕ | Link |
|---|---|---|---|---|---|---|
| 8/21/75 | 9:42 PM | 3.6 | 95.5 km | 1,000 m | southern Quebec, Canada | usgs.gov |
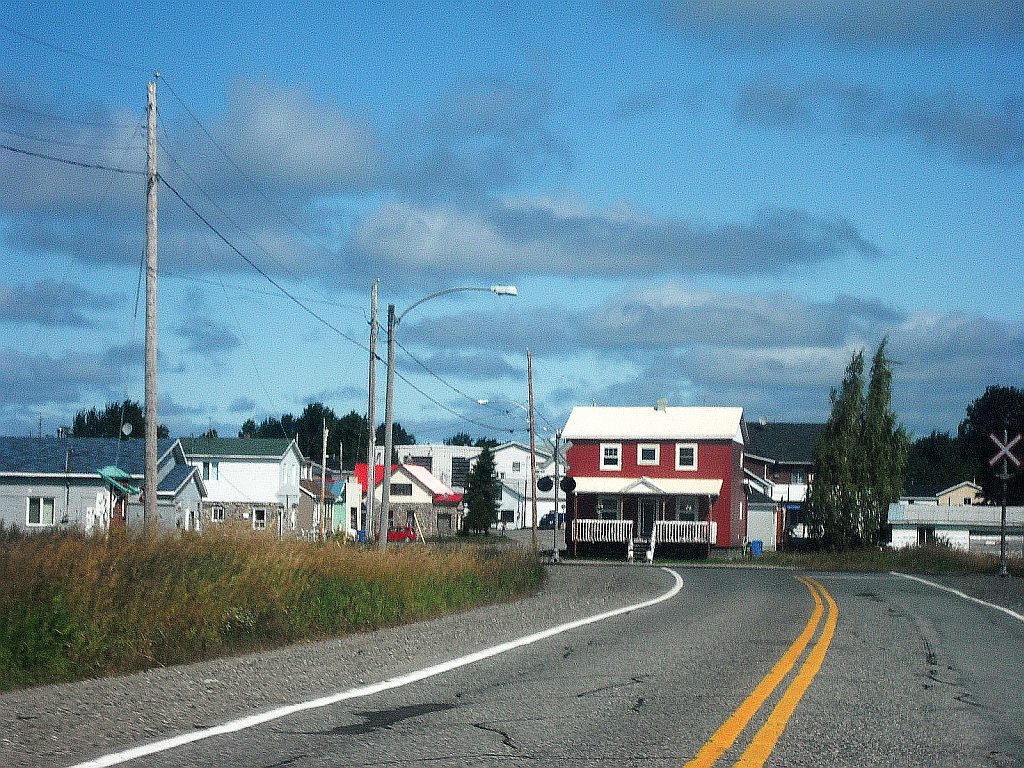
Macamic, Quebec
Macamic is a ville in northwestern Quebec, Canada, in the Abitibi-Ouest Regional County Municipality. It covers 202.34 km² and had a population of 2,734 in the Canada 2011 Census. addition to Macamic itself, the town's territory also includes the co..
Macamic, Quebec Wikipedia Page


About Our Data
The data on this page is estimated using a number of publicly available tools and resources. It is provided without warranty, and could contain inaccuracies. Use at your own risk.