Categories in Nanaimo
Industries
Business Distribution by Industry in Nanaimo
| Industry Description | Number of Establishments | Average Age of Business |
|---|---|---|
| Shopping | 689 | 22 years |
| Health and medical | 525 | 22 years |
| Restaurants | 523 | 21 years |
| Real estate | 463 | 21 years |
| Construction of buildings | 359 | 22 years |
| Corporate management | 341 | 21 years |
| Shopping other | 283 | 21 years |
| Lawyers legal | 266 | 22 years |
| General contractors | 261 | 21 years |
| Public parks | 250 | 23 years |
| Public administration | 249 | 27 years |
| Hairdressers | 238 | 21 years |
| Clothing stores | 217 | 20 years |
| Accountants | 210 | 22 years |
| Social work | 209 | 21 years |
| Car repair | 207 | 24 years |
| Other construction | 206 | 21 years |
Nanaimo Facts
| Area | 92.9 km² |
| Population | 94,822 |
| Male Population | 45,719 (48.2%) |
| Female Population | 49,103 (51.8%) |
| Population change (1975 to 2020) | +69.9% |
| Population change (2000 to 2020) | +23.3% |
| Median Age | 44.8 years (Male: 43.4, Female: 45.9) |
| Area Codes | 250 |
| Neighborhoods | Dover Community Association, Wellington, Departure Bay, Downtown Victoria, West Side |
| Local Time | |
| Timezone | Pacific Daylight Time |
| Lat & Lng | 49.16638, -123.94003 |
| Postal Codes | V0R, V9R, V9S, V9T, V9V, More |
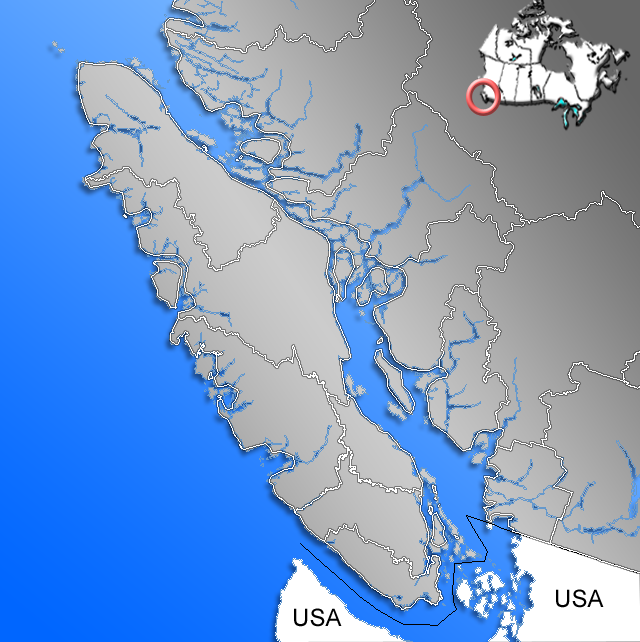
Map of Nanaimo
Interactive Map
Nanaimo Population
Years 1975 to 2020
| Data | 1975 | 1990 | 2000 | 2015 | 2020 |
|---|---|---|---|---|---|
| Population | 55,797 | 68,661 | 76,884 | 89,682 | 94,822 |
| Population Density | 600.4 / km² | 738.8 / km² | 827.3 / km² | 965 / km² | 1,020.3 / km² |
Nanaimo Population change from 2000 to 2015
Increase of 16.6% from year 2000 to 2015
| Location | Change since 1975 | Change since 1990 | Change since 2000 |
|---|---|---|---|
| Nanaimo | +60.7% | +30.6% | +16.6% |
| British Columbia | +72.3% | +37.5% | +20.7% |
| Canada | +55.8% | +30.2% | +17.2% |
Nanaimo Median Age
Median Age: 44.8 years
| Location | Median Age | Median Age (Female) | Median Age (Male) |
|---|---|---|---|
| Nanaimo | 44.8 yrs | 45.9 yrs | 43.4 yrs |
| British Columbia | 42.3 yrs | 43.1 yrs | 41.4 yrs |
| Canada | 40.6 yrs | 41.5 yrs | 39.6 yrs |
Nanaimo Population Density
Population Density: 1,020 / km²
| Location | Population | Area | Density |
|---|---|---|---|
| Nanaimo | 94,822 | 92.9 km² | 1,020 / km² |
| British Columbia | 4.8 million | 978,582 km² | 4.9 / km² |
| Canada | 35.5 million | 9,875,295.4 km² | 3.6 / km² |
Nanaimo Historical and Projected Population
Estimated Population from 1900 to 2100
- JRC (European Commission's Joint Research Centre) work on the GHS built-up grid
- CIESIN (Center for International Earth Science Information Network)
- [Link] Klein Goldewijk, K., Beusen, A., Doelman, J., and Stehfest, E.: Anthropogenic land use estimates for the Holocene – HYDE 3.2, Earth Syst. Sci. Data, 9, 927–953, https://doi.org/10.5194/essd-9-927-2017, 2017.
Neighborhoods in Nanaimo
Percentage of businesses by neighborhood in Nanaimo
Postal Codes
Percentage of businesses by Postal Codes in Nanaimo
Price Distribution
Business distribution by price for Nanaimo
Human Development Index (HDI)
Statistic composite index of life expectancy, education, and per capita income.
Nanaimo CO2 Emissions
Carbon Dioxide (CO2) Emissions Per Capita in Tonnes Per Year
| Location | CO2 Emissions | CO2 Emissions Per Capita | CO2 Emissions Intensity |
|---|---|---|---|
| Nanaimo | 1,167,454 tn | 12.31 tn | 12,561.7 tons/km² |
| British Columbia | 68,179,723 tn | 14.33 tn | 69.7 tons/km² |
| Canada | 521,999,336 tn | 14.7 tn | 52.9 tons/km² |
| 2013 CO2 emissions (tonnes/year) | 1,167,454 tn |
| 2013 CO2 emissions (tonnes/year) per capita | 12.31 tn |
| 2013 CO2 emissions intensity (tonnes/km²/year) | 12,561.7 tons/km² |
Natural Hazards Risk
Relative risk out of 10
| Hazard | Risk Level |
|---|---|
| Earthquake | Medium (6) |
| Landslide | Medium (6) |
* Risk, particularly concerning flood or landslide, may not be for the entire area.
- Dilley, M., R.S. Chen, U. Deichmann, A.L. Lerner-Lam, M. Arnold, J. Agwe, P. Buys, O. Kjekstad, B. Lyon, and G. Yetman. 2005. Natural Disaster Hotspots: A Global Risk Analysis. Washington, D.C.: World Bank. https://doi.org/10.1596/0-8213-5930-4.
- Center for Hazards and Risk Research - CHRR - Columbia University, Center for International Earth Science Information Network - CIESIN - Columbia University, and Norwegian Geotechnical Institute - NGI. 2005. Global Landslide Hazard Distribution. Palisades, NY: NASA Socioeconomic Data and Applications Center (SEDAC). https://doi.org/10.7927/H4P848VZ.
- Center for Hazards and Risk Research - CHRR - Columbia University, Center for International Earth Science Information Network - CIESIN - Columbia University. 2005. Global Earthquake Hazard Distribution - Peak Ground Acceleration. Palisades, NY: NASA Socioeconomic Data and Applications Center (SEDAC). https://doi.org/10.7927/H4BZ63ZS.
Recent Nearby Earthquakes
Magnitude 3.0 and greater
| Date▼ | Time↕ | Magnitude↕ | Distance↕ | Depth↕ | Location↕ | Link |
|---|---|---|---|---|---|---|
| 6/8/18 | 5:09 PM | 3.19 | 65.7 km | 58,210 m | 20km SSW of Point Roberts, Washington | usgs.gov |
| 2/4/18 | 6:57 AM | 3.09 | 84.5 km | 12,690 m | 13km NW of Friday Harbor, Washington | usgs.gov |
| 1/30/17 | 11:03 AM | 3.09 | 88.7 km | 14,590 m | 9km NNW of Friday Harbor, Washington | usgs.gov |
| 4/4/16 | 6:36 PM | 3.1 | 65.8 km | 5,000 m | 30km NNE of Sechelt, Canada | usgs.gov |
| 12/30/15 | 7:39 AM | 4.79 | 79.8 km | 52,420 m | 17km NNE of Victoria, Canada | usgs.gov |
| 2/15/15 | 4:12 AM | 3.4 | 67.6 km | 3,410 m | 32km NNE of Sechelt, Canada | usgs.gov |
| 12/11/14 | 2:53 PM | 3.2 | 32.8 km | 65,800 m | 17km W of Sechelt, Canada | usgs.gov |
| 6/16/14 | 8:40 PM | 3.01 | 87.1 km | 23,851 m | 11km NE of Victoria, Canada | usgs.gov |
| 12/27/12 | 6:36 AM | 3.96 | 76.3 km | 54,491 m | San Juan Islands region, Washington | usgs.gov |
| 8/29/12 | 10:20 PM | 3.3 | 77.1 km | 26,500 m | Washington-British Columbia border region | usgs.gov |
Nanaimo
Nanaimo /nəˈnaɪmoʊ/ (Canada 2011 Census population 83,810) is a city on Vancouver Island in British Columbia, Canada. It is known as "The Harbour City." Previously known as the "Hub City" because of its central location on the island. It has also bee..
Nanaimo Wikipedia Page

About Our Data
The data on this page is estimated using a number of publicly available tools and resources. It is provided without warranty, and could contain inaccuracies. Use at your own risk.