Categories in Rigaud, Quebec
Industries
Business Distribution by Industry in Rigaud, Quebec
| Industry Description | Number of Establishments | Average Age of Business |
|---|---|---|
| Restaurants | 50 | 21 years |
| Public administration | 30 | — |
| Car repair | 28 | 23 years |
| Shopping | 27 | 19 years |
| Construction of buildings | 23 | 24 years |
| Shopping other | 19 | 28 years |
| Health and medical | 17 | 24 years |
| Gas station | 14 | — |
| Education | 13 | — |
| Hairdressers | 12 | 26 years |
| Wholesale of construction supplies | 12 | 22 years |
| Public parks | 12 | — |
| All food and beverage | 12 | 23 years |
| Real estate | 11 | 21 years |
| Beauty salons | 11 | — |
Rigaud, Quebec Facts
| Area | 101.8 km² |
| Population | 8,832 |
| Male Population | 4,407 (49.9%) |
| Female Population | 4,425 (50.1%) |
| Population change (1975 to 2020) | +246.4% |
| Population change (2000 to 2020) | +59.9% |
| Median Age | 45.1 years (Male: 44.8, Female: 45.4) |
| Area Codes | 450 |
| Neighborhoods | Dorion, Rosemont-La Petite-Patrie, Neufchâtel Est-Lebourgneuf |
| Local Time | |
| Timezone | Eastern Daylight Time |
| Lat & Lng | 45.47927, -74.30238 |
| Postal Codes | J0P |
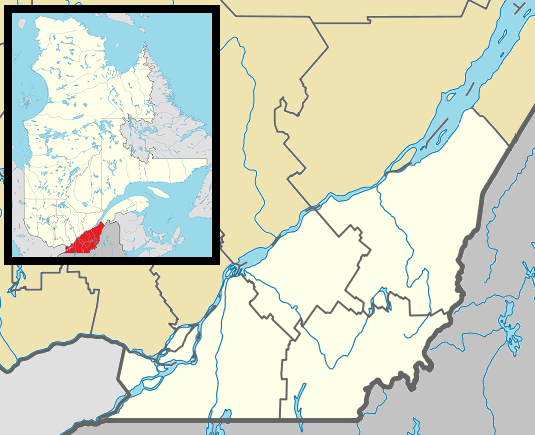
Map of Rigaud, Quebec
Interactive Map
Rigaud, Quebec Population
Years 1975 to 2020
| Data | 1975 | 1990 | 2000 | 2015 | 2020 |
|---|---|---|---|---|---|
| Population | 2,550 | 4,117 | 5,523 | 8,454 | 8,832 |
| Population Density | 25.1 / km² | 40.5 / km² | 54.3 / km² | 83.1 / km² | 86.8 / km² |
Rigaud, Quebec Population change from 2000 to 2015
Increase of 53.1% from year 2000 to 2015
| Location | Change since 1975 | Change since 1990 | Change since 2000 |
|---|---|---|---|
| Rigaud, Quebec | +231.5% | +105.3% | +53.1% |
| Quebec | +42.5% | +22.6% | +12.9% |
| Canada | +55.8% | +30.2% | +17.2% |
Rigaud, Quebec Median Age
Median Age: 45.1 years
| Location | Median Age | Median Age (Female) | Median Age (Male) |
|---|---|---|---|
| Rigaud, Quebec | 45.1 yrs | 45.4 yrs | 44.8 yrs |
| Quebec | 42.2 yrs | 43.2 yrs | 41.1 yrs |
| Canada | 40.6 yrs | 41.5 yrs | 39.6 yrs |
Rigaud, Quebec Population Density
Population Density: 86.8 / km²
| Location | Population | Area | Density |
|---|---|---|---|
| Rigaud, Quebec | 8,832 | 101.8 km² | 86.8 / km² |
| Quebec | 7 million | 1,519,626.9 km² | 4.6 / km² |
| Canada | 35.5 million | 9,875,295.4 km² | 3.6 / km² |
Rigaud, Quebec Historical and Projected Population
Estimated Population from 1780 to 2100
- JRC (European Commission's Joint Research Centre) work on the GHS built-up grid
- CIESIN (Center for International Earth Science Information Network)
- [Link] Klein Goldewijk, K., Beusen, A., Doelman, J., and Stehfest, E.: Anthropogenic land use estimates for the Holocene – HYDE 3.2, Earth Syst. Sci. Data, 9, 927–953, https://doi.org/10.5194/essd-9-927-2017, 2017.
Area Codes
Percentage Area Codes used by businesses in Rigaud, Quebec
Price Distribution
Business distribution by price for Rigaud, Quebec
Human Development Index (HDI)
Statistic composite index of life expectancy, education, and per capita income.
Rigaud, Quebec CO2 Emissions
Carbon Dioxide (CO2) Emissions Per Capita in Tonnes Per Year
| Location | CO2 Emissions | CO2 Emissions Per Capita | CO2 Emissions Intensity |
|---|---|---|---|
| Rigaud, Quebec | 133,824 tn | 15.15 tn | 1,315.2 tons/km² |
| Quebec | 96,902,370 tn | 13.87 tn | 63.8 tons/km² |
| Canada | 521,999,336 tn | 14.7 tn | 52.9 tons/km² |
| 2013 CO2 emissions (tonnes/year) | 133,824 tn |
| 2013 CO2 emissions (tonnes/year) per capita | 15.15 tn |
| 2013 CO2 emissions intensity (tonnes/km²/year) | 1,315.2 tons/km² |
Natural Hazards Risk
Relative risk out of 10
| Hazard | Risk Level |
|---|---|
| Earthquake | Medium (6) |
* Risk, particularly concerning flood or landslide, may not be for the entire area.
- Dilley, M., R.S. Chen, U. Deichmann, A.L. Lerner-Lam, M. Arnold, J. Agwe, P. Buys, O. Kjekstad, B. Lyon, and G. Yetman. 2005. Natural Disaster Hotspots: A Global Risk Analysis. Washington, D.C.: World Bank. https://doi.org/10.1596/0-8213-5930-4.
- Center for Hazards and Risk Research - CHRR - Columbia University, Center for International Earth Science Information Network - CIESIN - Columbia University. 2005. Global Earthquake Hazard Distribution - Peak Ground Acceleration. Palisades, NY: NASA Socioeconomic Data and Applications Center (SEDAC). https://doi.org/10.7927/H4BZ63ZS.
Recent Nearby Earthquakes
Magnitude 3.0 and greater
| Date▼ | Time↕ | Magnitude↕ | Distance↕ | Depth↕ | Location↕ | Link |
|---|---|---|---|---|---|---|
| 10/19/17 | 11:08 AM | 3.1 | 85.3 km | 10,000 m | 9km W of Mont-Tremblant, Canada | usgs.gov |
| 11/28/15 | 5:16 AM | 3.23 | 65 km | 5,000 m | 4km S of Cornwall, Canada | usgs.gov |
| 7/15/15 | 10:00 PM | 3.27 | 18.9 km | 10,230 m | 13km SSE of Hawkesbury, Canada | usgs.gov |
| 7/4/14 | 10:55 PM | 3 | 65.5 km | 18,000 m | 27km NE of Saint-Andre-Avellin, Canada | usgs.gov |
| 11/6/12 | 9:05 AM | 3.74 | 28 km | 11,070 m | Ontario-Quebec border region, Canada | usgs.gov |
| 10/10/12 | 4:19 AM | 3.93 | 86.3 km | 8,550 m | southern Quebec, Canada | usgs.gov |
| 9/18/11 | 7:19 PM | 3.84 | 74.1 km | 5,000 m | Ontario-Quebec border region, Canada | usgs.gov |
| 8/24/11 | 5:14 PM | 3.19 | 86.5 km | 5,000 m | New York | usgs.gov |
| 3/16/11 | 5:36 PM | 3.87 | 23.8 km | 10,000 m | Ontario-Quebec border region, Canada | usgs.gov |
| 2/28/10 | 3:51 AM | 3.41 | 29.9 km | 7,370 m | Ontario-Quebec border region, Canada | usgs.gov |
Rigaud, Quebec
Rigaud is a municipality in southwestern Quebec, Canada in the county of Vaudreuil-Soulanges in Vallée-du-Haut-Saint-Laurent region. The municipality is located at the junction of Ottawa River and Rigaud River. It is situated about 70 kilometres west..
Rigaud, Quebec Wikipedia Page


About Our Data
The data on this page is estimated using a number of publicly available tools and resources. It is provided without warranty, and could contain inaccuracies. Use at your own risk.