Categories in Rosetown
Industries
Business Distribution by Industry in Rosetown
| Industry Description | Number of Establishments | Average Age of Business |
|---|---|---|
| Restaurants | 18 | 23 years |
| Public administration | 16 | 27 years |
| Car repair | 15 | 26 years |
| Shopping | 12 | 20 years |
| Gas station | 12 | — |
| Religion | 10 | 29 years |
| Education | 7 | — |
| Car wash and detail | 6 | — |
| Tractors and farm equipment | 6 | 33 years |
| Financial services | 6 | — |
| Electrical installation | 5 | — |
| Health and medical | 5 | — |
| Hardware store | 5 | — |
| Social work | 5 | 26 years |
| Beauty salons | 5 | — |
Rosetown Facts
| Area | 11.9 km² |
| Population | 2,517 |
| Male Population | 1,201 (47.7%) |
| Female Population | 1,316 (52.3%) |
| Population change (1975 to 2020) | +39.4% |
| Population change (2000 to 2020) | +12.8% |
| Median Age | 48 years (Male: 45.4, Female: 50.1) |
| Area Codes | 306 |
| Neighborhoods | Kingsland |
| Local Time | |
| Timezone | Central Standard Time |
| Lat & Lng | 51.55010, -108.00136 |
| Postal Codes | S0L |
Map of Rosetown
Interactive Map
Rosetown Population
Years 1975 to 2020
| Data | 1975 | 1990 | 2000 | 2015 | 2020 |
|---|---|---|---|---|---|
| Population | 1,805 | 2,081 | 2,231 | 2,438 | 2,517 |
| Population Density | 152 / km² | 175.2 / km² | 187.9 / km² | 205.3 / km² | 212 / km² |
Rosetown Population change from 2000 to 2015
Increase of 9.3% from year 2000 to 2015
| Location | Change since 1975 | Change since 1990 | Change since 2000 |
|---|---|---|---|
| Rosetown | +35.1% | +17.2% | +9.3% |
| Saskatchewan | +68.7% | +35.9% | +19.9% |
| Canada | +55.8% | +30.2% | +17.2% |
Rosetown Median Age
Median Age: 48 years
| Location | Median Age | Median Age (Female) | Median Age (Male) |
|---|---|---|---|
| Rosetown | 48 yrs | 50.1 yrs | 45.4 yrs |
| Saskatchewan | 38.4 yrs | 39.4 yrs | 37.3 yrs |
| Canada | 40.6 yrs | 41.5 yrs | 39.6 yrs |
Rosetown Population Density
Population Density: 212 / km²
| Location | Population | Area | Density |
|---|---|---|---|
| Rosetown | 2,517 | 11.9 km² | 212 / km² |
| Saskatchewan | 1.1 million | 652,352.6 km² | 1.7 / km² |
| Canada | 35.5 million | 9,875,295.4 km² | 3.6 / km² |
Rosetown Historical and Projected Population
Estimated Population from 1850 to 2100
- JRC (European Commission's Joint Research Centre) work on the GHS built-up grid
- CIESIN (Center for International Earth Science Information Network)
- [Link] Klein Goldewijk, K., Beusen, A., Doelman, J., and Stehfest, E.: Anthropogenic land use estimates for the Holocene – HYDE 3.2, Earth Syst. Sci. Data, 9, 927–953, https://doi.org/10.5194/essd-9-927-2017, 2017.
Price Distribution
Business distribution by price for Rosetown
Human Development Index (HDI)
Statistic composite index of life expectancy, education, and per capita income.
Rosetown CO2 Emissions
Carbon Dioxide (CO2) Emissions Per Capita in Tonnes Per Year
| Location | CO2 Emissions | CO2 Emissions Per Capita | CO2 Emissions Intensity |
|---|---|---|---|
| Rosetown | 38,292 tn | 15.21 tn | 3,224.6 tons/km² |
| Saskatchewan | 14,964,194 tn | 13.41 tn | 22.9 tons/km² |
| Canada | 521,999,336 tn | 14.7 tn | 52.9 tons/km² |
| 2013 CO2 emissions (tonnes/year) | 38,292 tn |
| 2013 CO2 emissions (tonnes/year) per capita | 15.21 tn |
| 2013 CO2 emissions intensity (tonnes/km²/year) | 3,224.6 tons/km² |
Natural Hazards Risk
Relative risk out of 10
| Hazard | Risk Level |
|---|---|
| Drought | Medium (7) |
* Risk, particularly concerning flood or landslide, may not be for the entire area.
- Dilley, M., R.S. Chen, U. Deichmann, A.L. Lerner-Lam, M. Arnold, J. Agwe, P. Buys, O. Kjekstad, B. Lyon, and G. Yetman. 2005. Natural Disaster Hotspots: A Global Risk Analysis. Washington, D.C.: World Bank. https://doi.org/10.1596/0-8213-5930-4.
- Center for Hazards and Risk Research - CHRR - Columbia University, Center for International Earth Science Information Network - CIESIN - Columbia University, and International Research Institute for Climate and Society - IRI - Columbia University. 2005. Global Drought Hazard Frequency and Distribution. Palisades, NY: NASA Socioeconomic Data and Applications Center (SEDAC). https://doi.org/10.7927/H4VX0DFT.
Recent Nearby Earthquakes
Magnitude 3.0 and greater
| Date▼ | Time↕ | Magnitude↕ | Distance↕ | Depth↕ | Location↕ | Link |
|---|---|---|---|---|---|---|
| 11/29/01 | 7:35 AM | 3.1 | 91.9 km | 5,000 m | Saskatchewan, Canada | usgs.gov |
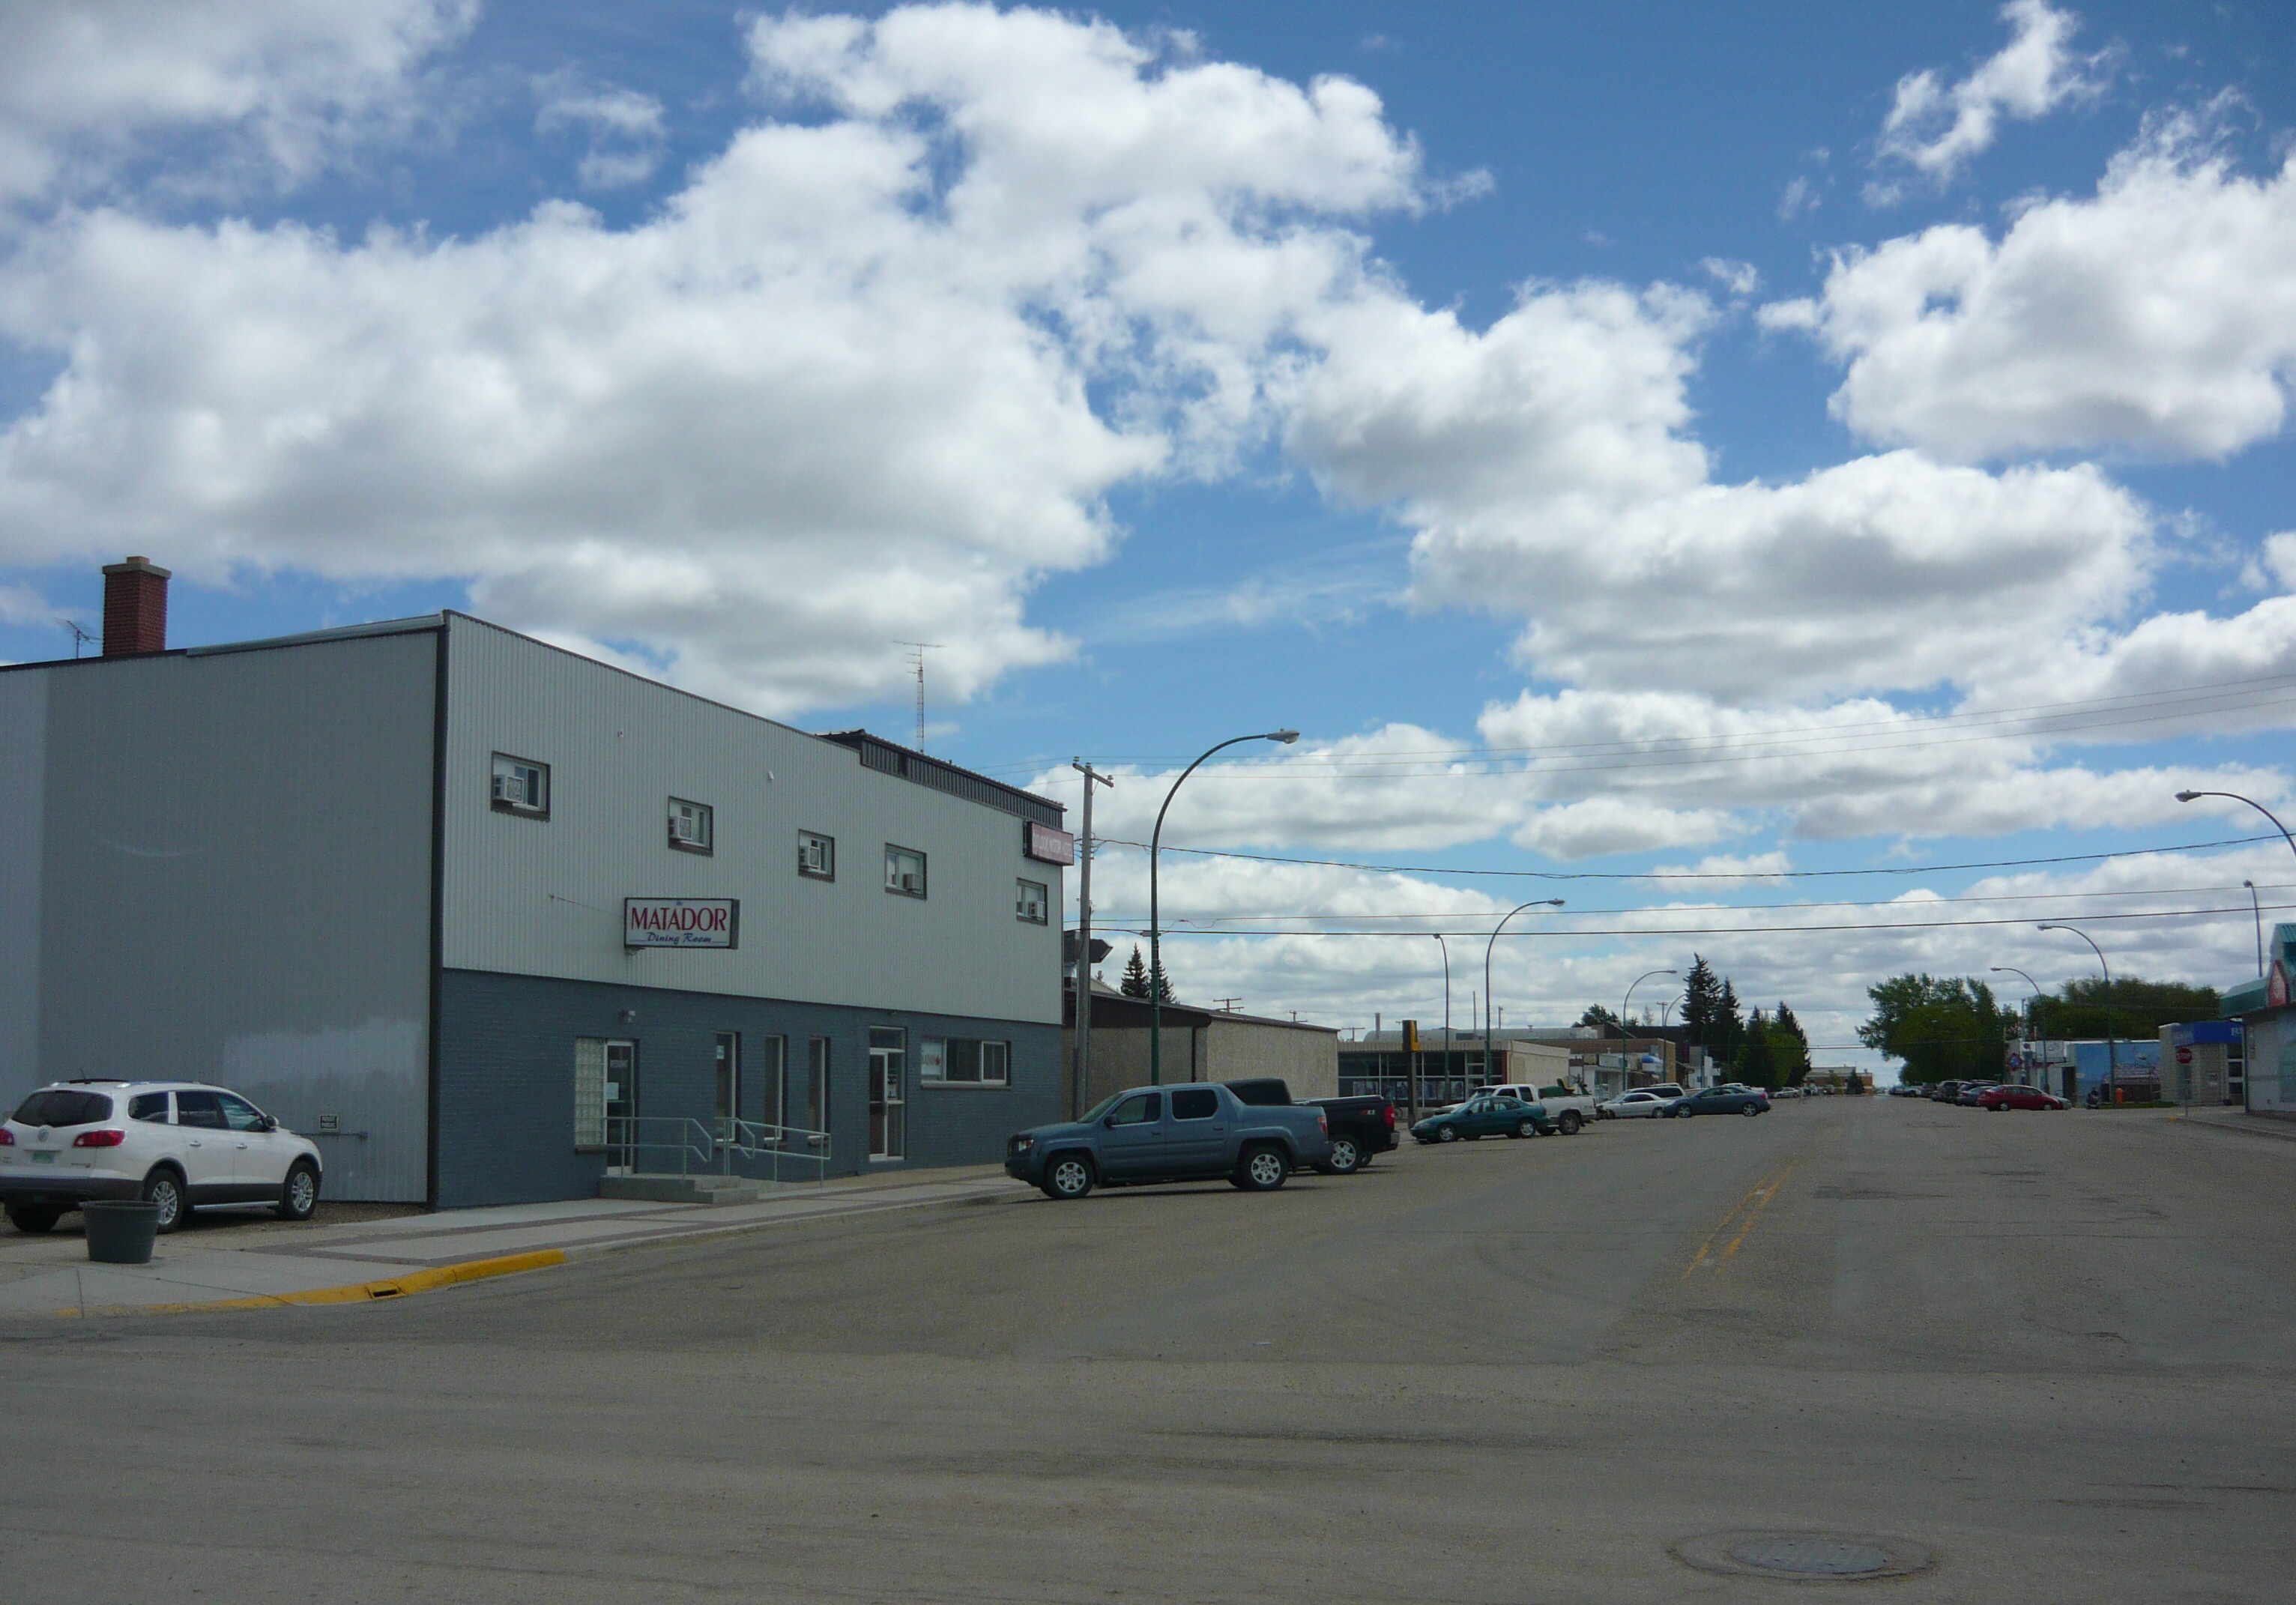
Rosetown
Rosetown is a town in the Canadian province of Saskatchewan, at the junction of provincial Highway 7 and Highway 4, approximately 115 km southwest of Saskatoon. town's motto, "The Heart of the Wheat Belt" reflects its history of being a farming comm..
Rosetown Wikipedia Page


About Our Data
The data on this page is estimated using a number of publicly available tools and resources. It is provided without warranty, and could contain inaccuracies. Use at your own risk.