Categories in Sayabec
Industries
Business Distribution by Industry in Sayabec
| Industry Description | Number of Establishments |
|---|---|
| Unreachable | 5 |
Sayabec Facts
| Area | 139.8 km² |
| Population | 1,938 |
| Male Population | 992 (51.2%) |
| Female Population | 946 (48.8%) |
| Population change (1975 to 2020) | -17.6% |
| Population change (2000 to 2020) | -6.8% |
| Median Age | 46.5 years (Male: 46.8, Female: 46.1) |
| Local Time | |
| Timezone | Eastern Daylight Time |
| Lat & Lng | 48.56161, -67.68745 |
| Postal Codes | G0J, G4W |
Map of Sayabec
Interactive Map
Sayabec Population
Years 1975 to 2020
| Data | 1975 | 1990 | 2000 | 2015 | 2020 |
|---|---|---|---|---|---|
| Population | 2,353 | 2,218 | 2,079 | 1,858 | 1,938 |
| Population Density | 16.8 / km² | 15.9 / km² | 14.9 / km² | 13.3 / km² | 13.9 / km² |
Sayabec Population change from 2000 to 2015
Decrease of 10.6% from year 2000 to 2015
| Location | Change since 1975 | Change since 1990 | Change since 2000 |
|---|---|---|---|
| Sayabec | -21% | -16.2% | -10.6% |
| Quebec | +42.5% | +22.6% | +12.9% |
| Canada | +55.8% | +30.2% | +17.2% |
Sayabec Median Age
Median Age: 46.5 years
| Location | Median Age | Median Age (Female) | Median Age (Male) |
|---|---|---|---|
| Sayabec | 46.5 yrs | 46.1 yrs | 46.8 yrs |
| Quebec | 42.2 yrs | 43.2 yrs | 41.1 yrs |
| Canada | 40.6 yrs | 41.5 yrs | 39.6 yrs |
Sayabec Population Density
Population Density: 13.9 / km²
| Location | Population | Area | Density |
|---|---|---|---|
| Sayabec | 1,938 | 139.8 km² | 13.9 / km² |
| Quebec | 7 million | 1,519,626.9 km² | 4.6 / km² |
| Canada | 35.5 million | 9,875,295.4 km² | 3.6 / km² |
Sayabec Historical and Projected Population
Estimated Population from 1100 to 2100
- JRC (European Commission's Joint Research Centre) work on the GHS built-up grid
- CIESIN (Center for International Earth Science Information Network)
- [Link] Klein Goldewijk, K., Beusen, A., Doelman, J., and Stehfest, E.: Anthropogenic land use estimates for the Holocene – HYDE 3.2, Earth Syst. Sci. Data, 9, 927–953, https://doi.org/10.5194/essd-9-927-2017, 2017.
Human Development Index (HDI)
Statistic composite index of life expectancy, education, and per capita income.
Sayabec CO2 Emissions
Carbon Dioxide (CO2) Emissions Per Capita in Tonnes Per Year
| Location | CO2 Emissions | CO2 Emissions Per Capita | CO2 Emissions Intensity |
|---|---|---|---|
| Sayabec | 25,202 tn | 13 tn | 180.3 tons/km² |
| Quebec | 96,902,370 tn | 13.87 tn | 63.8 tons/km² |
| Canada | 521,999,336 tn | 14.7 tn | 52.9 tons/km² |
| 2013 CO2 emissions (tonnes/year) | 25,202 tn |
| 2013 CO2 emissions (tonnes/year) per capita | 13 tn |
| 2013 CO2 emissions intensity (tonnes/km²/year) | 180.3 tons/km² |
Natural Hazards Risk
Relative risk out of 10
| Hazard | Risk Level |
|---|---|
| Earthquake | Medium (4) |
| Cyclone | Medium (5) |
* Risk, particularly concerning flood or landslide, may not be for the entire area.
- Dilley, M., R.S. Chen, U. Deichmann, A.L. Lerner-Lam, M. Arnold, J. Agwe, P. Buys, O. Kjekstad, B. Lyon, and G. Yetman. 2005. Natural Disaster Hotspots: A Global Risk Analysis. Washington, D.C.: World Bank. https://doi.org/10.1596/0-8213-5930-4.
- Center for Hazards and Risk Research - CHRR - Columbia University, Center for International Earth Science Information Network - CIESIN - Columbia University, International Bank for Reconstruction and Development - The World Bank, and United Nations Environment Programme Global Resource Information Database Geneva - UNEP/GRID-Geneva. 2005. Global Cyclone Hazard Frequency and Distribution. Palisades, NY: NASA Socioeconomic Data and Applications Center (SEDAC). https://doi.org/10.7927/H4CZ353K.
- Center for Hazards and Risk Research - CHRR - Columbia University, Center for International Earth Science Information Network - CIESIN - Columbia University. 2005. Global Earthquake Hazard Distribution - Peak Ground Acceleration. Palisades, NY: NASA Socioeconomic Data and Applications Center (SEDAC). https://doi.org/10.7927/H4BZ63ZS.
Recent Nearby Earthquakes
Magnitude 3.0 and greater
| Date▼ | Time↕ | Magnitude↕ | Distance↕ | Depth↕ | Location↕ | Link |
|---|---|---|---|---|---|---|
| 10/6/17 | 6:16 AM | 3.3 | 58 km | 22,000 m | 24km SE of Baie-Comeau, Canada | usgs.gov |
| 5/26/14 | 9:33 PM | 3.7 | 50.8 km | 21,000 m | 29km SSE of Baie-Comeau, Canada | usgs.gov |
| 11/27/12 | 7:55 AM | 4.2 | 37.5 km | 17,000 m | Gaspe Peninsula, Quebec, Canada | usgs.gov |
| 4/20/95 | 4:37 AM | 3.3 | 65.5 km | 15,000 m | St. Lawrence Valley region, Quebec, Canada | usgs.gov |
| 1/1/89 | 5:55 PM | 4 | 81.8 km | 18,000 m | St. Lawrence Valley region, Quebec, Canada | usgs.gov |
| 2/11/83 | 3:46 PM | 3.6 | 65.5 km | 18,000 m | St. Lawrence Valley region, Quebec, Canada | usgs.gov |
| 1/17/83 | 7:35 PM | 4.5 | 80.1 km | 18,000 m | Gaspe Peninsula, Quebec, Canada | usgs.gov |
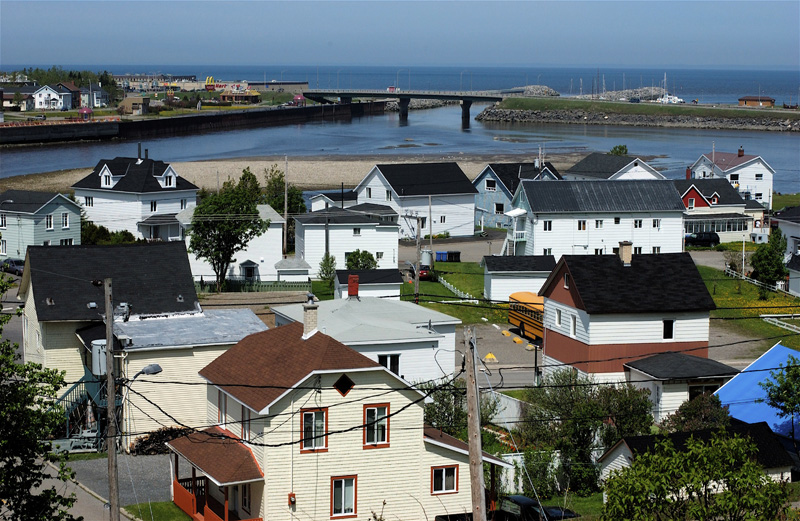
Sayabec
Sayabec (/seɪbɛk/) is a municipality located in the La Matapédia Regional County Municipality (RCM) in the Bas-Saint-Laurent, Quebec, Canada. It is located in the Matapédia Valley between the Chic-Choc Mountains of the Appalachian near the Lake Matap..
Sayabec Wikipedia Page

About Our Data
The data on this page is estimated using a number of publicly available tools and resources. It is provided without warranty, and could contain inaccuracies. Use at your own risk.