Categories in Ste. Anne
Industries
Business Distribution by Industry in Ste. Anne
| Industry Description | Number of Establishments | Average Age of Business |
|---|---|---|
| Restaurants | 68 | — |
| Shopping | 42 | — |
| Car repair | 36 | 27 years |
| Beauty salons | 34 | — |
| Hotels and motels | 33 | — |
| Gas station | 21 | — |
| Construction of buildings | 21 | 33 years |
| Health and medical | 20 | — |
| Shopping other | 18 | — |
| Physicians and surgeons | 18 | — |
| Tractors and farm equipment | 18 | — |
| Public administration | 16 | 26 years |
| Religion | 16 | 26 years |
Ste. Anne Facts
| Area | 476.6 km² |
| Population | 5,701 |
| Male Population | 2,910 (51.0%) |
| Female Population | 2,791 (49.0%) |
| Population change (1975 to 2020) | +278.1% |
| Population change (2000 to 2020) | +65.5% |
| Median Age | 39.1 years (Male: 39.6, Female: 38.5) |
| Area Codes | 204 |
| Neighborhoods | Sainte-Ann-De-Bellevue, Mission Industrial, St. James Industrial |
| Local Time | |
| Timezone | Central Daylight Time |
| Lat & Lng | 49.66969, -96.65000 |
| Postal Codes | R5H |
Map of Ste. Anne
Interactive Map
Ste. Anne Population
Years 1975 to 2020
| Data | 1975 | 1990 | 2000 | 2015 | 2020 |
|---|---|---|---|---|---|
| Population | 1,508 | 2,514 | 3,444 | 5,441 | 5,701 |
| Population Density | 3.2 / km² | 5.3 / km² | 7.2 / km² | 11.4 / km² | 12 / km² |
Ste. Anne Population change from 2000 to 2015
Increase of 58% from year 2000 to 2015
| Location | Change since 1975 | Change since 1990 | Change since 2000 |
|---|---|---|---|
| Ste. Anne | +260.8% | +116.4% | +58% |
| Manitoba | +49.8% | +26.3% | +14.9% |
| Canada | +55.8% | +30.2% | +17.2% |
Ste. Anne Median Age
Median Age: 39.1 years
| Location | Median Age | Median Age (Female) | Median Age (Male) |
|---|---|---|---|
| Ste. Anne | 39.1 yrs | 38.5 yrs | 39.6 yrs |
| Manitoba | 38.2 yrs | 39.3 yrs | 37.1 yrs |
| Canada | 40.6 yrs | 41.5 yrs | 39.6 yrs |
Ste. Anne Population Density
Population Density: 12 / km²
| Location | Population | Area | Density |
|---|---|---|---|
| Ste. Anne | 5,701 | 476.6 km² | 12 / km² |
| Manitoba | 1.3 million | 649,857.2 km² | 2 / km² |
| Canada | 35.5 million | 9,875,295.4 km² | 3.6 / km² |
Ste. Anne Historical and Projected Population
Estimated Population from 1890 to 2100
- JRC (European Commission's Joint Research Centre) work on the GHS built-up grid
- CIESIN (Center for International Earth Science Information Network)
- [Link] Klein Goldewijk, K., Beusen, A., Doelman, J., and Stehfest, E.: Anthropogenic land use estimates for the Holocene – HYDE 3.2, Earth Syst. Sci. Data, 9, 927–953, https://doi.org/10.5194/essd-9-927-2017, 2017.
Price Distribution
Business distribution by price for Ste. Anne
Human Development Index (HDI)
Statistic composite index of life expectancy, education, and per capita income.
Ste. Anne CO2 Emissions
Carbon Dioxide (CO2) Emissions Per Capita in Tonnes Per Year
| Location | CO2 Emissions | CO2 Emissions Per Capita | CO2 Emissions Intensity |
|---|---|---|---|
| Ste. Anne | 80,795 tn | 14.17 tn | 169.5 tons/km² |
| Manitoba | 16,464,729 tn | 12.78 tn | 25.3 tons/km² |
| Canada | 521,999,336 tn | 14.7 tn | 52.9 tons/km² |
| 2013 CO2 emissions (tonnes/year) | 80,795 tn |
| 2013 CO2 emissions (tonnes/year) per capita | 14.17 tn |
| 2013 CO2 emissions intensity (tonnes/km²/year) | 169.5 tons/km² |
Natural Hazards Risk
Relative risk out of 10
| Hazard | Risk Level |
|---|---|
| Drought | Medium (7) |
| Flood | Medium (7) |
* Risk, particularly concerning flood or landslide, may not be for the entire area.
- Dilley, M., R.S. Chen, U. Deichmann, A.L. Lerner-Lam, M. Arnold, J. Agwe, P. Buys, O. Kjekstad, B. Lyon, and G. Yetman. 2005. Natural Disaster Hotspots: A Global Risk Analysis. Washington, D.C.: World Bank. https://doi.org/10.1596/0-8213-5930-4.
- Center for Hazards and Risk Research - CHRR - Columbia University, Center for International Earth Science Information Network - CIESIN - Columbia University, and International Research Institute for Climate and Society - IRI - Columbia University. 2005. Global Drought Hazard Frequency and Distribution. Palisades, NY: NASA Socioeconomic Data and Applications Center (SEDAC). https://doi.org/10.7927/H4VX0DFT.
- Center for Hazards and Risk Research - CHRR - Columbia University, Center for International Earth Science Information Network - CIESIN - Columbia University. 2005. Global Flood Hazard Frequency and Distribution. Palisades, NY: NASA Socioeconomic Data and Applications Center (SEDAC). https://doi.org/10.7927/H4668B3D.
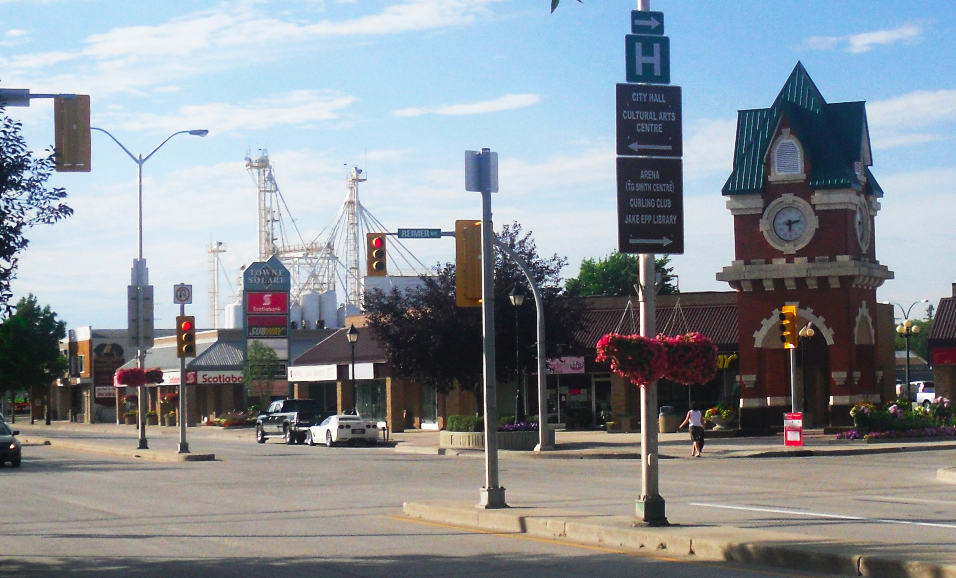
Ste. Anne
Ste. Anne, or Sainte-Anne-des-Chênes, is a town in Manitoba, located about 42 km southeast of Winnipeg. The population at the last census (2011) was 1626. The population was 1524 in 2006, 1513 in 2001 and 1511 in 1996. It is known for being located o..
Ste. Anne Wikipedia Page
About Our Data
The data on this page is estimated using a number of publicly available tools and resources. It is provided without warranty, and could contain inaccuracies. Use at your own risk.