Categories in Dabou
Industries
Business Distribution by Industry in Dabou
| Industry Description | Number of Establishments |
|---|---|
| Restaurants | 32 |
| Education | 26 |
| Churches | 17 |
| Public administration | 14 |
| Hotels and motels | 12 |
| Other accommodation | 11 |
| Apartments | 11 |
| Gas station | 8 |
| Religion | 8 |
| Pharmacies and drug stores | 7 |
| Grocery stores and supermarkets | 7 |
Dabou Facts
| Area | 1236.0 km² |
| Population | 163,159 |
| Male Population | 83,251 (51.0%) |
| Female Population | 79,908 (49.0%) |
| Population change (1975 to 2020) | +71.8% |
| Population change (2000 to 2020) | +8.0% |
| Median Age | 18.8 years (Male: 19.2, Female: 18.4) |
| Local Time | |
| Timezone | Greenwich Mean Time |
| Lat & Lng | 5.32556, -4.37685 |
Map of Dabou
Interactive Map
Dabou Population
Years 1975 to 2020
| Data | 1975 | 1990 | 2000 | 2015 | 2020 |
|---|---|---|---|---|---|
| Population | 94,956 | 134,431 | 151,042 | 150,915 | 163,159 |
| Population Density | 76.8 / km² | 108.8 / km² | 122.2 / km² | 122.1 / km² | 132 / km² |
Dabou Population change from 2000 to 2015
Decrease of 0.1% from year 2000 to 2015
| Location | Change since 1975 | Change since 1990 | Change since 2000 |
|---|---|---|---|
| Dabou | +58.9% | +12.3% | -0.1% |
| Lagunes District | +235.9% | +82.2% | +34.5% |
| Ivory Coast | +244% | +86.7% | +37.5% |
Dabou Median Age
Median Age: 18.8 years
| Location | Median Age | Median Age (Female) | Median Age (Male) |
|---|---|---|---|
| Dabou | 18.8 yrs | 18.4 yrs | 19.2 yrs |
| Lagunes District | 18.8 yrs | 18.4 yrs | 19.2 yrs |
| Ivory Coast | 18.8 yrs | 18.4 yrs | 19.2 yrs |
Dabou Population Density
Population Density: 132 / km²
| Location | Population | Area | Density |
|---|---|---|---|
| Dabou | 163,159 | 1,236 km² | 132 / km² |
| Lagunes District | 5.1 million | 13,592.7 km² | 377 / km² |
| Ivory Coast | 22.7 million | 321,712.8 km² | 70.5 / km² |
Dabou Historical and Projected Population
Estimated Population from 500 to 2100
- JRC (European Commission's Joint Research Centre) work on the GHS built-up grid
- CIESIN (Center for International Earth Science Information Network)
- [Link] Klein Goldewijk, K., Beusen, A., Doelman, J., and Stehfest, E.: Anthropogenic land use estimates for the Holocene – HYDE 3.2, Earth Syst. Sci. Data, 9, 927–953, https://doi.org/10.5194/essd-9-927-2017, 2017.
Area Codes
Percentage Area Codes used by businesses in Dabou
Price Distribution
Business distribution by price for Dabou
Human Development Index (HDI)
Statistic composite index of life expectancy, education, and per capita income.
Ivory Coast CO2 Emissions
Carbon Dioxide (CO2) Emissions Per Capita in Tonnes Per Year
| Location | CO2 Emissions | CO2 Emissions Per Capita | CO2 Emissions Intensity |
|---|---|---|---|
| Ivory Coast | 24,565 tn | 0 tn | 0.1 tons/km² |
| 2013 CO2 emissions (tonnes/year) | 24,565 tn |
| 2013 CO2 emissions (tonnes/year) per capita | 0 tn |
| 2013 CO2 emissions intensity (tonnes/km²/year) | 0.1 tons/km² |
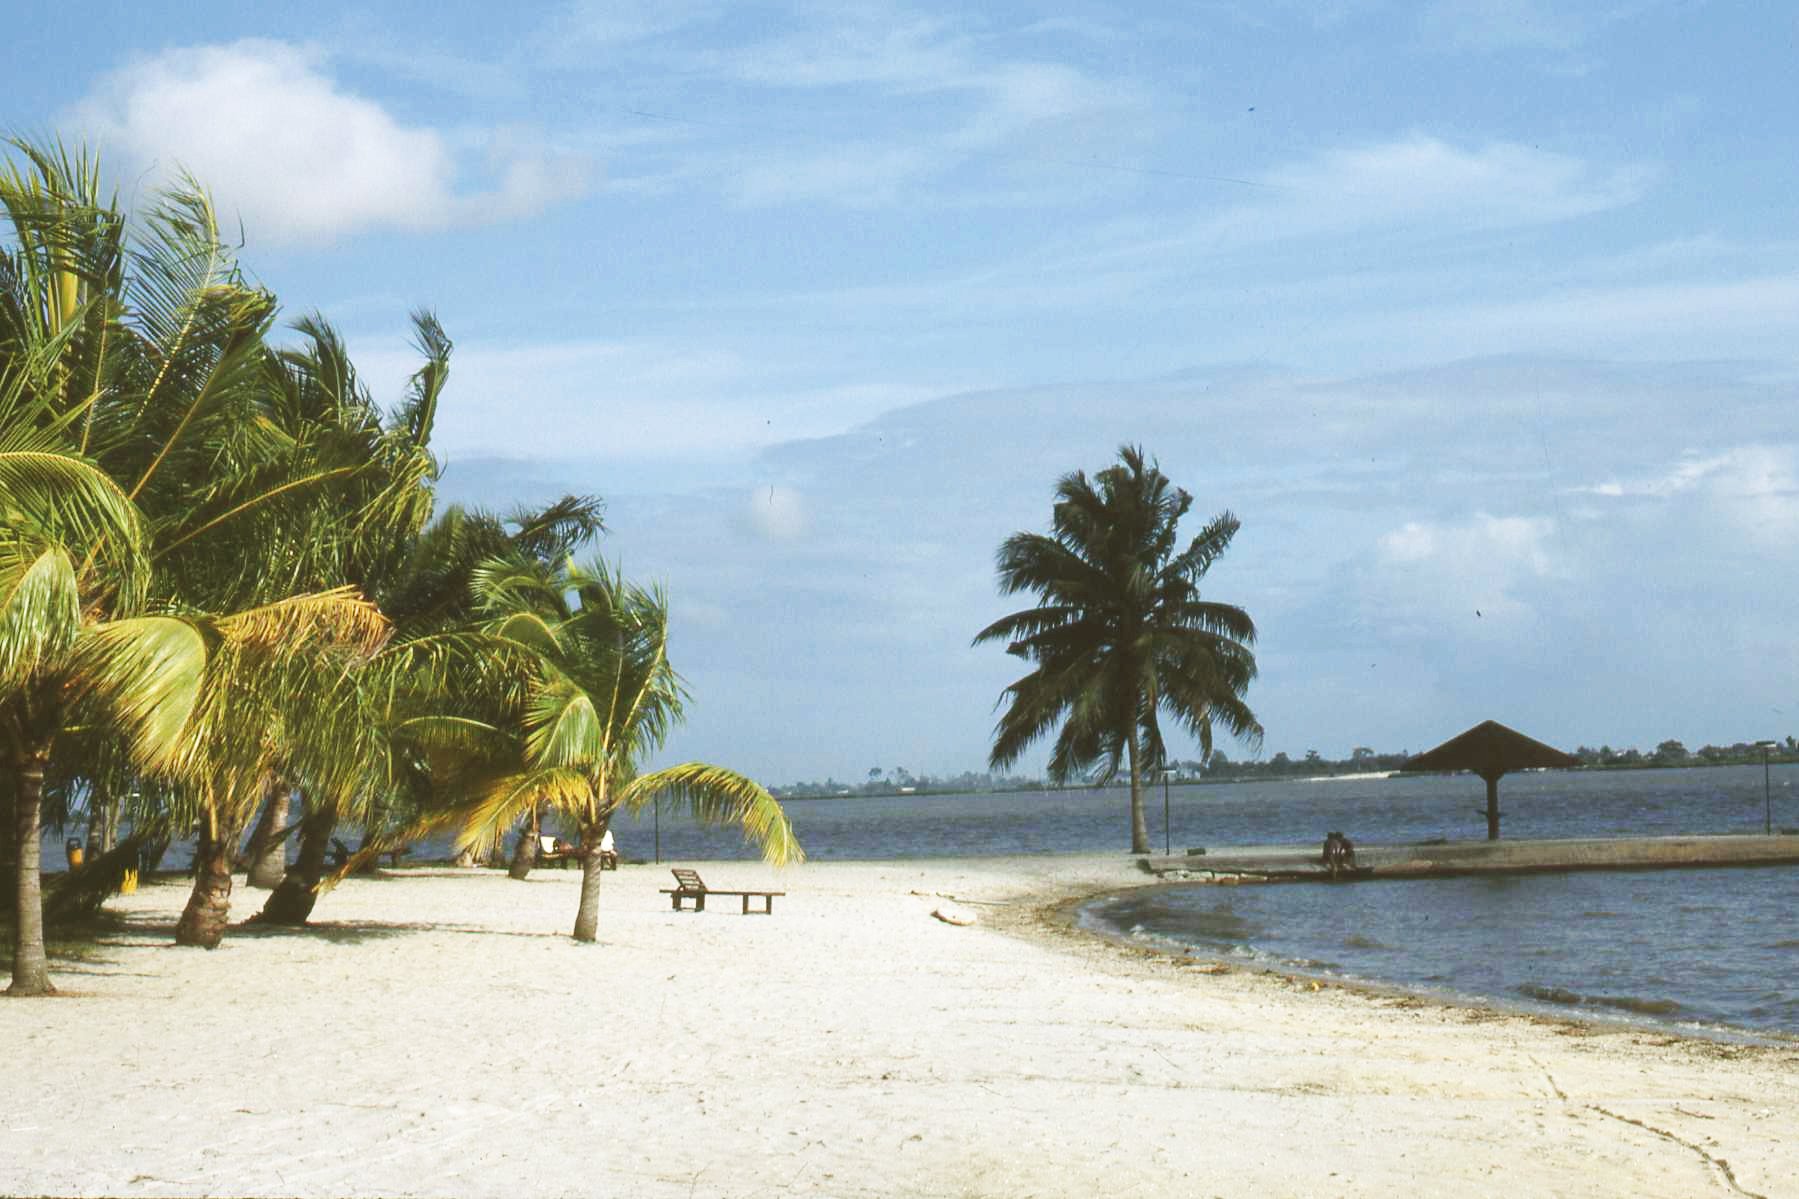
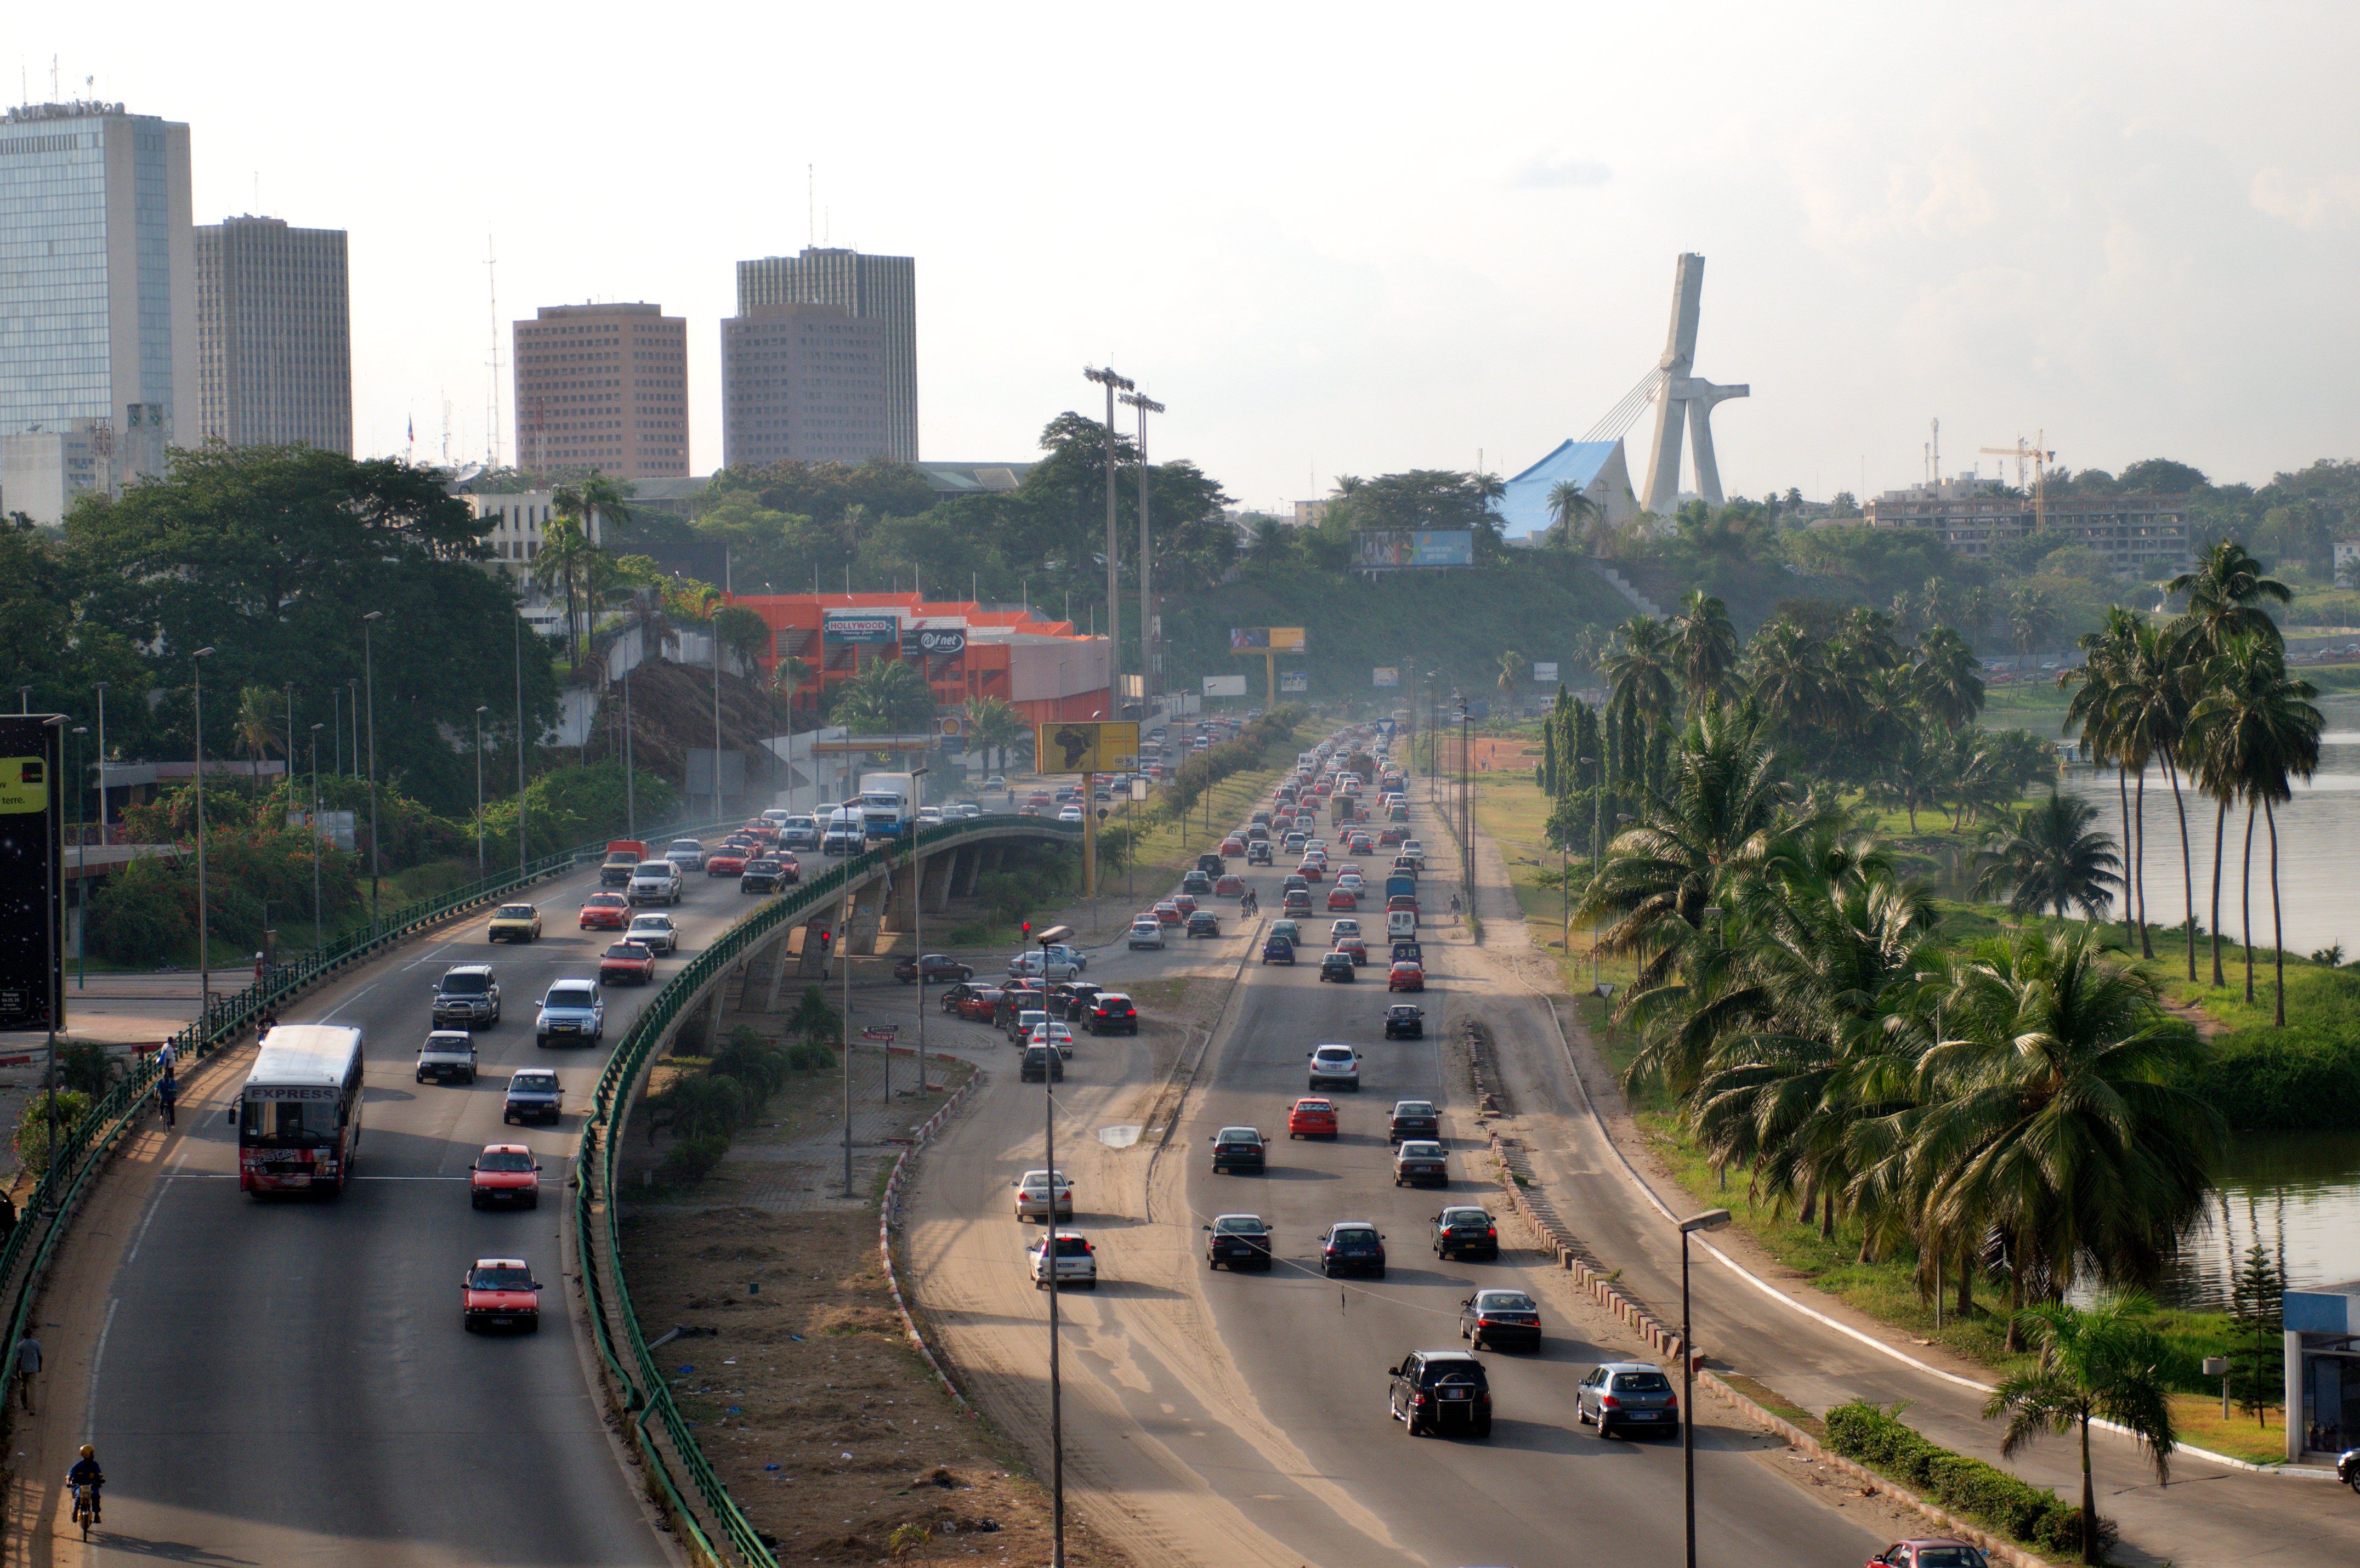
Dabou
Dabou is a port town in southern Ivory Coast. It is the seat of both the Lagunes District and the Grands-Ponts Region. It is also the seat of and a sub-prefecture of the Dabou Department. Dabou is also a commune. town is served by Dabou Airport.
Dabou Wikipedia Page

About Our Data
The data on this page is estimated using a number of publicly available tools and resources. It is provided without warranty, and could contain inaccuracies. Use at your own risk.