Categories in Pucón
Industries
Business Distribution by Industry in Pucón
| Industry Description | Number of Establishments | Average Age of Business |
|---|---|---|
| Other accommodation | 445 | 22 years |
| Restaurants | 271 | — |
| Hotels and motels | 225 | — |
| Shopping | 89 | — |
| Real estate | 81 | — |
| Holiday homes, cabins and resorts | 69 | — |
| Grocery stores and supermarkets | 58 | — |
| Corporate management | 55 | — |
| Travel agencies | 52 | 23 years |
| Travel and transportation | 51 | — |
| Cafes | 44 | — |
Pucón Facts
| Area | 133.3 km² |
| Population | 35,879 |
| Male Population | 18,325 (51.1%) |
| Female Population | 17,554 (48.9%) |
| Population change (1975 to 2020) | +645.0% |
| Population change (2000 to 2020) | +90.2% |
| Median Age | 28.7 years (Male: 28.8, Female: 28.6) |
| Area Codes | 45 |
| Neighborhoods | Pichares, Huife, Pucón, Palguín, Pudahuel |
| Local Time | |
| Timezone | Chile Standard Time |
| Lat & Lng | -39.28223, -71.95427 |
| Postal Codes | 4920000 |
Map of Pucón
Interactive Map
Pucón Population
Years 1975 to 2020
| Data | 1975 | 1990 | 2000 | 2015 | 2020 |
|---|---|---|---|---|---|
| Population | 4,816 | 11,315 | 18,865 | 34,773 | 35,879 |
| Population Density | 36.1 / km² | 84.9 / km² | 141.6 / km² | 261 / km² | 269.3 / km² |
Pucón Population change from 2000 to 2015
Increase of 84.3% from year 2000 to 2015
| Location | Change since 1975 | Change since 1990 | Change since 2000 |
|---|---|---|---|
| Pucón | +622% | +207.3% | +84.3% |
| Araucanía Region | +75.7% | +33.4% | +14.8% |
| Chile | +72.2% | +36.6% | +18.3% |
Pucón Median Age
Median Age: 28.7 years
| Location | Median Age | Median Age (Female) | Median Age (Male) |
|---|---|---|---|
| Pucón | 28.7 yrs | 28.6 yrs | 28.8 yrs |
| Araucanía Region | 30.3 yrs | 31 yrs | 29.7 yrs |
| Chile | 31.3 yrs | 32 yrs | 30.6 yrs |
Pucón Population Density
Population Density: 269 / km²
| Location | Population | Area | Density |
|---|---|---|---|
| Pucón | 35,879 | 133.3 km² | 269 / km² |
| Araucanía Region | 1 million | 31,793.4 km² | 31.5 / km² |
| Chile | 17.8 million | 751,744.8 km² | 23.7 / km² |
Pucón Historical and Projected Population
Estimated Population from 1890 to 2100
- JRC (European Commission's Joint Research Centre) work on the GHS built-up grid
- CIESIN (Center for International Earth Science Information Network)
- [Link] Klein Goldewijk, K., Beusen, A., Doelman, J., and Stehfest, E.: Anthropogenic land use estimates for the Holocene – HYDE 3.2, Earth Syst. Sci. Data, 9, 927–953, https://doi.org/10.5194/essd-9-927-2017, 2017.
Price Distribution
Business distribution by price for Pucón
Human Development Index (HDI)
Statistic composite index of life expectancy, education, and per capita income.
Pucón CO2 Emissions
Carbon Dioxide (CO2) Emissions Per Capita in Tonnes Per Year
| Location | CO2 Emissions | CO2 Emissions Per Capita | CO2 Emissions Intensity |
|---|---|---|---|
| Pucón | 171,136 tn | 4.77 tn | 1,284.3 tons/km² |
| Araucanía Region | 4,403,719 tn | 4.39 tn | 138.5 tons/km² |
| Chile | 87,296,657 tn | 4.91 tn | 116.1 tons/km² |
| 2013 CO2 emissions (tonnes/year) | 171,136 tn |
| 2013 CO2 emissions (tonnes/year) per capita | 4.77 tn |
| 2013 CO2 emissions intensity (tonnes/km²/year) | 1,284.3 tons/km² |
Natural Hazards Risk
Relative risk out of 10
| Hazard | Risk Level |
|---|---|
| Earthquake | Medium (7) |
| Landslide | Medium (7) |
| Volcano | Medium (7) |
* Risk, particularly concerning flood or landslide, may not be for the entire area.
- Dilley, M., R.S. Chen, U. Deichmann, A.L. Lerner-Lam, M. Arnold, J. Agwe, P. Buys, O. Kjekstad, B. Lyon, and G. Yetman. 2005. Natural Disaster Hotspots: A Global Risk Analysis. Washington, D.C.: World Bank. https://doi.org/10.1596/0-8213-5930-4.
- Center for Hazards and Risk Research - CHRR - Columbia University, Center for International Earth Science Information Network - CIESIN - Columbia University, and Norwegian Geotechnical Institute - NGI. 2005. Global Landslide Hazard Distribution. Palisades, NY: NASA Socioeconomic Data and Applications Center (SEDAC). https://doi.org/10.7927/H4P848VZ.
- Center for Hazards and Risk Research - CHRR - Columbia University, Center for International Earth Science Information Network - CIESIN - Columbia University. 2005. Global Volcano Hazard Frequency and Distribution. Palisades, NY: NASA Socioeconomic Data and Applications Center (SEDAC). https://doi.org/10.7927/H4BR8Q45.
- Center for Hazards and Risk Research - CHRR - Columbia University, Center for International Earth Science Information Network - CIESIN - Columbia University. 2005. Global Earthquake Hazard Distribution - Peak Ground Acceleration. Palisades, NY: NASA Socioeconomic Data and Applications Center (SEDAC). https://doi.org/10.7927/H4BZ63ZS.
Recent Nearby Earthquakes
Magnitude 3.0 and greater
| Date▼ | Time↕ | Magnitude↕ | Distance↕ | Depth↕ | Location↕ | Link |
|---|---|---|---|---|---|---|
| 8/13/19 | 7:46 AM | 4.3 | 99.6 km | 132,100 m | 61km SSE of Panguipulli, Chile | usgs.gov |
| 6/8/19 | 1:44 PM | 4.7 | 34 km | 89,330 m | 11km WSW of Villarrica, Chile | usgs.gov |
| 3/25/19 | 4:32 PM | 4.1 | 52.6 km | 95,920 m | 19km SE of Loncoche, Chile | usgs.gov |
| 11/26/18 | 2:12 PM | 4.6 | 78.5 km | 159,810 m | 31km WNW of Junin de los Andes, Argentina | usgs.gov |
| 10/17/18 | 10:34 AM | 4.4 | 69.3 km | 151,980 m | 44km NW of San Martin de los Andes, Argentina | usgs.gov |
| 9/4/18 | 12:20 AM | 4.7 | 63.5 km | 140,010 m | 47km NNW of San Martin de los Andes, Argentina | usgs.gov |
| 6/23/17 | 10:00 AM | 5 | 17.3 km | 115,450 m | 17km SE of Pucon, Chile | usgs.gov |
| 3/4/16 | 11:50 PM | 4.1 | 62.6 km | 106,560 m | 51km ESE of Vilcun, Chile | usgs.gov |
| 12/29/15 | 5:39 AM | 4.2 | 79.7 km | 62,100 m | 33km SSW of Loncoche, Chile | usgs.gov |
| 10/25/15 | 3:37 PM | 4.3 | 60.4 km | 78,750 m | 9km S of Loncoche, Chile | usgs.gov |
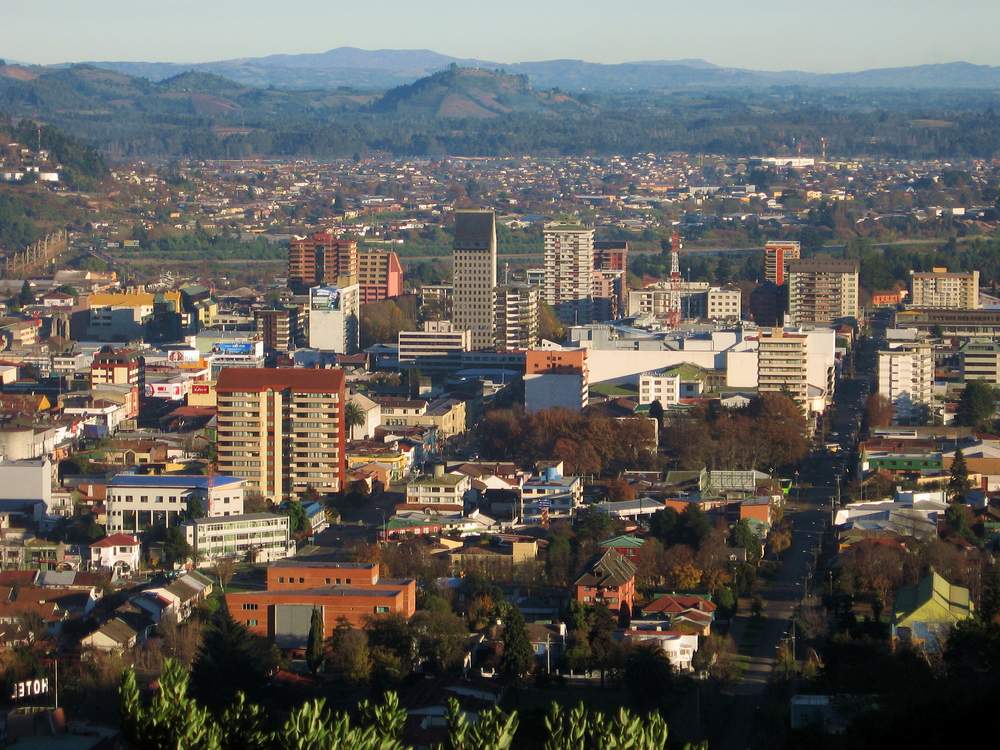
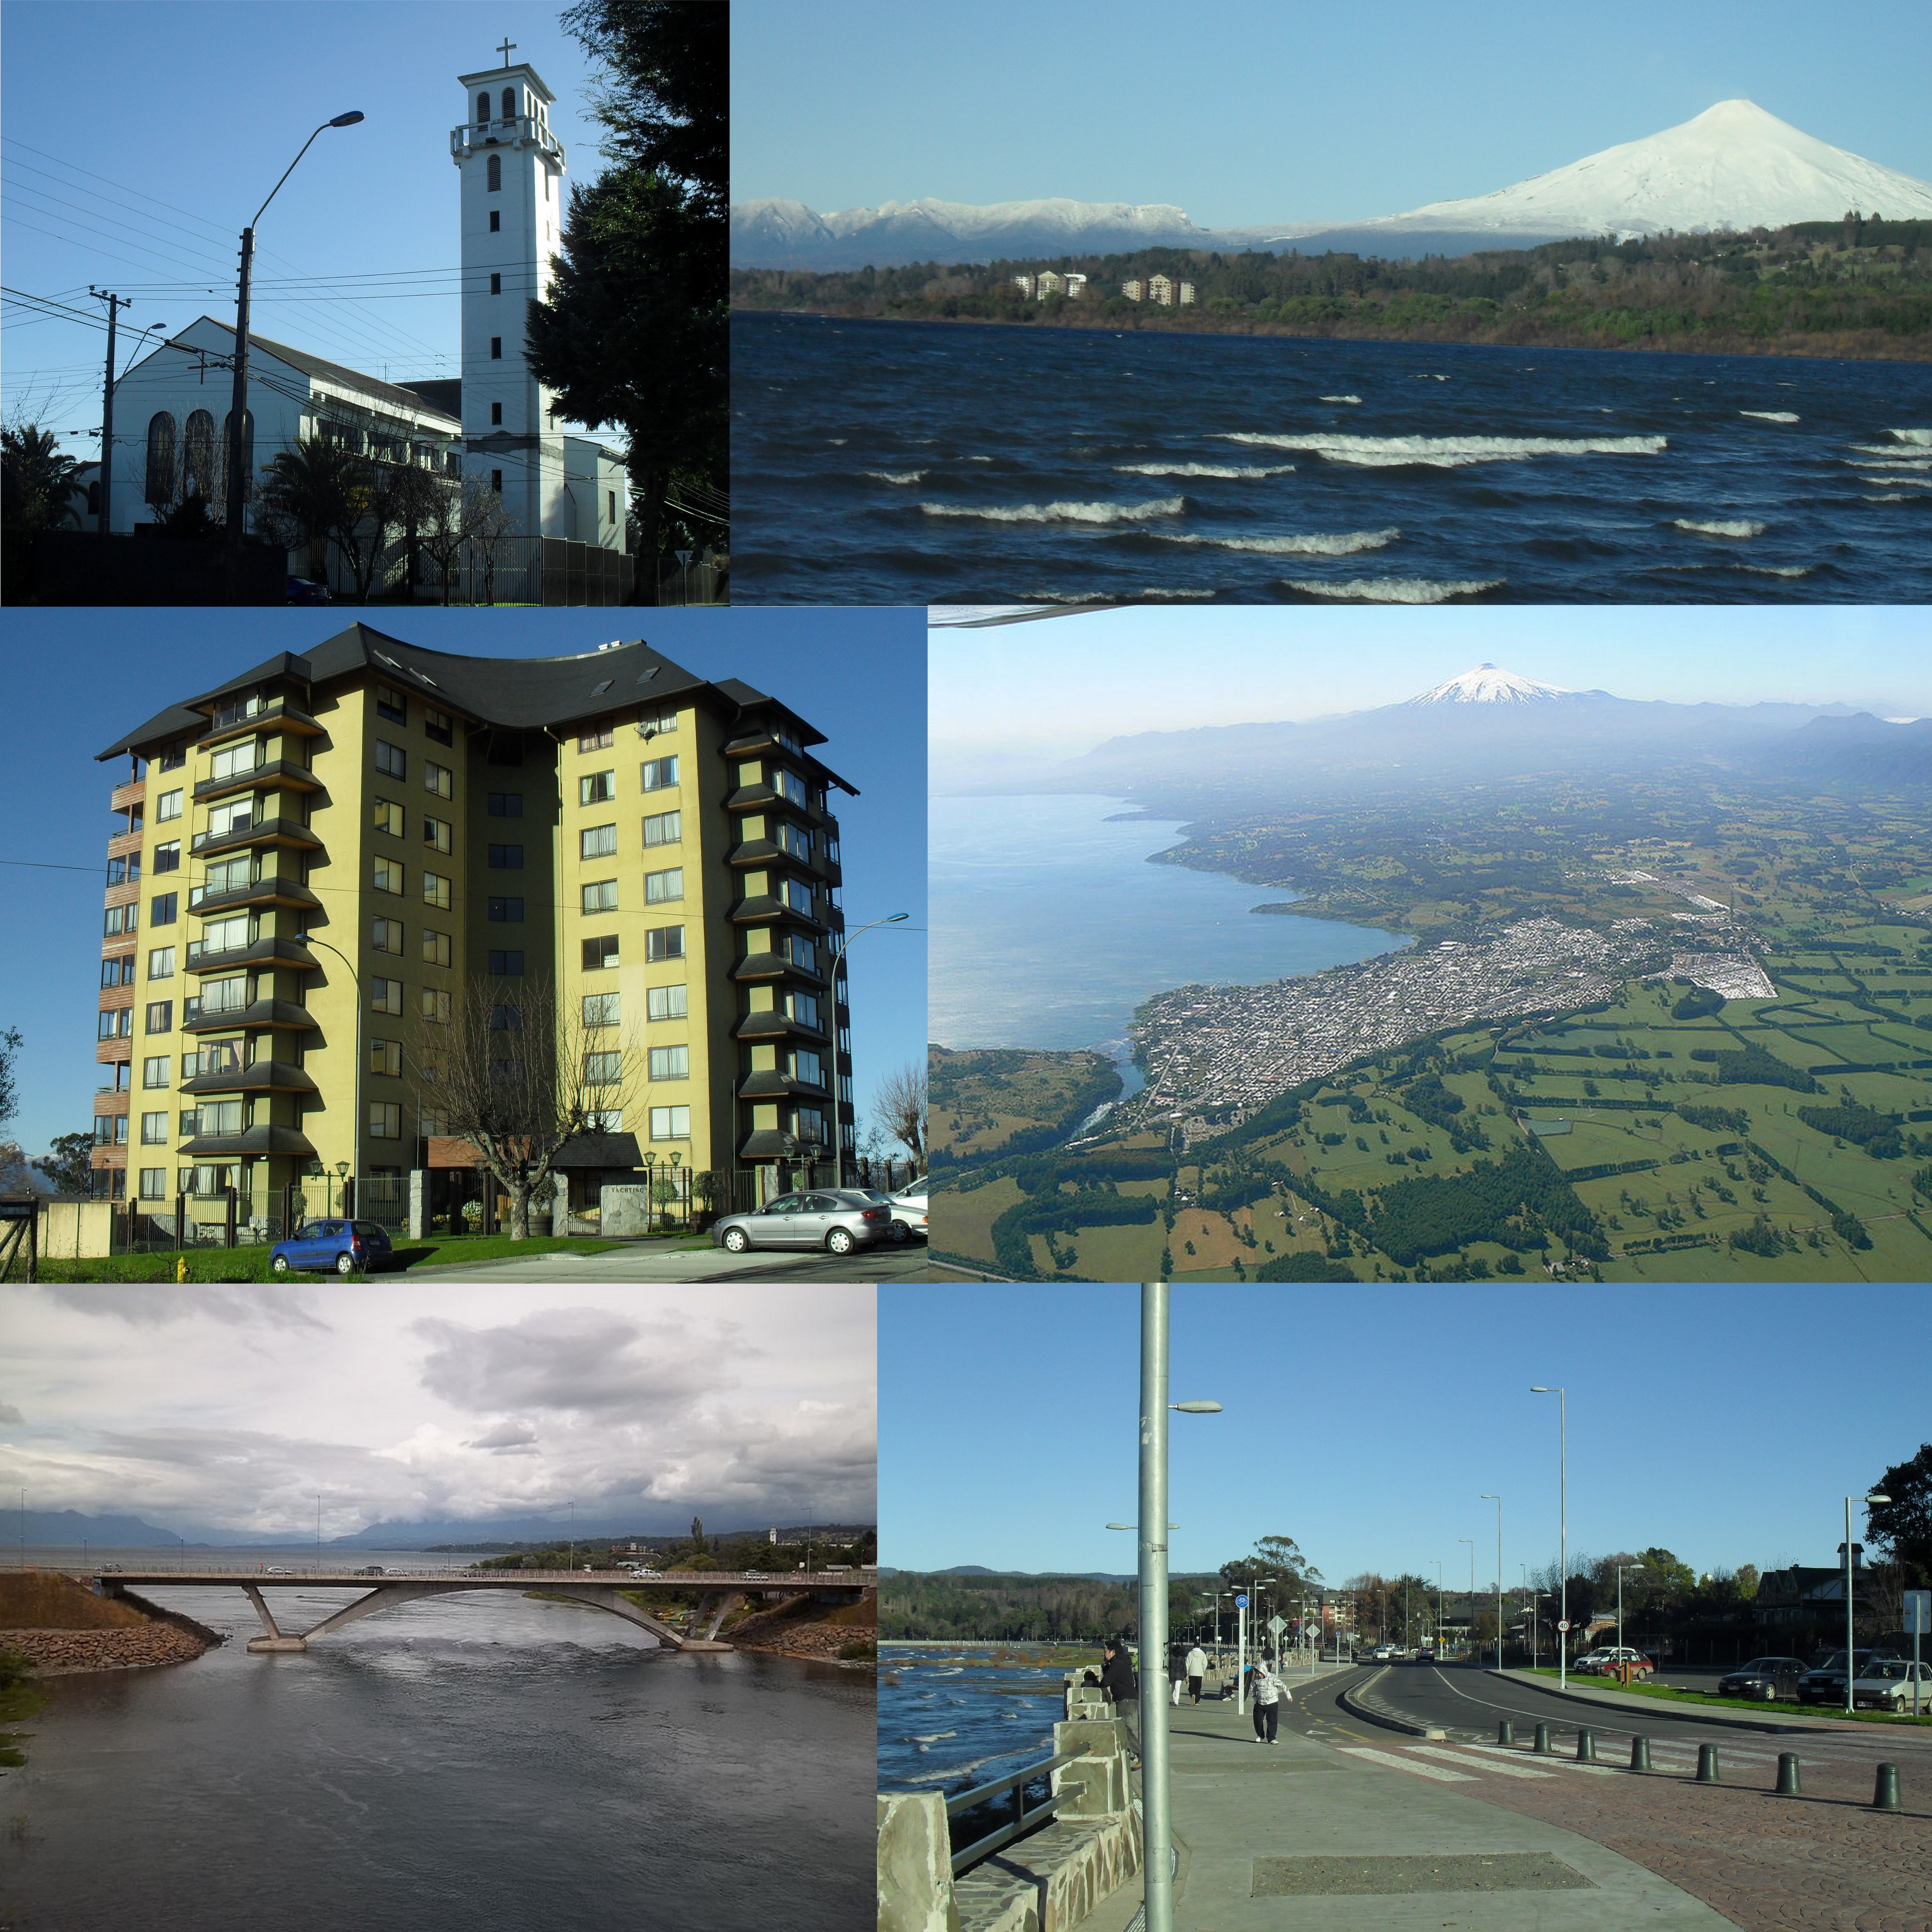
Pucón
Pucón (Mapudungun: "entrance to the cordillera") is a Chilean city and commune administered by the municipality of Pucón. It is located in the Province of Cautín, Araucanía Region, 100 km to the southeast of Temuco and 780 km to the south of Santiago..
Pucón Wikipedia Page

About Our Data
The data on this page is estimated using a number of publicly available tools and resources. It is provided without warranty, and could contain inaccuracies. Use at your own risk.