Categories in Envigado
Industries
Business Distribution by Industry in Envigado
| Industry Description | Number of Establishments | Average Age of Business |
|---|---|---|
| Restaurants | 2,031 | 16 years |
| Shopping | 1,432 | 29 years |
| Real estate | 896 | — |
| Clothing stores | 842 | — |
| Grocery stores and supermarkets | 737 | — |
| All food and beverage | 672 | — |
| Beauty salons | 516 | — |
| Corporate management | 441 | 27 years |
| Apartments | 430 | — |
| Pharmacies and drug stores | 386 | — |
| Bars, pubs and taverns | 344 | — |
| Technical construction services | 278 | — |
Envigado Facts
| Area | 38.6 km² |
| Population | 209,771 |
| Male Population | 102,766 (49.0%) |
| Female Population | 107,005 (51.0%) |
| Population change (1975 to 2020) | +128.0% |
| Population change (2000 to 2020) | +24.1% |
| Median Age | 26.5 years (Male: 25.5, Female: 27.6) |
| Neighborhoods | Centro, Las Vegas, Mesa, La Magnolia, Alcalá |
| Local Time | |
| Timezone | Colombia Standard Time |
| Lat & Lng | 6.17591, -75.59174 |
| Postal Codes | 055420, 055421, 055422, 055427, 055428 |
Map of Envigado
Interactive Map
Envigado Population
Years 1975 to 2020
| Data | 1975 | 1990 | 2000 | 2015 | 2020 |
|---|---|---|---|---|---|
| Population | 91,989 | 140,187 | 169,070 | 196,328 | 209,771 |
| Population Density | 2,381.6 / km² | 3,629.4 / km² | 4,377.2 / km² | 5,082.9 / km² | 5,431 / km² |
Envigado Population change from 2000 to 2015
Increase of 16.1% from year 2000 to 2015
| Location | Change since 1975 | Change since 1990 | Change since 2000 |
|---|---|---|---|
| Envigado | +113.4% | +40% | +16.1% |
| Antioquia Department | +113.1% | +39.9% | +16.4% |
| Colombia | +94.6% | +40.7% | +19.4% |
Envigado Median Age
Median Age: 26.5 years
| Location | Median Age | Median Age (Female) | Median Age (Male) |
|---|---|---|---|
| Envigado | 26.5 yrs | 27.6 yrs | 25.5 yrs |
| Antioquia Department | 26.5 yrs | 27.5 yrs | 25.5 yrs |
| Colombia | 24.9 yrs | 25.8 yrs | 24.1 yrs |
Envigado Population Density
Population Density: 5,431 / km²
| Location | Population | Area | Density |
|---|---|---|---|
| Envigado | 209,771 | 38.6 km² | 5,431 / km² |
| Antioquia Department | 6.2 million | 63,141.8 km² | 98.3 / km² |
| Colombia | 47.8 million | 1,136,620.4 km² | 42.1 / km² |
Envigado Historical and Projected Population
Estimated Population from 1890 to 2100
- JRC (European Commission's Joint Research Centre) work on the GHS built-up grid
- CIESIN (Center for International Earth Science Information Network)
- [Link] Klein Goldewijk, K., Beusen, A., Doelman, J., and Stehfest, E.: Anthropogenic land use estimates for the Holocene – HYDE 3.2, Earth Syst. Sci. Data, 9, 927–953, https://doi.org/10.5194/essd-9-927-2017, 2017.
Neighborhoods in Envigado
Percentage of businesses by neighborhood in Envigado
Price Distribution
Business distribution by price for Envigado
Human Development Index (HDI)
Statistic composite index of life expectancy, education, and per capita income.
Envigado CO2 Emissions
Carbon Dioxide (CO2) Emissions Per Capita in Tonnes Per Year
| Location | CO2 Emissions | CO2 Emissions Per Capita | CO2 Emissions Intensity |
|---|---|---|---|
| Envigado | 622,472 tn | 2.97 tn | 16,115.8 tons/km² |
| Antioquia Department | 18,178,412 tn | 2.93 tn | 287.9 tons/km² |
| Colombia | 116,035,326 tn | 2.43 tn | 102.1 tons/km² |
| 2013 CO2 emissions (tonnes/year) | 622,472 tn |
| 2013 CO2 emissions (tonnes/year) per capita | 2.97 tn |
| 2013 CO2 emissions intensity (tonnes/km²/year) | 16,115.8 tons/km² |
Natural Hazards Risk
Relative risk out of 10
| Hazard | Risk Level |
|---|---|
| Drought | Medium (7) |
| Flood | High (10) |
| Earthquake | Medium (7) |
| Landslide | Medium (6) |
* Risk, particularly concerning flood or landslide, may not be for the entire area.
- Dilley, M., R.S. Chen, U. Deichmann, A.L. Lerner-Lam, M. Arnold, J. Agwe, P. Buys, O. Kjekstad, B. Lyon, and G. Yetman. 2005. Natural Disaster Hotspots: A Global Risk Analysis. Washington, D.C.: World Bank. https://doi.org/10.1596/0-8213-5930-4.
- Center for Hazards and Risk Research - CHRR - Columbia University, Center for International Earth Science Information Network - CIESIN - Columbia University, and Norwegian Geotechnical Institute - NGI. 2005. Global Landslide Hazard Distribution. Palisades, NY: NASA Socioeconomic Data and Applications Center (SEDAC). https://doi.org/10.7927/H4P848VZ.
- Center for Hazards and Risk Research - CHRR - Columbia University, Center for International Earth Science Information Network - CIESIN - Columbia University, and International Research Institute for Climate and Society - IRI - Columbia University. 2005. Global Drought Hazard Frequency and Distribution. Palisades, NY: NASA Socioeconomic Data and Applications Center (SEDAC). https://doi.org/10.7927/H4VX0DFT.
- Center for Hazards and Risk Research - CHRR - Columbia University, Center for International Earth Science Information Network - CIESIN - Columbia University. 2005. Global Flood Hazard Frequency and Distribution. Palisades, NY: NASA Socioeconomic Data and Applications Center (SEDAC). https://doi.org/10.7927/H4668B3D.
- Center for Hazards and Risk Research - CHRR - Columbia University, Center for International Earth Science Information Network - CIESIN - Columbia University. 2005. Global Earthquake Hazard Distribution - Peak Ground Acceleration. Palisades, NY: NASA Socioeconomic Data and Applications Center (SEDAC). https://doi.org/10.7927/H4BZ63ZS.
Recent Nearby Earthquakes
Magnitude 3.0 and greater
| Date▼ | Time↕ | Magnitude↕ | Distance↕ | Depth↕ | Location↕ | Link |
|---|---|---|---|---|---|---|
| 2/14/19 | 9:09 PM | 4.5 | 79.1 km | 68,110 m | 18km WSW of Betania, Colombia | usgs.gov |
| 1/19/17 | 12:01 PM | 4.7 | 68.6 km | 64,450 m | 14km WNW of Ciudad Bolivar, Colombia | usgs.gov |
| 11/30/16 | 5:42 PM | 3.6 | 32.7 km | 28,000 m | 10km WSW of Ebejico, Colombia | usgs.gov |
| 1/10/16 | 10:33 AM | 4.4 | 98.4 km | 45,070 m | 36km NE of Quibdo, Colombia | usgs.gov |
| 5/14/14 | 7:05 PM | 4.2 | 76.6 km | 71,310 m | 12km SSW of Yarumal, Colombia | usgs.gov |
| 4/17/14 | 6:12 PM | 4.5 | 98.5 km | 44,930 m | 37km WNW of Urrao, Colombia | usgs.gov |
| 7/6/11 | 4:16 AM | 4.7 | 78.6 km | 36,000 m | Colombia | usgs.gov |
| 7/31/09 | 2:02 AM | 4.1 | 95.9 km | 0 m | northern Colombia | usgs.gov |
| 1/13/09 | 7:47 PM | 4.7 | 74.9 km | 58,400 m | Colombia | usgs.gov |
| 1/2/08 | 1:27 AM | 3.8 | 98.1 km | 68,100 m | northern Colombia | usgs.gov |
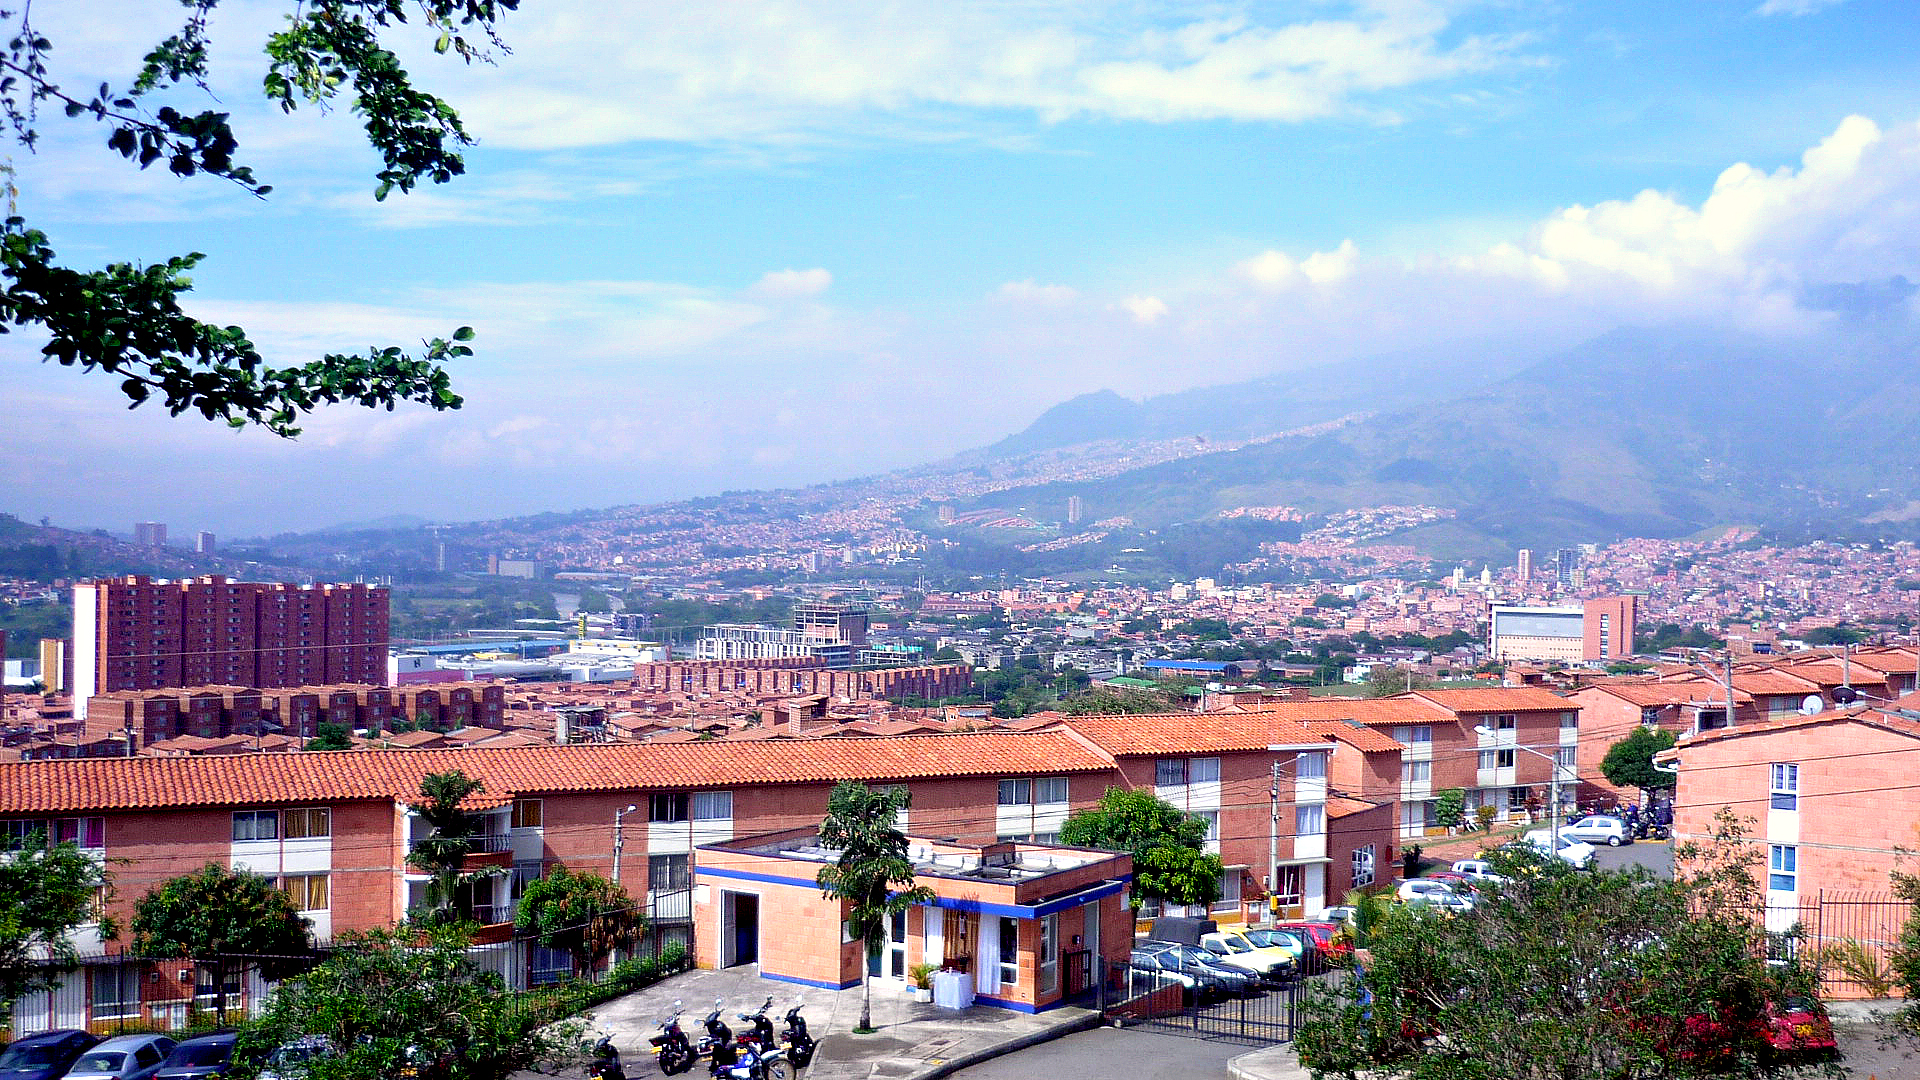
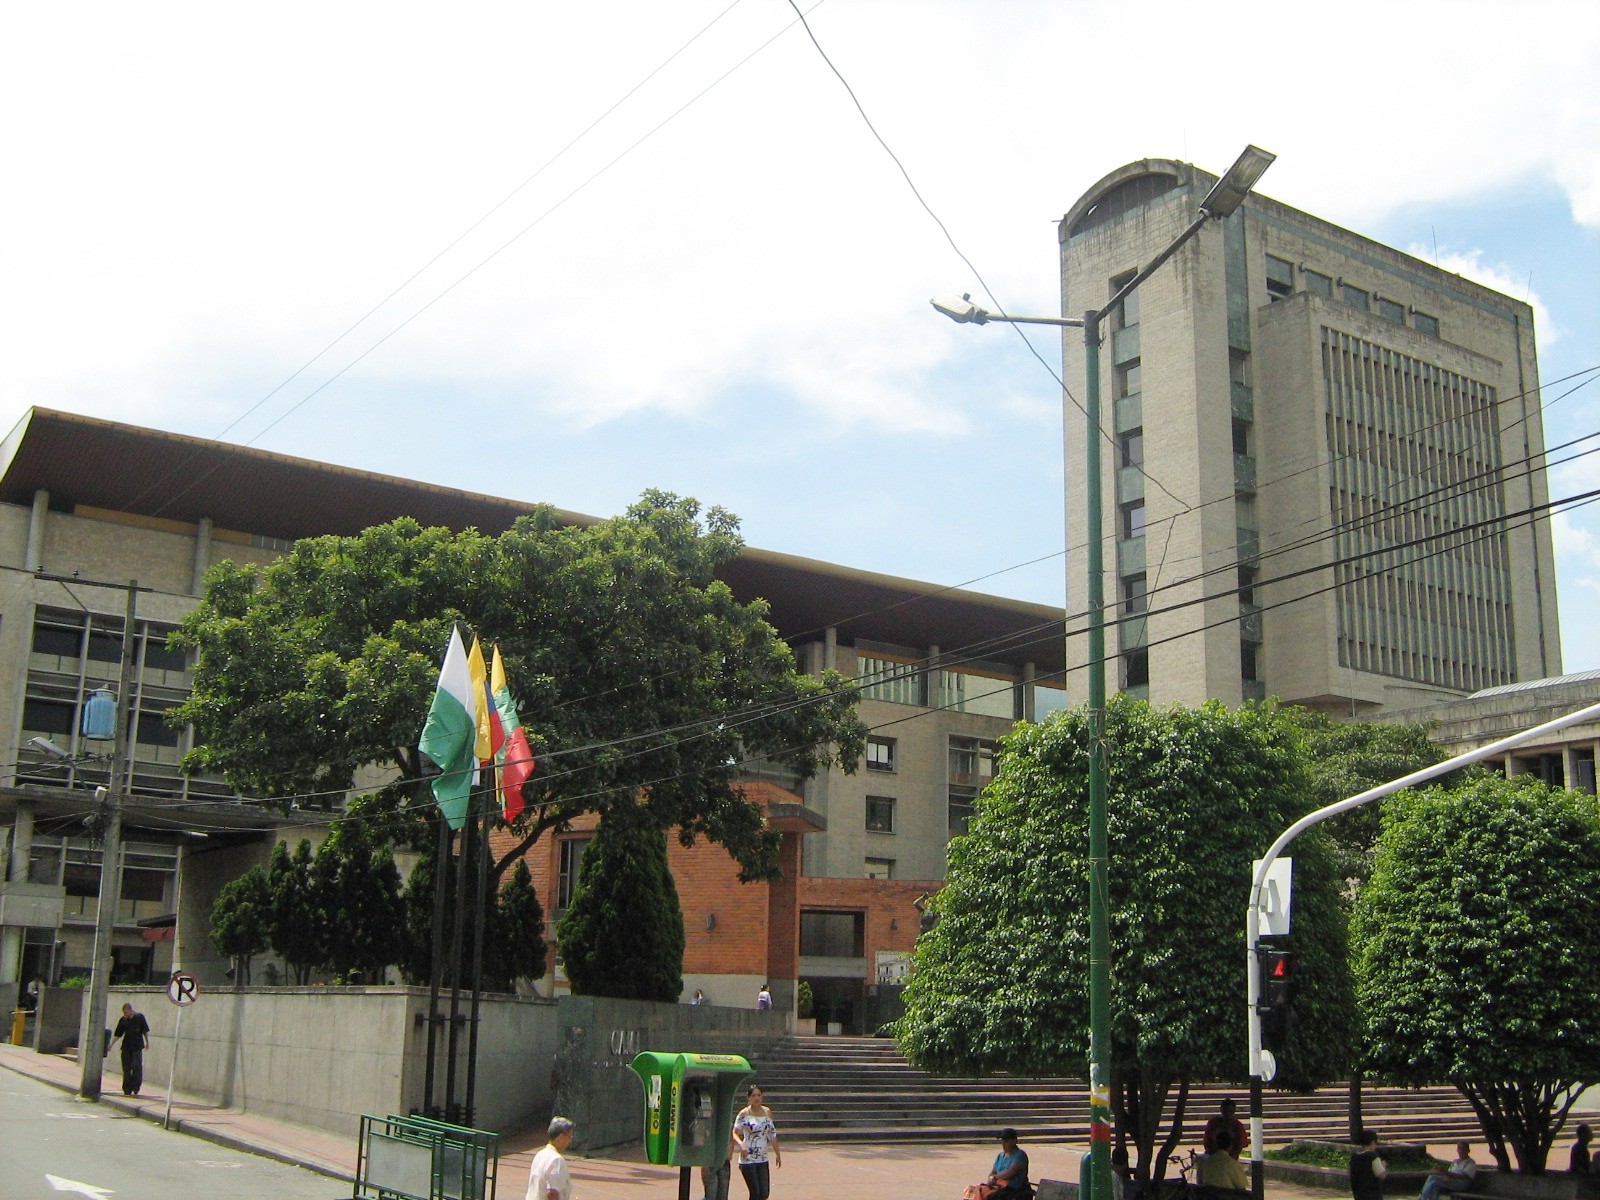
Envigado
Envigado (Spanish pronunciation: [embiˈɣaðo]) is a city of Colombia in the department of Antioquia, located at the south of the Aburrá Valley and belonging to The Metropolitan Area of the Aburrá Valley. It has limits at its north with El Poblado, Med..
Envigado Wikipedia Page

About Our Data
The data on this page is estimated using a number of publicly available tools and resources. It is provided without warranty, and could contain inaccuracies. Use at your own risk.