Categories in Soacha
Industries
Business Distribution by Industry in Soacha
| Industry Description | Number of Establishments | Average Age of Business |
|---|---|---|
| Shopping | 2,856 | 20 years |
| Restaurants | 2,223 | — |
| All food and beverage | 1,134 | — |
| Clothing stores | 946 | 16 years |
| Grocery stores and supermarkets | 871 | — |
| Education | 772 | 31 years |
| Car repair | 729 | — |
| Pharmacies and drug stores | 691 | — |
| Secondary education | 666 | — |
| Hardware store | 659 | — |
| Bakeries | 549 | — |
| Beauty salons | 504 | — |
| Bars, pubs and taverns | 392 | — |
Soacha Facts
| Area | 156.6 km² |
| Population | 615,500 |
| Male Population | 307,153 (49.9%) |
| Female Population | 308,347 (50.1%) |
| Population change (1975 to 2020) | +509.5% |
| Population change (2000 to 2020) | +81.2% |
| Median Age | 25.3 years (Male: 24.6, Female: 25.9) |
| Neighborhoods | Bochica, San Mateo, Ciudad Verde, El Rincon de Santa Fe, Leon XIII |
| Local Time | |
| Timezone | Colombia Standard Time |
| Lat & Lng | 4.57937, -74.21682 |
| Postal Codes | 110731, 110741, 250051, 250052, 250053, More |
Map of Soacha
Interactive Map
Soacha Population
Years 1975 to 2020
| Data | 1975 | 1990 | 2000 | 2015 | 2020 |
|---|---|---|---|---|---|
| Population | 100,987 | 221,823 | 339,647 | 574,315 | 615,500 |
| Population Density | 645 / km² | 1,416.8 / km² | 2,169.4 / km² | 3,668.3 / km² | 3,931.3 / km² |
Soacha Population change from 2000 to 2015
Increase of 69.1% from year 2000 to 2015
| Location | Change since 1975 | Change since 1990 | Change since 2000 |
|---|---|---|---|
| Soacha | +468.7% | +158.9% | +69.1% |
| Cundinamarca Department | +127.3% | +64.3% | +34.5% |
| Colombia | +94.6% | +40.7% | +19.4% |
Soacha Median Age
Median Age: 25.3 years
| Location | Median Age | Median Age (Female) | Median Age (Male) |
|---|---|---|---|
| Soacha | 25.3 yrs | 25.9 yrs | 24.6 yrs |
| Cundinamarca Department | 25.2 yrs | 25.9 yrs | 24.6 yrs |
| Colombia | 24.9 yrs | 25.8 yrs | 24.1 yrs |
Soacha Population Density
Population Density: 3,931 / km²
| Location | Population | Area | Density |
|---|---|---|---|
| Soacha | 615,500 | 156.6 km² | 3,931 / km² |
| Cundinamarca Department | 2.9 million | 22,383.4 km² | 127 / km² |
| Colombia | 47.8 million | 1,136,620.4 km² | 42.1 / km² |
Soacha Historical and Projected Population
Estimated Population from 1900 to 2100
- JRC (European Commission's Joint Research Centre) work on the GHS built-up grid
- CIESIN (Center for International Earth Science Information Network)
- [Link] Klein Goldewijk, K., Beusen, A., Doelman, J., and Stehfest, E.: Anthropogenic land use estimates for the Holocene – HYDE 3.2, Earth Syst. Sci. Data, 9, 927–953, https://doi.org/10.5194/essd-9-927-2017, 2017.
Neighborhoods in Soacha
Percentage of businesses by neighborhood in Soacha
Area Codes
Percentage Area Codes used by businesses in Soacha
Price Distribution
Business distribution by price for Soacha
Human Development Index (HDI)
Statistic composite index of life expectancy, education, and per capita income.
Soacha CO2 Emissions
Carbon Dioxide (CO2) Emissions Per Capita in Tonnes Per Year
| Location | CO2 Emissions | CO2 Emissions Per Capita | CO2 Emissions Intensity |
|---|---|---|---|
| Soacha | 1,729,322 tn | 2.81 tn | 11,045.6 tons/km² |
| Cundinamarca Department | 7,890,605 tn | 2.77 tn | 352.5 tons/km² |
| Colombia | 116,035,326 tn | 2.43 tn | 102.1 tons/km² |
| 2013 CO2 emissions (tonnes/year) | 1,729,322 tn |
| 2013 CO2 emissions (tonnes/year) per capita | 2.81 tn |
| 2013 CO2 emissions intensity (tonnes/km²/year) | 11,045.6 tons/km² |
Natural Hazards Risk
Relative risk out of 10
| Hazard | Risk Level |
|---|---|
| Drought | Medium (5) |
| Flood | High (9) |
| Earthquake | High (7.8) |
| Landslide | High (8) |
* Risk, particularly concerning flood or landslide, may not be for the entire area.
- Dilley, M., R.S. Chen, U. Deichmann, A.L. Lerner-Lam, M. Arnold, J. Agwe, P. Buys, O. Kjekstad, B. Lyon, and G. Yetman. 2005. Natural Disaster Hotspots: A Global Risk Analysis. Washington, D.C.: World Bank. https://doi.org/10.1596/0-8213-5930-4.
- Center for Hazards and Risk Research - CHRR - Columbia University, Center for International Earth Science Information Network - CIESIN - Columbia University, and Norwegian Geotechnical Institute - NGI. 2005. Global Landslide Hazard Distribution. Palisades, NY: NASA Socioeconomic Data and Applications Center (SEDAC). https://doi.org/10.7927/H4P848VZ.
- Center for Hazards and Risk Research - CHRR - Columbia University, Center for International Earth Science Information Network - CIESIN - Columbia University, and International Research Institute for Climate and Society - IRI - Columbia University. 2005. Global Drought Hazard Frequency and Distribution. Palisades, NY: NASA Socioeconomic Data and Applications Center (SEDAC). https://doi.org/10.7927/H4VX0DFT.
- Center for Hazards and Risk Research - CHRR - Columbia University, Center for International Earth Science Information Network - CIESIN - Columbia University. 2005. Global Flood Hazard Frequency and Distribution. Palisades, NY: NASA Socioeconomic Data and Applications Center (SEDAC). https://doi.org/10.7927/H4668B3D.
- Center for Hazards and Risk Research - CHRR - Columbia University, Center for International Earth Science Information Network - CIESIN - Columbia University. 2005. Global Earthquake Hazard Distribution - Peak Ground Acceleration. Palisades, NY: NASA Socioeconomic Data and Applications Center (SEDAC). https://doi.org/10.7927/H4BZ63ZS.
Recent Nearby Earthquakes
Magnitude 3.0 and greater
| Date▼ | Time↕ | Magnitude↕ | Distance↕ | Depth↕ | Location↕ | Link |
|---|---|---|---|---|---|---|
| 5/12/19 | 7:28 AM | 4.5 | 80.3 km | 10,000 m | 15km WNW of Guamal, Colombia | usgs.gov |
| 4/17/19 | 10:23 AM | 4.2 | 99.9 km | 158,210 m | 2km N of Villapinzon, Colombia | usgs.gov |
| 12/20/18 | 9:16 AM | 4.5 | 93.7 km | 10,000 m | 5km NNW of Medina, Colombia | usgs.gov |
| 7/24/18 | 8:15 PM | 4.3 | 71.1 km | 49,030 m | 11km W of Restrepo, Colombia | usgs.gov |
| 7/30/17 | 5:40 AM | 4.7 | 92.1 km | 10,000 m | 10km SE of Libano, Colombia | usgs.gov |
| 1/21/17 | 6:34 AM | 4 | 14.1 km | 31,990 m | 10km NW of Chipaque, Colombia | usgs.gov |
| 6/12/14 | 6:30 AM | 4.2 | 53.1 km | 42,390 m | 8km W of Guayabetal, Colombia | usgs.gov |
| 5/30/12 | 12:57 AM | 4.2 | 95.6 km | 156,300 m | Colombia | usgs.gov |
| 2/8/12 | 9:38 AM | 3.9 | 92.9 km | 16,000 m | Colombia | usgs.gov |
| 1/27/11 | 2:06 PM | 3.9 | 63.1 km | 4,000 m | Colombia | usgs.gov |
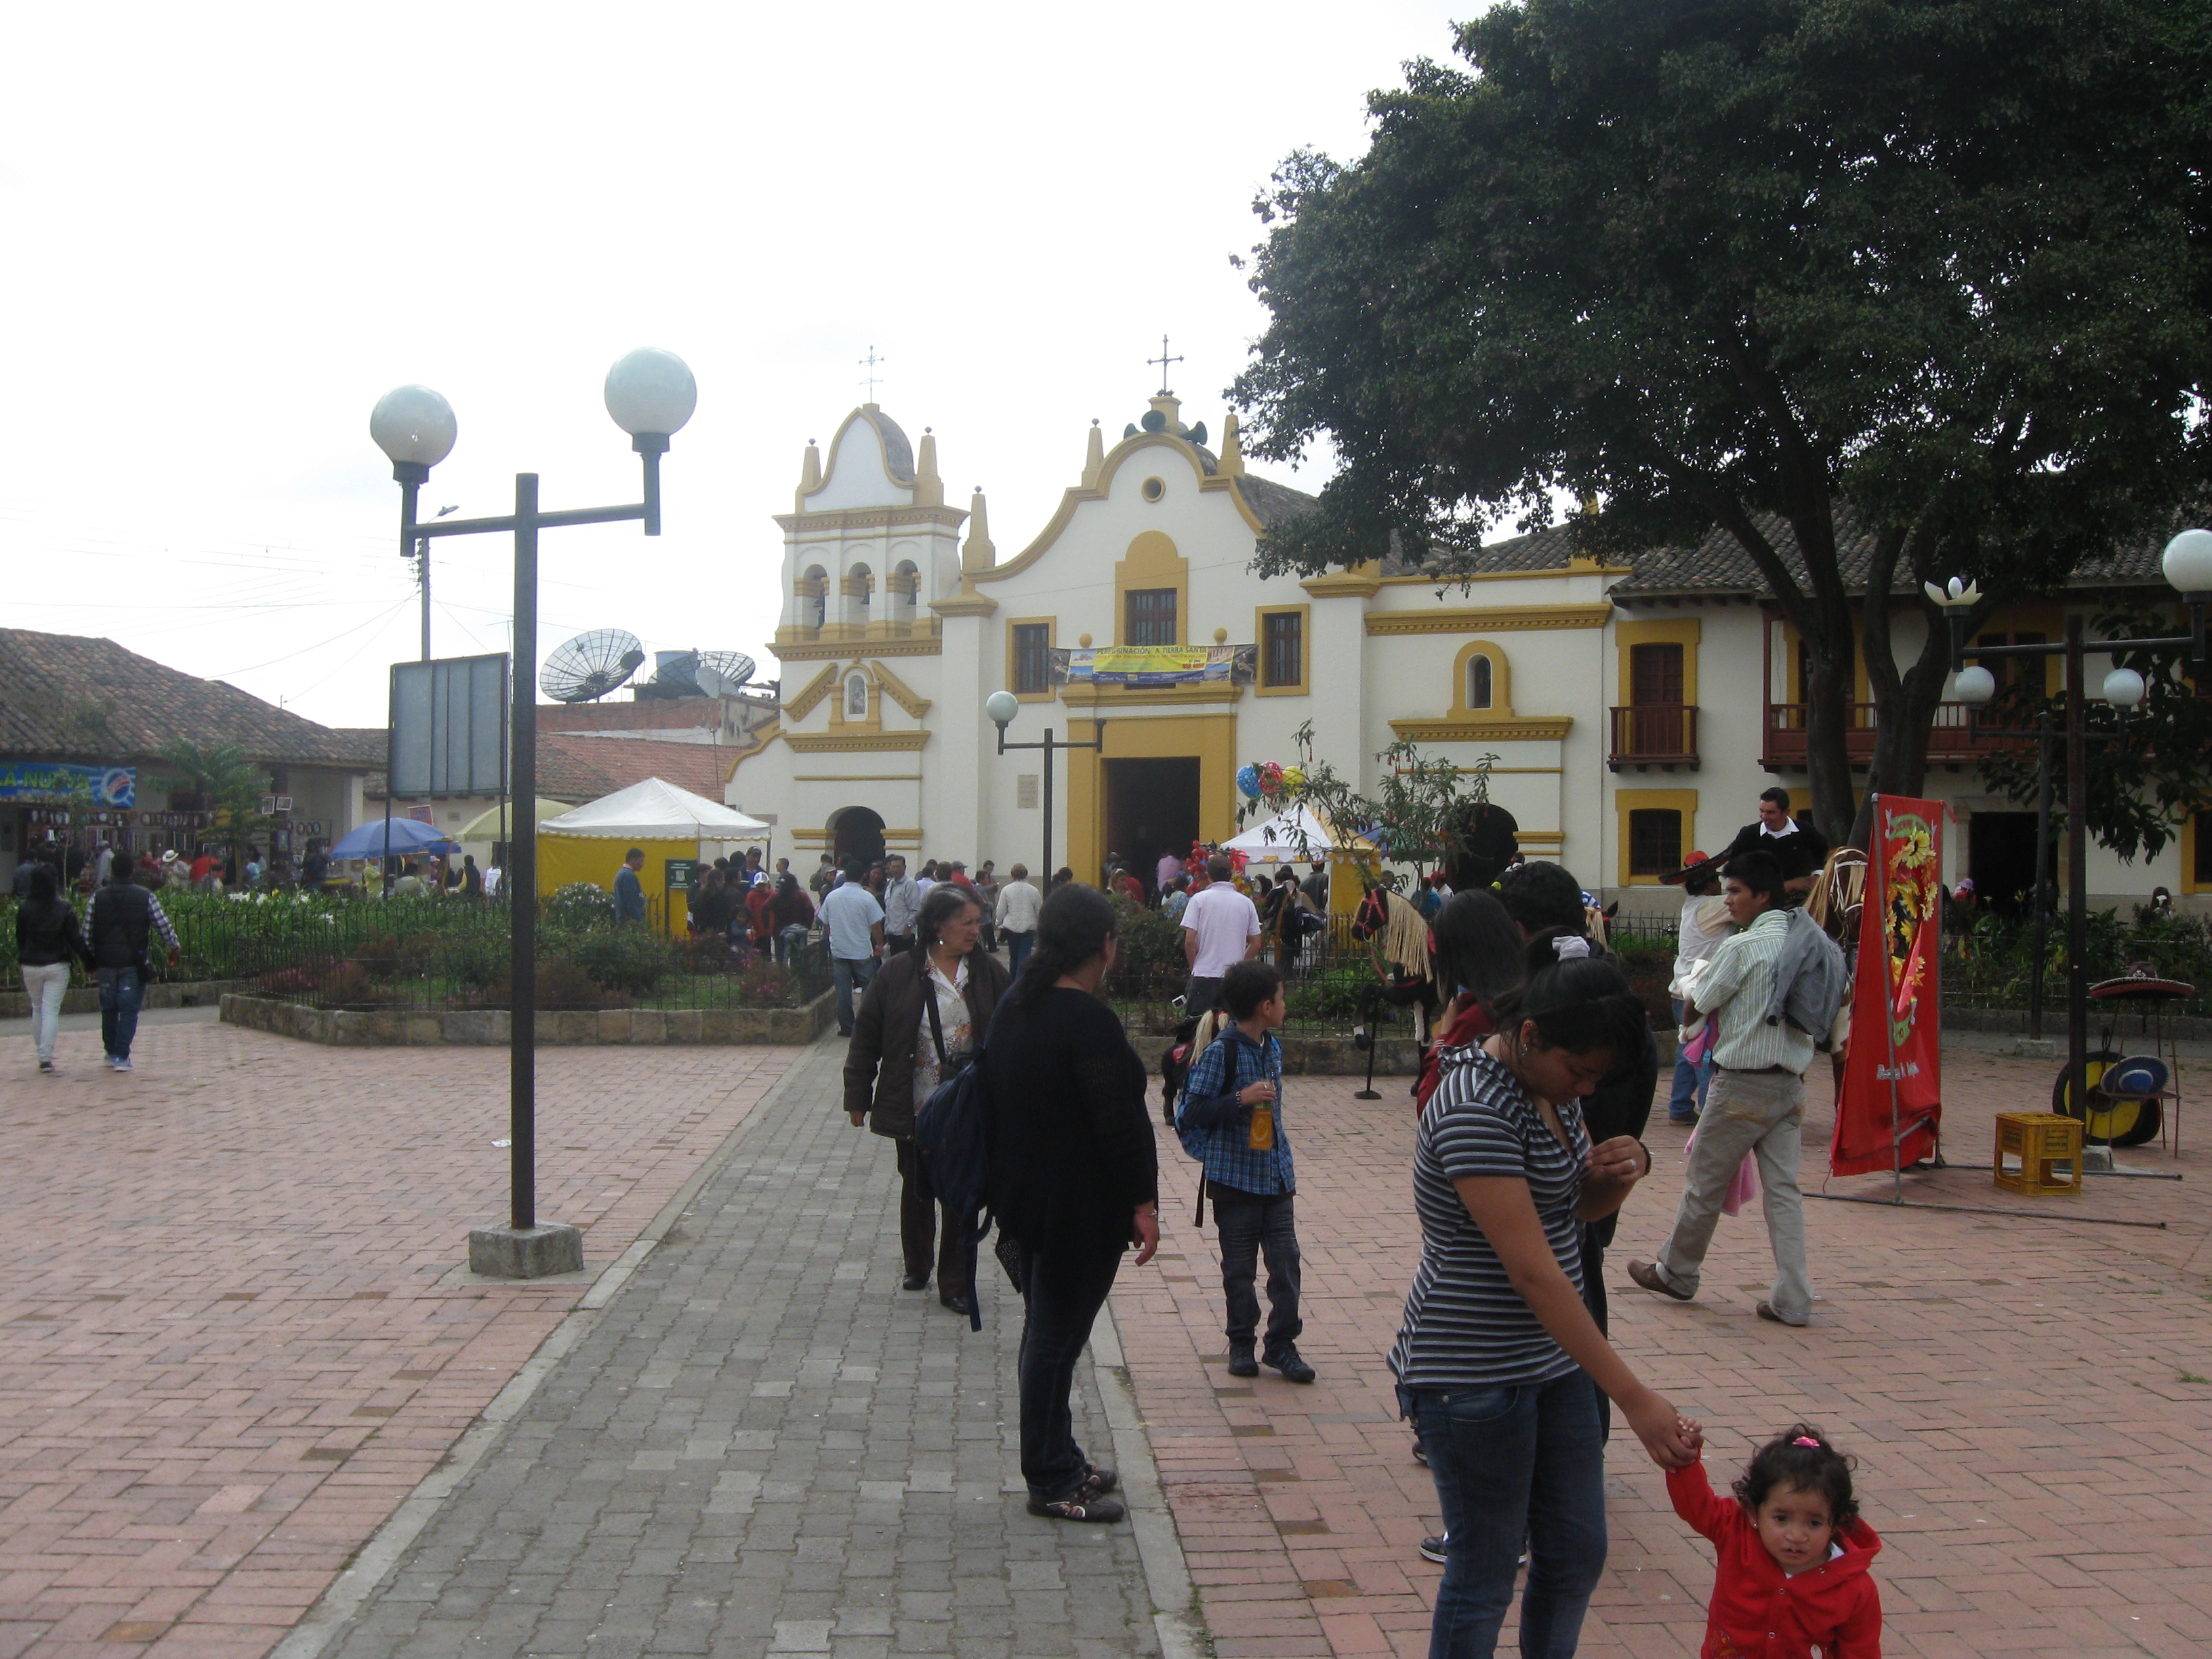
Soacha
Soacha is considered a borough of Bogotá, but officially is an autonomous municipality. It has an important industrial zone and is home to mostly working-class families.
Soacha Wikipedia Page

About Our Data
The data on this page is estimated using a number of publicly available tools and resources. It is provided without warranty, and could contain inaccuracies. Use at your own risk.