Categories in Praia
Industries
Business Distribution by Industry in Praia
| Industry Description | Number of Establishments |
|---|---|
| Restaurants | 190 |
| Corporate management | 138 |
| Shopping | 96 |
| Education | 90 |
| Other accommodation | 88 |
| Bars, pubs and taverns | 63 |
| Hotels and motels | 61 |
| Electronics stores | 56 |
| Grocery stores and supermarkets | 56 |
| Apartments | 55 |
| Churches | 46 |
| Public administration | 42 |
| Clothing stores | 37 |
| Real estate | 36 |
Praia Facts
| Area | 55.6 km² |
| Population | 12,316 |
| Male Population | 5,529 (44.9%) |
| Female Population | 6,787 (55.1%) |
| Population change (1975 to 2020) | +96.1% |
| Population change (2000 to 2020) | +17.8% |
| Median Age | 19.5 years (Male: 18.2, Female: 21.1) |
| Neighborhoods | Palmarejo, Achada de Santo António, Plato, Terra Branca, Várzea |
| Local Time | |
| Timezone | Cape Verde Standard Time |
| Lat & Lng | 14.93152, -23.51254 |
| Postal Codes | 7600, 7601, 7602 |
Map of Praia
Interactive Map
Praia Population
Years 1975 to 2020
| Data | 1975 | 1990 | 2000 | 2015 | 2020 |
|---|---|---|---|---|---|
| Population | 6,279 | 8,136 | 10,454 | 11,810 | 12,316 |
| Population Density | 113 / km² | 146.4 / km² | 188.1 / km² | 212.6 / km² | 221.7 / km² |
Praia Population change from 2000 to 2015
Increase of 13% from year 2000 to 2015
| Location | Change since 1975 | Change since 1990 | Change since 2000 |
|---|---|---|---|
| Praia | +88.1% | +45.2% | +13% |
| Praia, Cape Verde (municipality) | +88.1% | +45.2% | +13% |
| Cape Verde | +97.1% | +56.2% | +20.7% |
Praia Median Age
Median Age: 19.5 years
| Location | Median Age | Median Age (Female) | Median Age (Male) |
|---|---|---|---|
| Praia | 19.5 yrs | 21.1 yrs | 18.2 yrs |
| Praia, Cape Verde (municipality) | 19.5 yrs | 21.1 yrs | 18.2 yrs |
| Cape Verde | 23 yrs | 23.4 yrs | 22.6 yrs |
Praia Population Density
Population Density: 222 / km²
| Location | Population | Area | Density |
|---|---|---|---|
| Praia | 12,316 | 55.6 km² | 222 / km² |
| Praia, Cape Verde (municipality) | 11,810 | 55.4 km² | 213 / km² |
| Cape Verde | 455,281 | 4,124.8 km² | 110 / km² |
Praia Historical and Projected Population
Estimated Population from 1700 to 2100
- JRC (European Commission's Joint Research Centre) work on the GHS built-up grid
- CIESIN (Center for International Earth Science Information Network)
- [Link] Klein Goldewijk, K., Beusen, A., Doelman, J., and Stehfest, E.: Anthropogenic land use estimates for the Holocene – HYDE 3.2, Earth Syst. Sci. Data, 9, 927–953, https://doi.org/10.5194/essd-9-927-2017, 2017.
Neighborhoods in Praia
Percentage of businesses by neighborhood in Praia
Price Distribution
Business distribution by price for Praia
Human Development Index (HDI)
Statistic composite index of life expectancy, education, and per capita income.
Praia CO2 Emissions
Carbon Dioxide (CO2) Emissions Per Capita in Tonnes Per Year
| Location | CO2 Emissions | CO2 Emissions Per Capita | CO2 Emissions Intensity |
|---|---|---|---|
| Praia | 27,298 tn | 2.22 tn | 491.3 tons/km² |
| Praia, Cape Verde (municipality) | 26,177 tn | 2.22 tn | 472.8 tons/km² |
| Cape Verde | 853,612 tn | 1.87 tn | 206.9 tons/km² |
| 2013 CO2 emissions (tonnes/year) | 27,298 tn |
| 2013 CO2 emissions (tonnes/year) per capita | 2.22 tn |
| 2013 CO2 emissions intensity (tonnes/km²/year) | 491.3 tons/km² |
Natural Hazards Risk
Relative risk out of 10
| Hazard | Risk Level |
|---|---|
| Drought | Low (2) |
* Risk, particularly concerning flood or landslide, may not be for the entire area.
- Dilley, M., R.S. Chen, U. Deichmann, A.L. Lerner-Lam, M. Arnold, J. Agwe, P. Buys, O. Kjekstad, B. Lyon, and G. Yetman. 2005. Natural Disaster Hotspots: A Global Risk Analysis. Washington, D.C.: World Bank. https://doi.org/10.1596/0-8213-5930-4.
- Center for Hazards and Risk Research - CHRR - Columbia University, Center for International Earth Science Information Network - CIESIN - Columbia University, and International Research Institute for Climate and Society - IRI - Columbia University. 2005. Global Drought Hazard Frequency and Distribution. Palisades, NY: NASA Socioeconomic Data and Applications Center (SEDAC). https://doi.org/10.7927/H4VX0DFT.
Recent Nearby Earthquakes
Magnitude 3.0 and greater
| Date▼ | Time↕ | Magnitude↕ | Distance↕ | Depth↕ | Location↕ | Link |
|---|---|---|---|---|---|---|
| 5/27/90 | 10:12 AM | 4.2 | 32.6 km | 10,000 m | Cape Verde | usgs.gov |
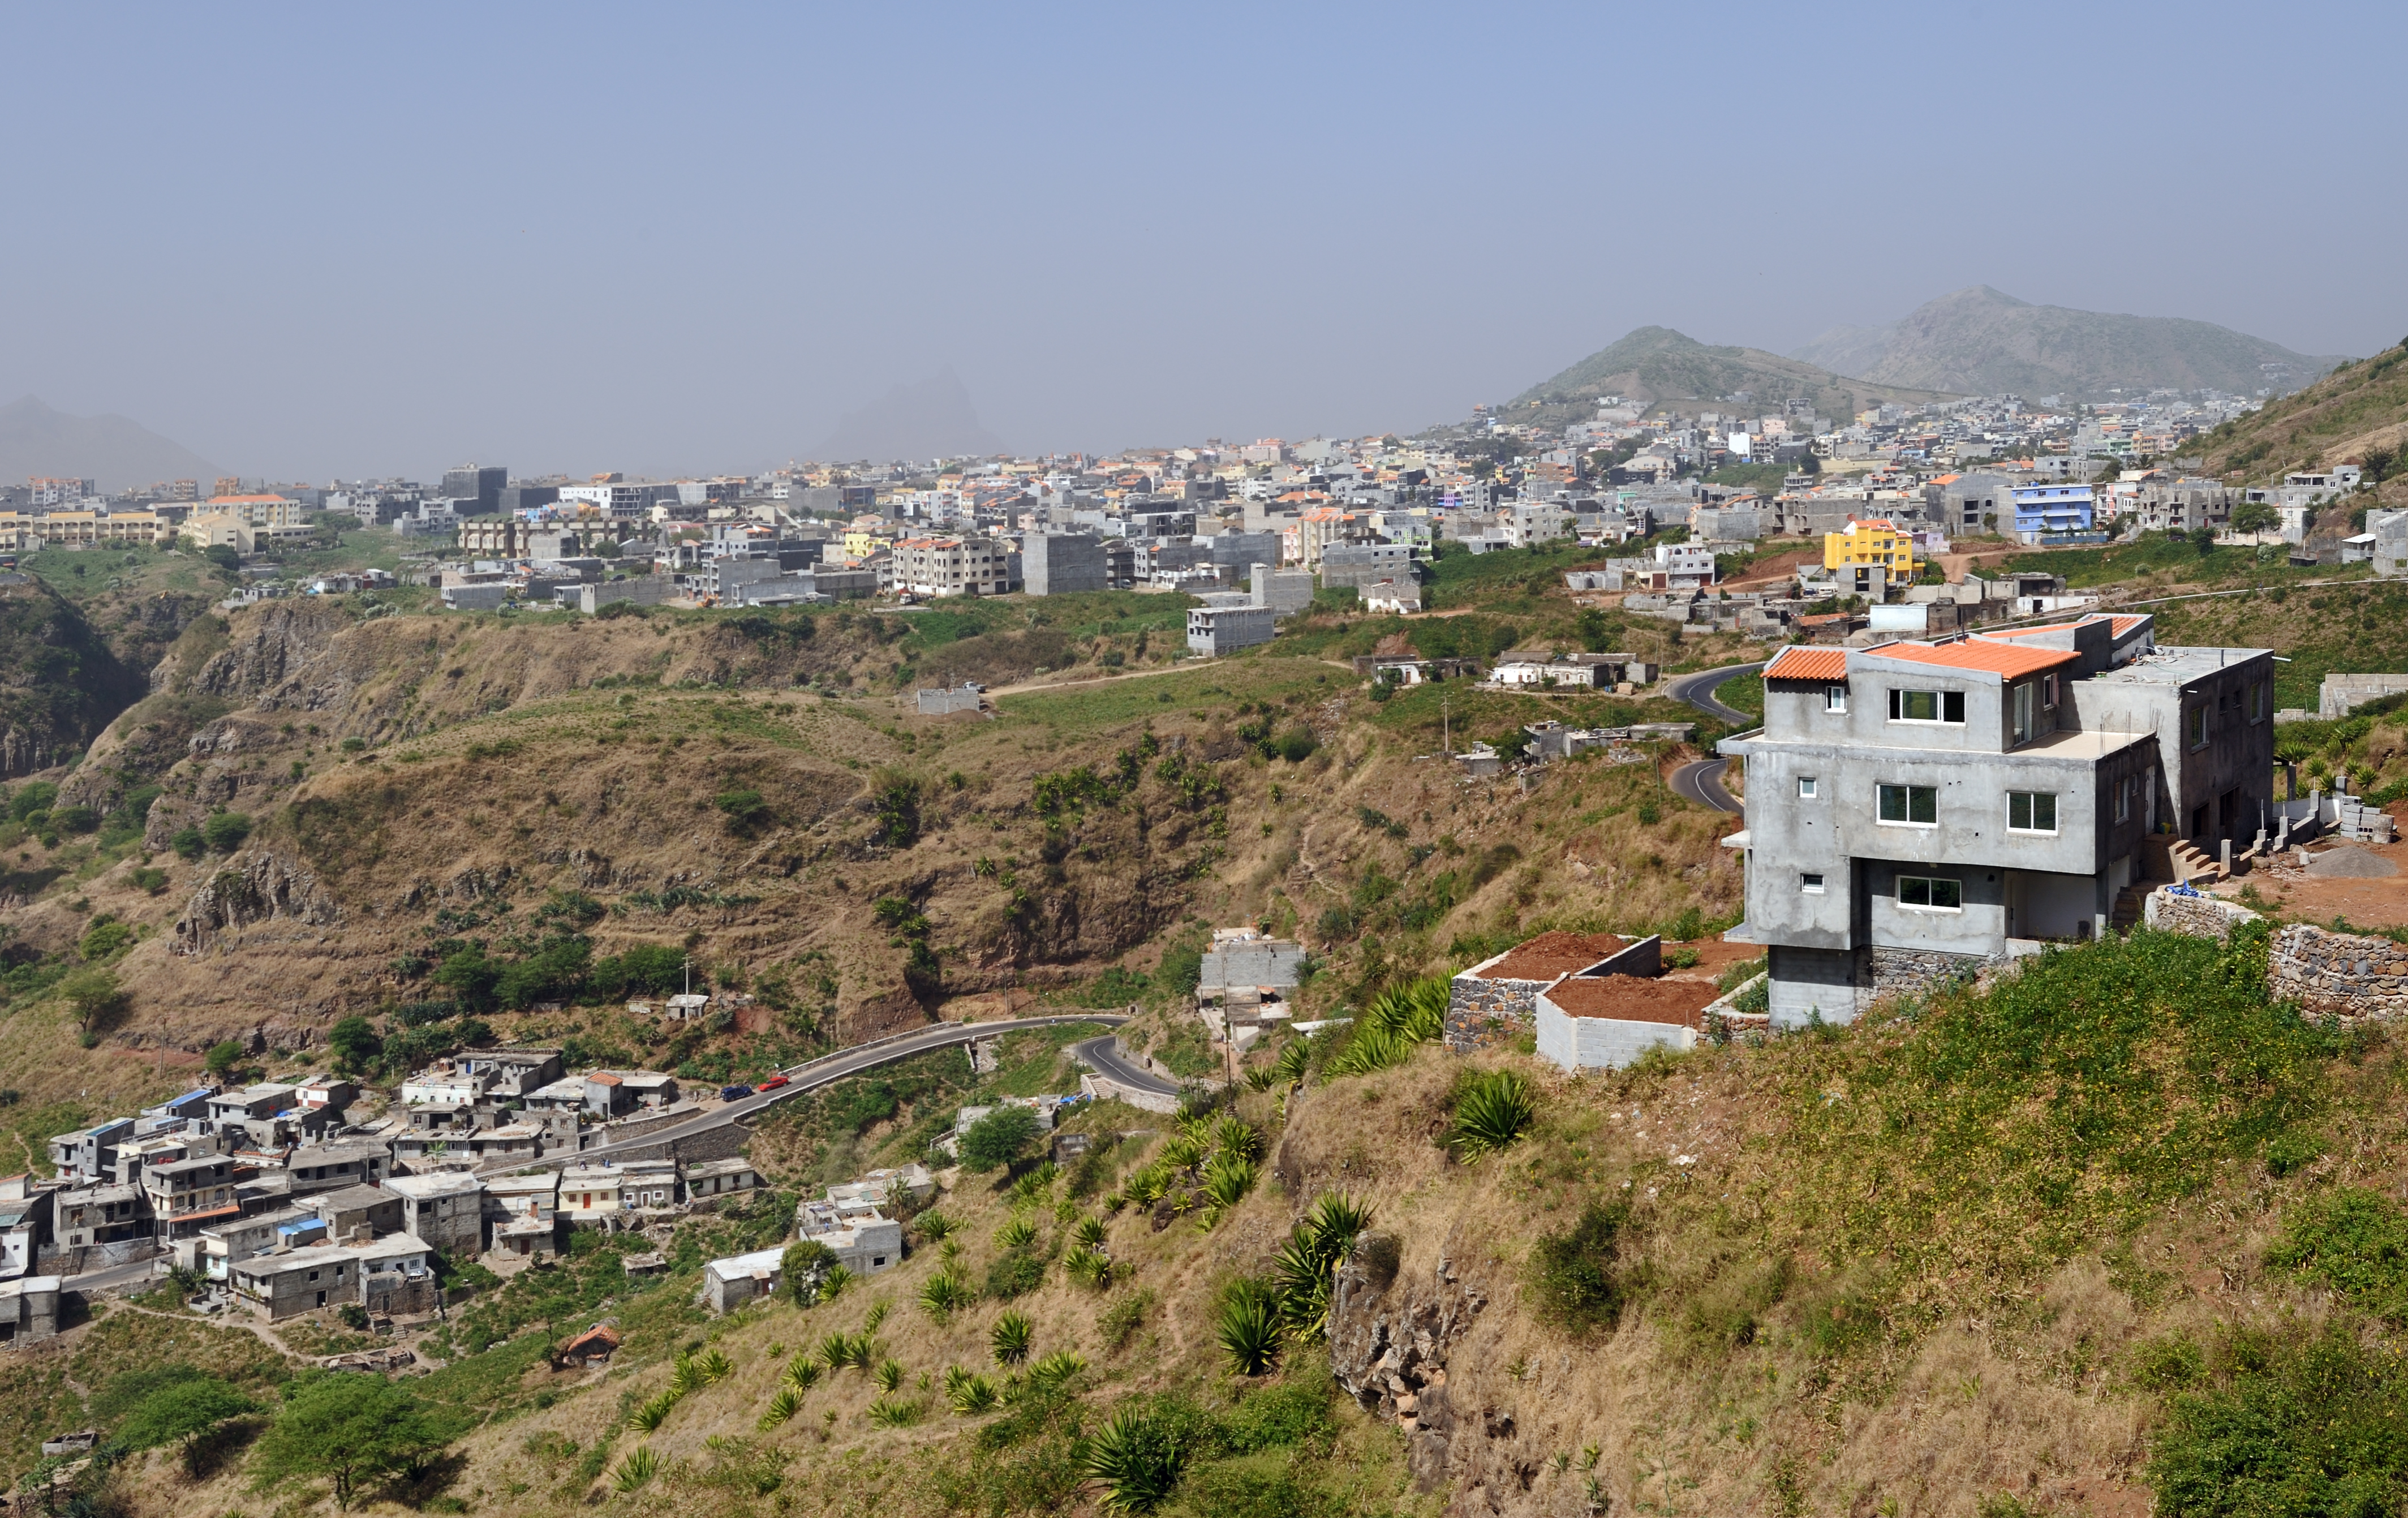
Praia
Praia (Portuguese pronunciation: [ˈpɾajɐ], meaning "beach", in both Portuguese and Cape Verdean Creole), is the capital and largest city of Cape Verde, an island nation in the Atlantic Ocean west of Senegal. It lies on the southern coast of Santiago ..
Praia Wikipedia Page


About Our Data
The data on this page is estimated using a number of publicly available tools and resources. It is provided without warranty, and could contain inaccuracies. Use at your own risk.