Industries
Business Distribution by Industry in Dorum
| Industry Description | Number of Establishments |
|---|---|
| Restaurants | 12 |
| Shopping | 9 |
| Other accommodation | 7 |
| Nursing homes | 6 |
| Construction of buildings | 5 |
| General practitioners | 5 |
| Buses and trains | 5 |
Dorum Facts
| Area | 1.9 km² |
| Population | 1,960 |
| Male Population | 947 (48.3%) |
| Female Population | 1,013 (51.7%) |
| Population change (1975 to 2020) | -31.4% |
| Population change (2000 to 2020) | -15.5% |
| Median Age | 46.9 years (Male: 45.9, Female: 47.8) |
| Area Codes | 4741, 4742 |
| Neighborhoods | Dorum, Dorum Neufeld, Dorumer Neufeld, Lehe, Padingbüttel |
| Local Time | |
| Timezone | Central European Summer Time |
| Lat & Lng | 53.68333, 8.56667 |
Map of Dorum
Interactive Map
Dorum Population
Years 1975 to 2020
| Data | 1975 | 1990 | 2000 | 2015 | 2020 |
|---|---|---|---|---|---|
| Population | 2,859 | 2,417 | 2,319 | 2,018 | 1,960 |
| Population Density | 1,475.6 / km² | 1,247.5 / km² | 1,196.9 / km² | 1,041.5 / km² | 1,011.6 / km² |
Dorum Population change from 2000 to 2015
Decrease of 13% from year 2000 to 2015
| Location | Change since 1975 | Change since 1990 | Change since 2000 |
|---|---|---|---|
| Dorum | -29.4% | -16.5% | -13% |
| Lower Saxony | +4.3% | +2.8% | -1.3% |
| Germany | +2.6% | +2.2% | -1.5% |
Dorum Median Age
Median Age: 46.9 years
| Location | Median Age | Median Age (Female) | Median Age (Male) |
|---|---|---|---|
| Dorum | 46.9 yrs | 47.8 yrs | 45.9 yrs |
| Lower Saxony | 44.8 yrs | 45.8 yrs | 43.7 yrs |
| Germany | 44.8 yrs | 46 yrs | 43.6 yrs |
Dorum Population Density
Population Density: 1,012 / km²
| Location | Population | Area | Density |
|---|---|---|---|
| Dorum | 1,960 | 1.938 km² | 1,012 / km² |
| Lower Saxony | 7.8 million | 47,789.6 km² | 164 / km² |
| Germany | 80.7 million | 358,179.8 km² | 225 / km² |
Dorum Historical and Projected Population
Estimated Population from 0 to 2100
- JRC (European Commission's Joint Research Centre) work on the GHS built-up grid
- CIESIN (Center for International Earth Science Information Network)
- [Link] Klein Goldewijk, K., Beusen, A., Doelman, J., and Stehfest, E.: Anthropogenic land use estimates for the Holocene – HYDE 3.2, Earth Syst. Sci. Data, 9, 927–953, https://doi.org/10.5194/essd-9-927-2017, 2017.
Neighborhoods in Dorum
Percentage of businesses by neighborhood in Dorum
Area Codes
Percentage Area Codes used by businesses in Dorum
Postal Codes
Percentage of businesses by Postal Codes in Dorum
Price Distribution
Business distribution by price for Dorum
Human Development Index (HDI)
Statistic composite index of life expectancy, education, and per capita income.
Dorum CO2 Emissions
Carbon Dioxide (CO2) Emissions Per Capita in Tonnes Per Year
| Location | CO2 Emissions | CO2 Emissions Per Capita | CO2 Emissions Intensity |
|---|---|---|---|
| Dorum | 19,694 tn | 10.05 tn | 10,164.6 tons/km² |
| Lower Saxony | 78,468,653 tn | 10.03 tn | 1,642 tons/km² |
| Germany | 755,339,039 tn | 9.36 tn | 2,108.8 tons/km² |
| 2013 CO2 emissions (tonnes/year) | 19,694 tn |
| 2013 CO2 emissions (tonnes/year) per capita | 10.05 tn |
| 2013 CO2 emissions intensity (tonnes/km²/year) | 10,164.6 tons/km² |
Recent Nearby Earthquakes
Magnitude 3.0 and greater
| Date▼ | Time↕ | Magnitude↕ | Distance↕ | Depth↕ | Location↕ | Link |
|---|---|---|---|---|---|---|
| 7/15/05 | 3:02 PM | 4 | 84.3 km | 10,000 m | Germany | usgs.gov |
| 10/20/04 | 6:59 AM | 4.5 | 95.9 km | 5,500 m | Germany | usgs.gov |
| 6/2/77 | 1:32 PM | 3.8 | 94.9 km | 0 m | Germany | usgs.gov |
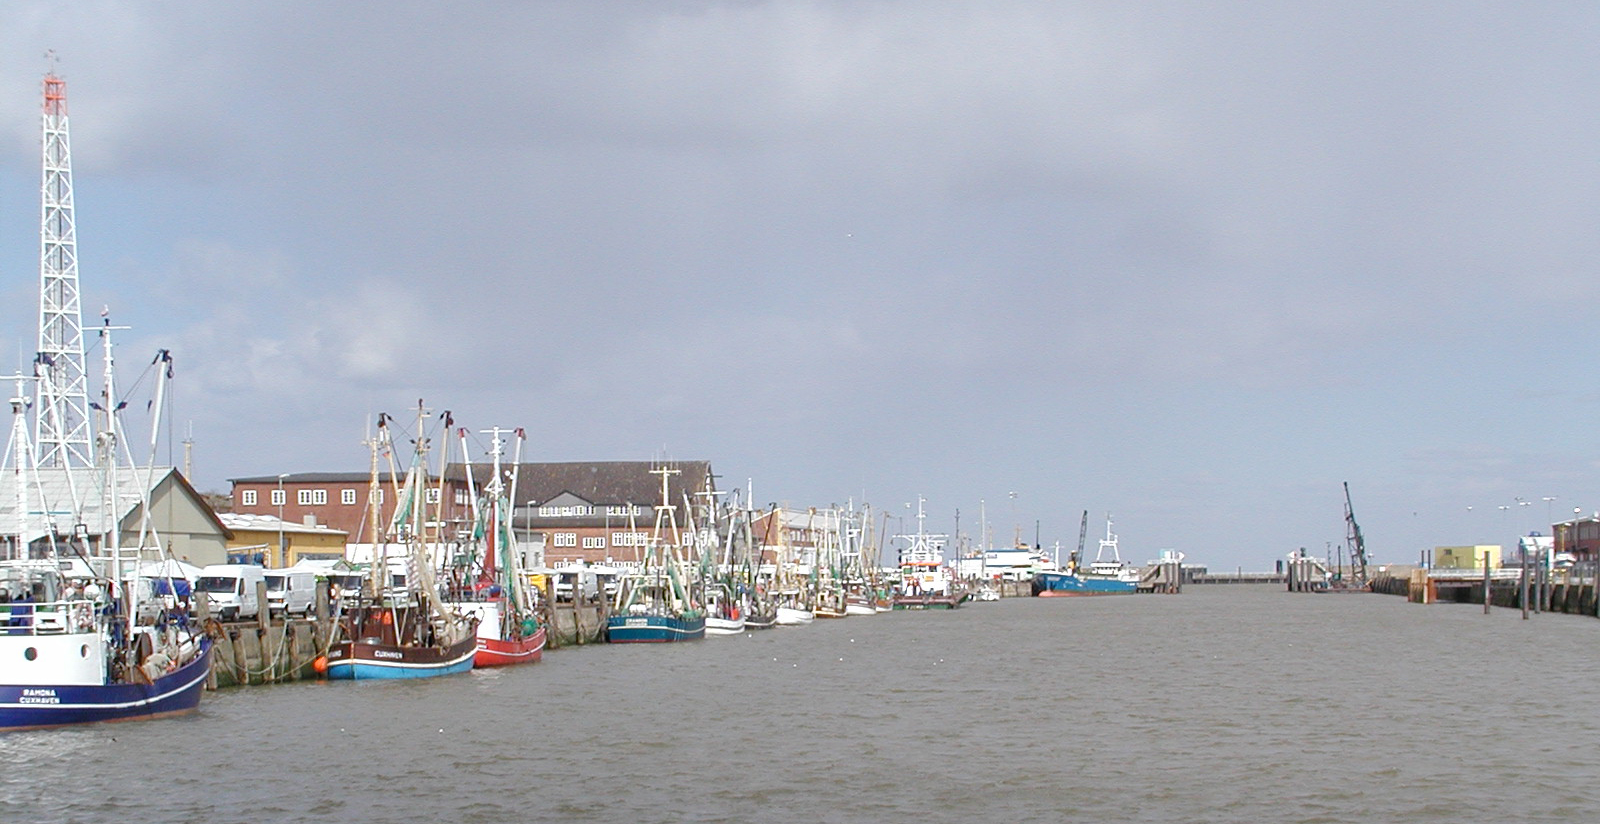
Dorum
Dorum is a village and a former municipality in the district of Cuxhaven, in Lower Saxony, Germany. Since 1 January 2015 it has been part of the municipality Wurster Nordseeküste. Land of Wursten, a somewhat autonomous farmers' republic including Do..
Dorum Wikipedia Page


About Our Data
The data on this page is estimated using a number of publicly available tools and resources. It is provided without warranty, and could contain inaccuracies. Use at your own risk.