Categories in Geisa
Industries
Business Distribution by Industry in Geisa
| Industry Description | Number of Establishments |
|---|---|
| Construction of buildings | 21 |
| Corporate management | 17 |
| Churches | 16 |
| Other accommodation | 13 |
| Restaurants | 13 |
| Car repair | 12 |
| Shopping | 12 |
| Cemeteries and crematoriums | 12 |
| Firefighting and rescue | 11 |
| Electrical installation | 11 |
| Technical construction services | 10 |
| Religion | 10 |
| Dentists | 9 |
| All food and beverage | 9 |
| Real estate | 8 |
| Education | 8 |
| Travel agencies | 8 |
Geisa Facts
| Area | 1.3 km² |
| Population | 1,608 |
| Male Population | 807 (50.2%) |
| Female Population | 801 (49.8%) |
| Population change (1975 to 2020) | -82.1% |
| Population change (2000 to 2020) | -47.8% |
| Median Age | 47.9 years (Male: 46.4, Female: 49.5) |
| Area Codes | 36965, 36967 |
| Neighborhoods | Borsch, Bremen, Geismar, Spahl, Ketten |
| Local Time | |
| Timezone | Central European Summer Time |
| Lat & Lng | 50.71465, 9.95075 |
Map of Geisa
Interactive Map
Geisa Population
Years 1975 to 2020
| Data | 1975 | 1990 | 2000 | 2015 | 2020 |
|---|---|---|---|---|---|
| Population | 8,970 | 4,302 | 3,081 | 1,663 | 1,608 |
| Population Density | 6,834.3 / km² | 3,277.7 / km² | 2,347.4 / km² | 1,267 / km² | 1,225.1 / km² |
Geisa Population change from 2000 to 2015
Decrease of 46% from year 2000 to 2015
| Location | Change since 1975 | Change since 1990 | Change since 2000 |
|---|---|---|---|
| Geisa | -81.5% | -61.3% | -46% |
| Thuringia | -31.8% | -19.6% | -14.2% |
| Germany | +2.6% | +2.2% | -1.5% |
Geisa Median Age
Median Age: 47.9 years
| Location | Median Age | Median Age (Female) | Median Age (Male) |
|---|---|---|---|
| Geisa | 47.9 yrs | 49.5 yrs | 46.4 yrs |
| Thuringia | 47.8 yrs | 49.6 yrs | 46 yrs |
| Germany | 44.8 yrs | 46 yrs | 43.6 yrs |
Geisa Population Density
Population Density: 1,225 / km²
| Location | Population | Area | Density |
|---|---|---|---|
| Geisa | 1,608 | 1.313 km² | 1,225 / km² |
| Thuringia | 2.1 million | 16,199.9 km² | 130 / km² |
| Germany | 80.7 million | 358,179.8 km² | 225 / km² |
Geisa Historical and Projected Population
Estimated Population from 0 to 2100
- JRC (European Commission's Joint Research Centre) work on the GHS built-up grid
- CIESIN (Center for International Earth Science Information Network)
- [Link] Klein Goldewijk, K., Beusen, A., Doelman, J., and Stehfest, E.: Anthropogenic land use estimates for the Holocene – HYDE 3.2, Earth Syst. Sci. Data, 9, 927–953, https://doi.org/10.5194/essd-9-927-2017, 2017.
Neighborhoods in Geisa
Percentage of businesses by neighborhood in Geisa
Price Distribution
Business distribution by price for Geisa
Human Development Index (HDI)
Statistic composite index of life expectancy, education, and per capita income.
Geisa CO2 Emissions
Carbon Dioxide (CO2) Emissions Per Capita in Tonnes Per Year
| Location | CO2 Emissions | CO2 Emissions Per Capita | CO2 Emissions Intensity |
|---|---|---|---|
| Geisa | 14,905 tn | 9.27 tn | 11,356.1 tons/km² |
| Thuringia | 19,279,601 tn | 9.13 tn | 1,190.1 tons/km² |
| Germany | 755,339,039 tn | 9.36 tn | 2,108.8 tons/km² |
| 2013 CO2 emissions (tonnes/year) | 14,905 tn |
| 2013 CO2 emissions (tonnes/year) per capita | 9.27 tn |
| 2013 CO2 emissions intensity (tonnes/km²/year) | 11,356.1 tons/km² |
Natural Hazards Risk
Relative risk out of 10
| Hazard | Risk Level |
|---|---|
| Flood | High (9) |
| Earthquake | Low (2) |
* Risk, particularly concerning flood or landslide, may not be for the entire area.
- Dilley, M., R.S. Chen, U. Deichmann, A.L. Lerner-Lam, M. Arnold, J. Agwe, P. Buys, O. Kjekstad, B. Lyon, and G. Yetman. 2005. Natural Disaster Hotspots: A Global Risk Analysis. Washington, D.C.: World Bank. https://doi.org/10.1596/0-8213-5930-4.
- Center for Hazards and Risk Research - CHRR - Columbia University, Center for International Earth Science Information Network - CIESIN - Columbia University. 2005. Global Flood Hazard Frequency and Distribution. Palisades, NY: NASA Socioeconomic Data and Applications Center (SEDAC). https://doi.org/10.7927/H4668B3D.
- Center for Hazards and Risk Research - CHRR - Columbia University, Center for International Earth Science Information Network - CIESIN - Columbia University. 2005. Global Earthquake Hazard Distribution - Peak Ground Acceleration. Palisades, NY: NASA Socioeconomic Data and Applications Center (SEDAC). https://doi.org/10.7927/H4BZ63ZS.
Recent Nearby Earthquakes
Magnitude 3.0 and greater
| Date▼ | Time↕ | Magnitude↕ | Distance↕ | Depth↕ | Location↕ | Link |
|---|---|---|---|---|---|---|
| 10/25/06 | 2:11 PM | 3 | 81.3 km | 1,000 m | Germany | usgs.gov |
| 9/22/05 | 4:00 AM | 3.2 | 9.6 km | 10,000 m | Germany | usgs.gov |
| 7/2/01 | 1:19 PM | 3.4 | 52 km | 10,000 m | Germany | usgs.gov |
| 12/11/98 | 3:45 AM | 3 | 69.6 km | 10,000 m | Germany | usgs.gov |
| 11/10/97 | 4:13 PM | 3.3 | 57.6 km | 10,000 m | Germany | usgs.gov |
| 5/4/91 | 7:33 AM | 3 | 77.5 km | 10,000 m | Germany | usgs.gov |
| 3/13/89 | 1:02 PM | 5.4 | 3.9 km | 1,000 m | Germany | usgs.gov |
| 7/2/83 | 3:18 AM | 3.6 | 88.3 km | 10,000 m | Germany | usgs.gov |
| 4/28/83 | 11:54 AM | 3 | 68.9 km | 10,000 m | Germany | usgs.gov |
| 1/29/82 | 11:03 PM | 3.4 | 33.5 km | 10,000 m | Germany | usgs.gov |
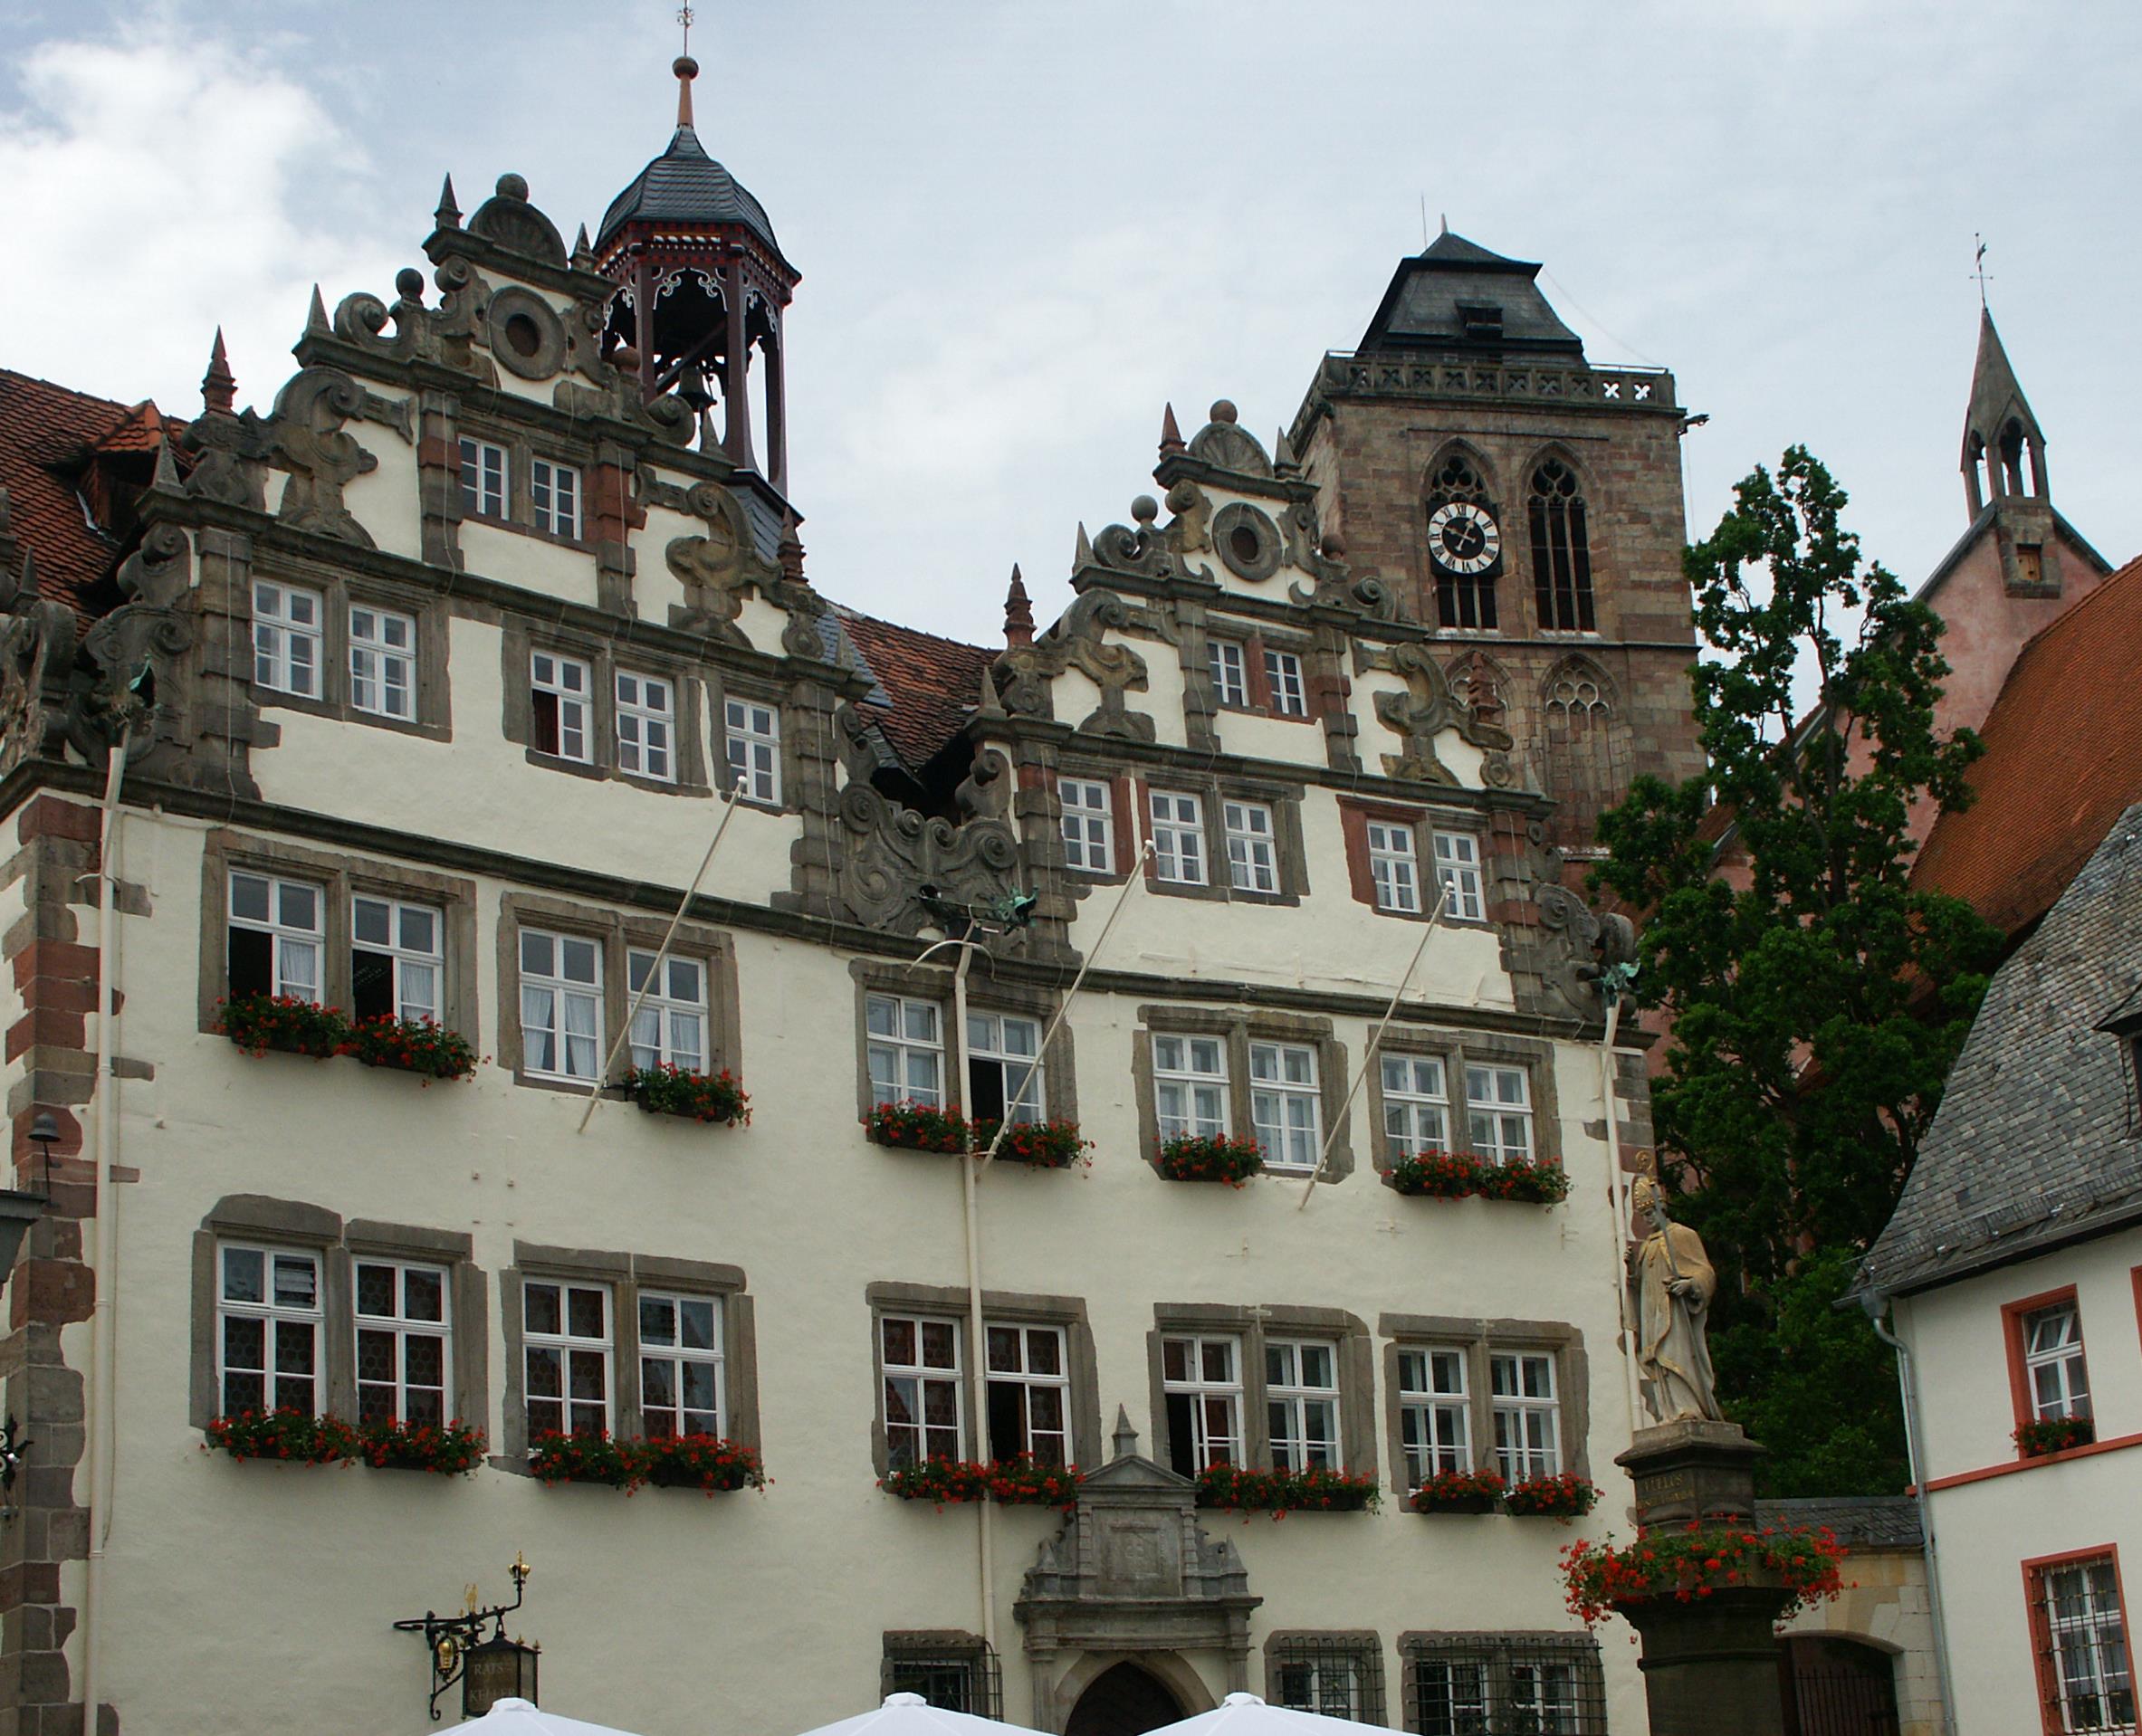
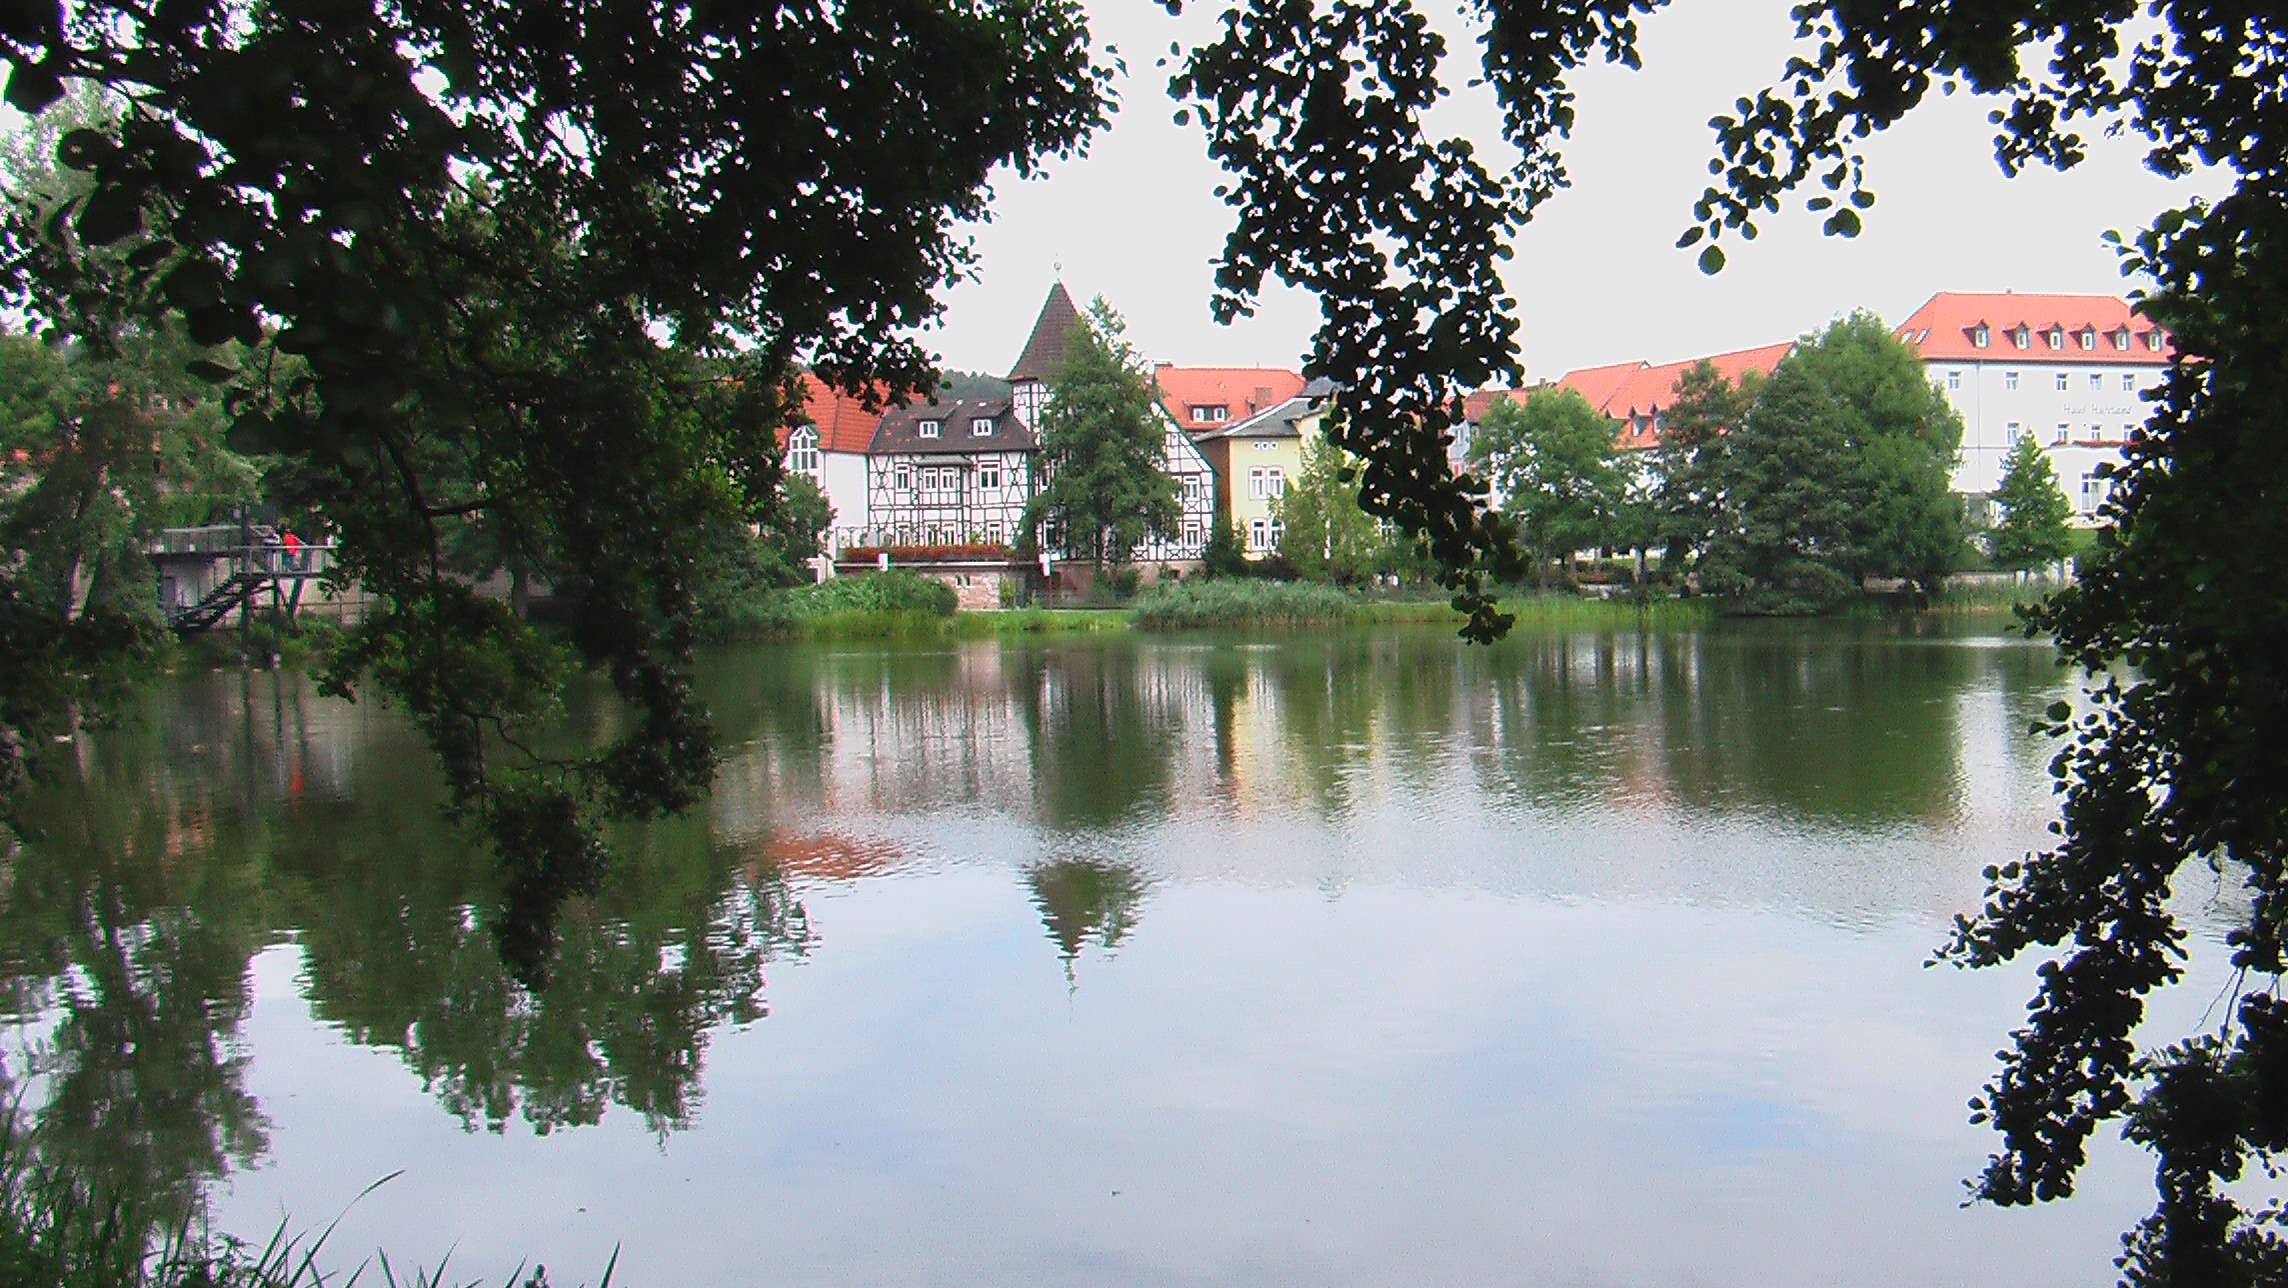
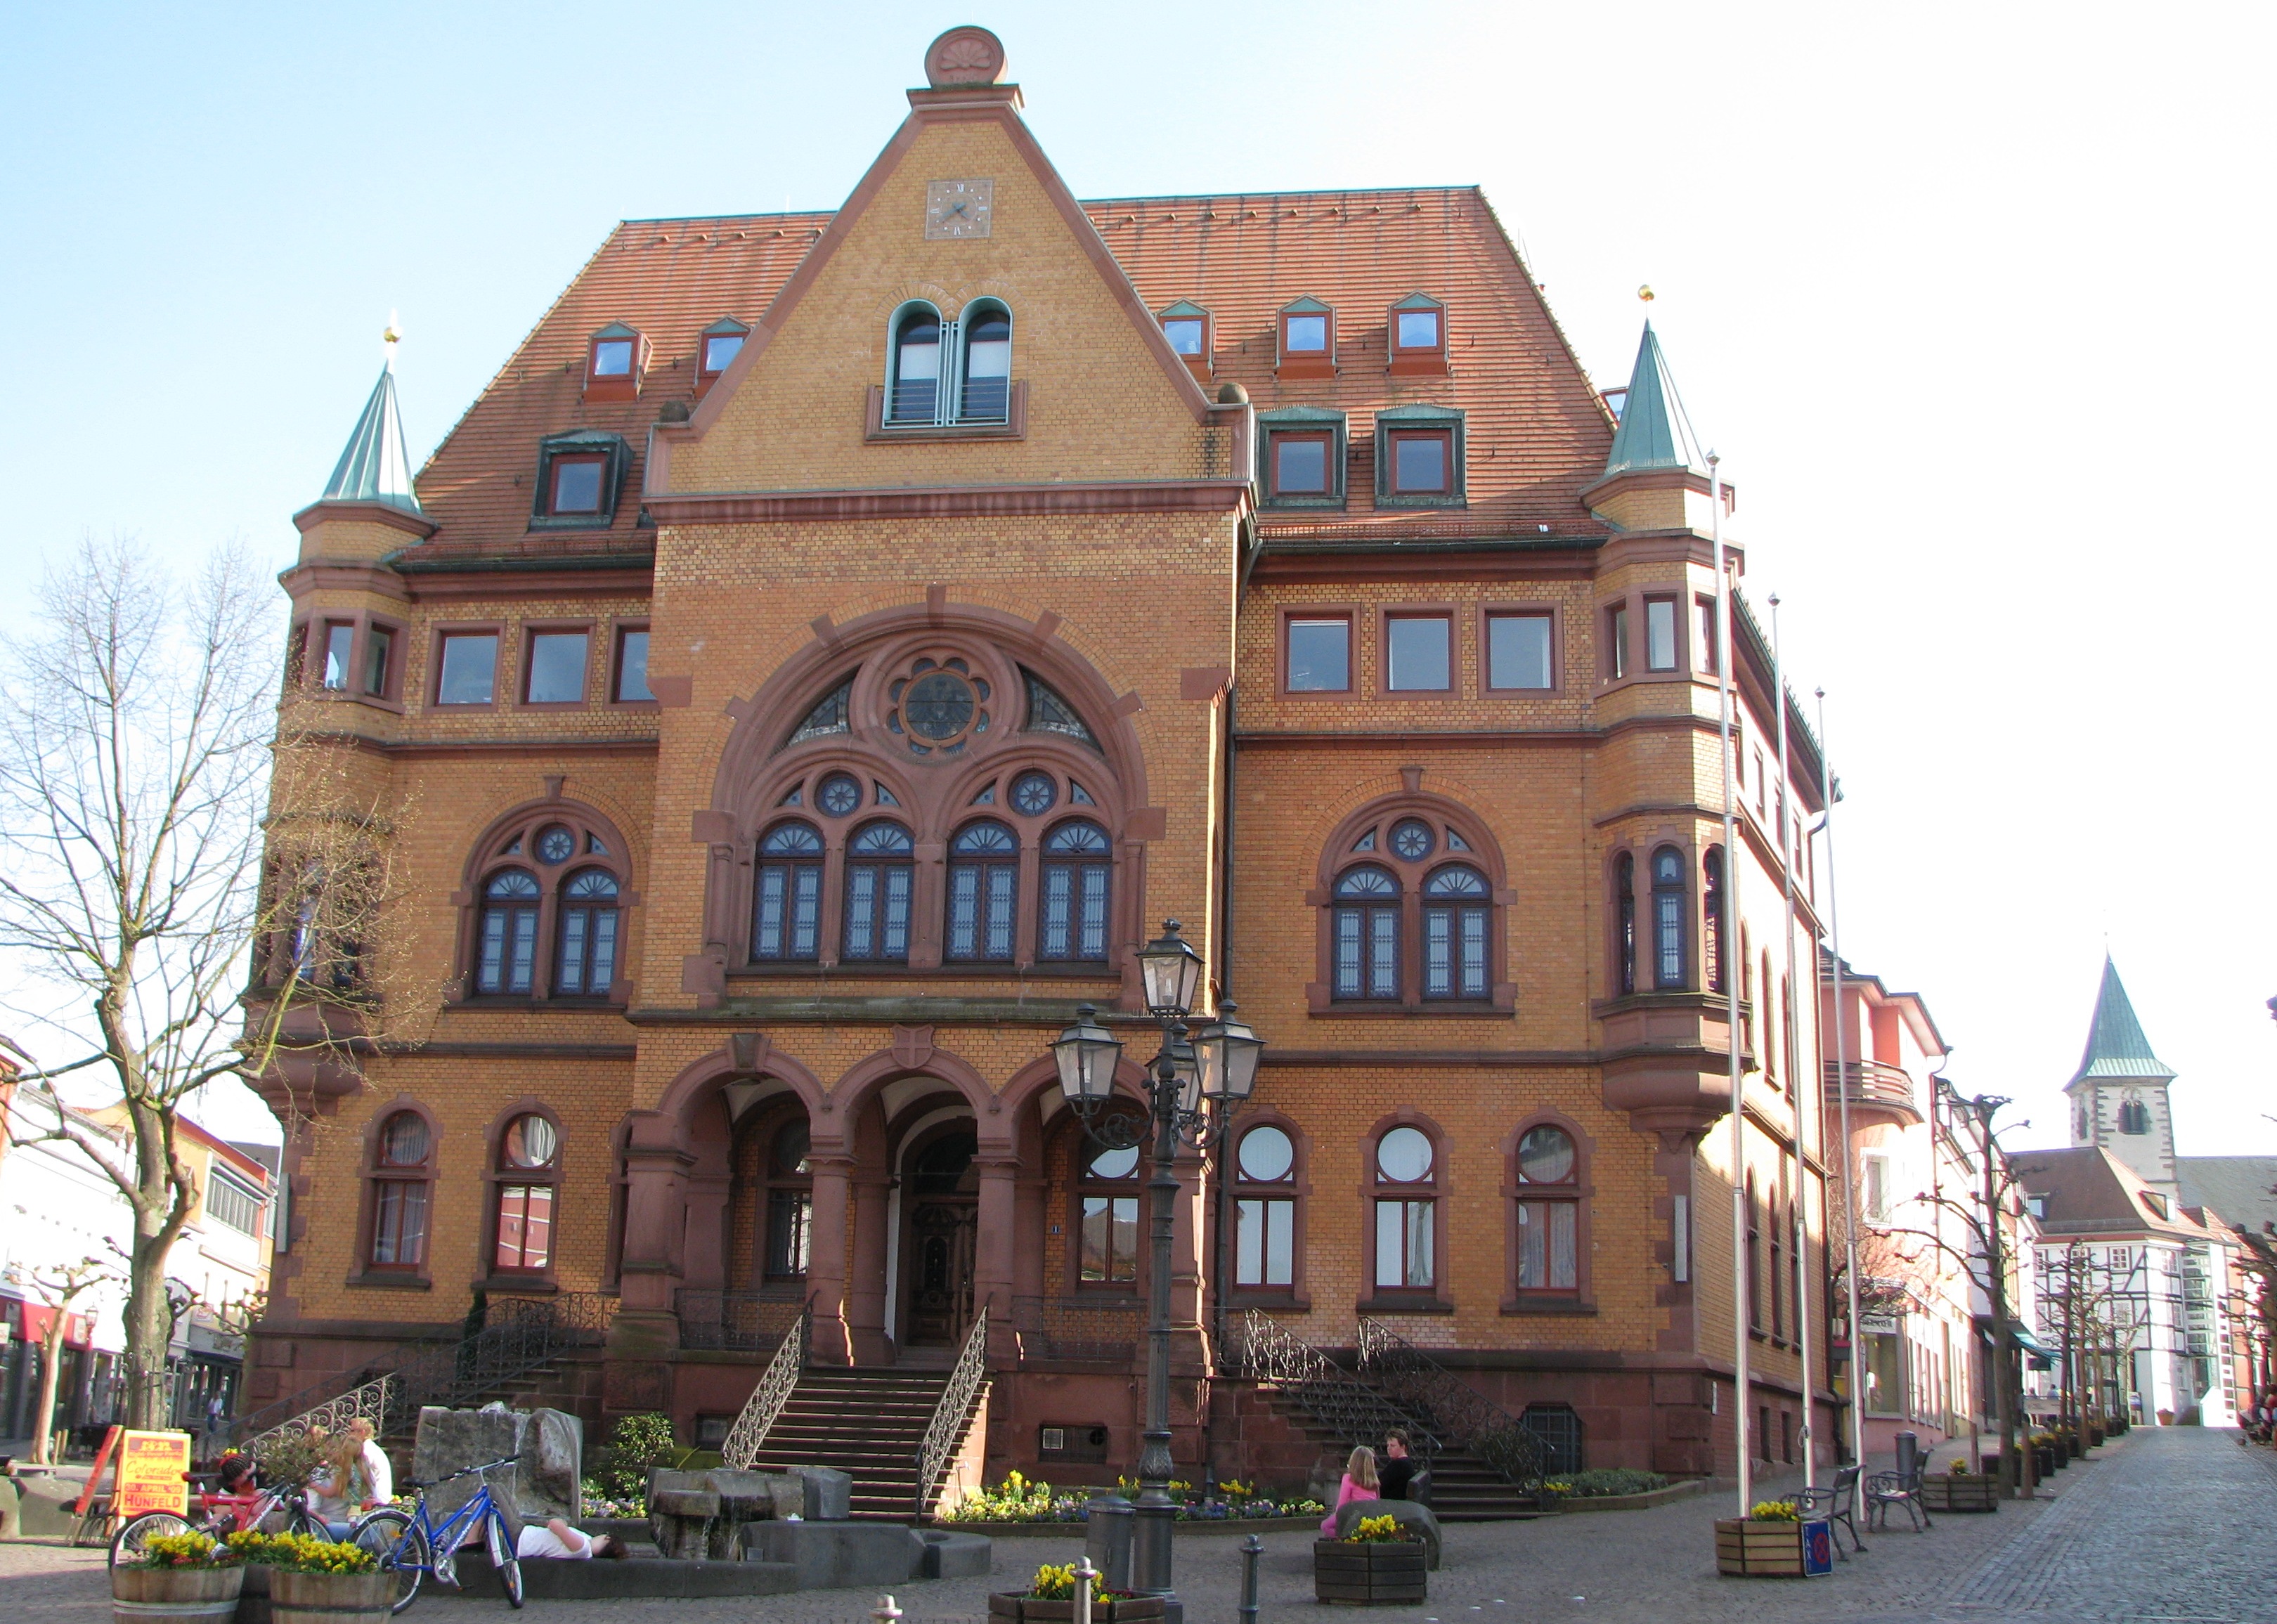
Geisa
Geisa is a town in the Wartburgkreis district, in Thuringia, Germany. It is situated in the Rhön Mountains, 26 km northeast of Fulda. The near border with Hesse was the border between West Germany and the GDR during the Cold War. Thus, Geisa was in t..
Geisa Wikipedia Page
About Our Data
The data on this page is estimated using a number of publicly available tools and resources. It is provided without warranty, and could contain inaccuracies. Use at your own risk.