Categories in Putbus
Industries
Business Distribution by Industry in Putbus
| Industry Description | Number of Establishments |
|---|---|
| Other accommodation | 136 |
| Restaurants | 44 |
| Real estate | 36 |
| Hotels and motels | 26 |
| Shopping | 17 |
| Travel agencies | 17 |
| Museums | 16 |
| Holiday homes, cabins and resorts | 13 |
Putbus Facts
| Area | 3.1 km² |
| Population | 2,378 |
| Male Population | 1,190 (50.0%) |
| Female Population | 1,188 (50.0%) |
| Population change (1975 to 2020) | -37.2% |
| Population change (2000 to 2020) | -22.4% |
| Median Age | 47.8 years (Male: 46.5, Female: 49.3) |
| Area Codes | 38301 |
| Neighborhoods | Lauterbach, Vilmnitz, Kasnevitz, Neukamp, Neuendorf |
| Local Time | |
| Timezone | Central European Summer Time |
| Lat & Lng | 54.35511, 13.47634 |
| Postal Codes | 18581 |
Map of Putbus
Interactive Map
Putbus Population
Years 1975 to 2020
| Data | 1975 | 1990 | 2000 | 2015 | 2020 |
|---|---|---|---|---|---|
| Population | 3,785 | 3,326 | 3,064 | 2,427 | 2,378 |
| Population Density | 1,235.9 / km² | 1,086 / km² | 1,000.5 / km² | 792.5 / km² | 776.5 / km² |
Putbus Population change from 2000 to 2015
Decrease of 20.8% from year 2000 to 2015
| Location | Change since 1975 | Change since 1990 | Change since 2000 |
|---|---|---|---|
| Putbus | -35.9% | -27% | -20.8% |
| Mecklenburg-Vorpommern | -19.6% | -12.3% | -10.1% |
| Germany | +2.6% | +2.2% | -1.5% |
Putbus Median Age
Median Age: 47.8 years
| Location | Median Age | Median Age (Female) | Median Age (Male) |
|---|---|---|---|
| Putbus | 47.8 yrs | 49.3 yrs | 46.5 yrs |
| Mecklenburg-Vorpommern | 47.5 yrs | 49.1 yrs | 46 yrs |
| Germany | 44.8 yrs | 46 yrs | 43.6 yrs |
Putbus Population Density
Population Density: 777 / km²
| Location | Population | Area | Density |
|---|---|---|---|
| Putbus | 2,378 | 3.063 km² | 777 / km² |
| Mecklenburg-Vorpommern | 1.6 million | 23,289 km² | 66.9 / km² |
| Germany | 80.7 million | 358,179.8 km² | 225 / km² |
Putbus Historical and Projected Population
Estimated Population from 0 to 2100
- JRC (European Commission's Joint Research Centre) work on the GHS built-up grid
- CIESIN (Center for International Earth Science Information Network)
- [Link] Klein Goldewijk, K., Beusen, A., Doelman, J., and Stehfest, E.: Anthropogenic land use estimates for the Holocene – HYDE 3.2, Earth Syst. Sci. Data, 9, 927–953, https://doi.org/10.5194/essd-9-927-2017, 2017.
Neighborhoods in Putbus
Percentage of businesses by neighborhood in Putbus
Price Distribution
Business distribution by price for Putbus
Human Development Index (HDI)
Statistic composite index of life expectancy, education, and per capita income.
Putbus CO2 Emissions
Carbon Dioxide (CO2) Emissions Per Capita in Tonnes Per Year
| Location | CO2 Emissions | CO2 Emissions Per Capita | CO2 Emissions Intensity |
|---|---|---|---|
| Putbus | 21,905 tn | 9.21 tn | 7,152.7 tons/km² |
| Mecklenburg-Vorpommern | 14,301,725 tn | 9.18 tn | 614.1 tons/km² |
| Germany | 755,339,039 tn | 9.36 tn | 2,108.8 tons/km² |
| 2013 CO2 emissions (tonnes/year) | 21,905 tn |
| 2013 CO2 emissions (tonnes/year) per capita | 9.21 tn |
| 2013 CO2 emissions intensity (tonnes/km²/year) | 7,152.7 tons/km² |
Recent Nearby Earthquakes
Magnitude 3.0 and greater
| Date▼ | Time↕ | Magnitude↕ | Distance↕ | Depth↕ | Location↕ | Link |
|---|---|---|---|---|---|---|
| 7/21/01 | 4:35 PM | 3.5 | 75 km | 10,000 m | Germany | usgs.gov |
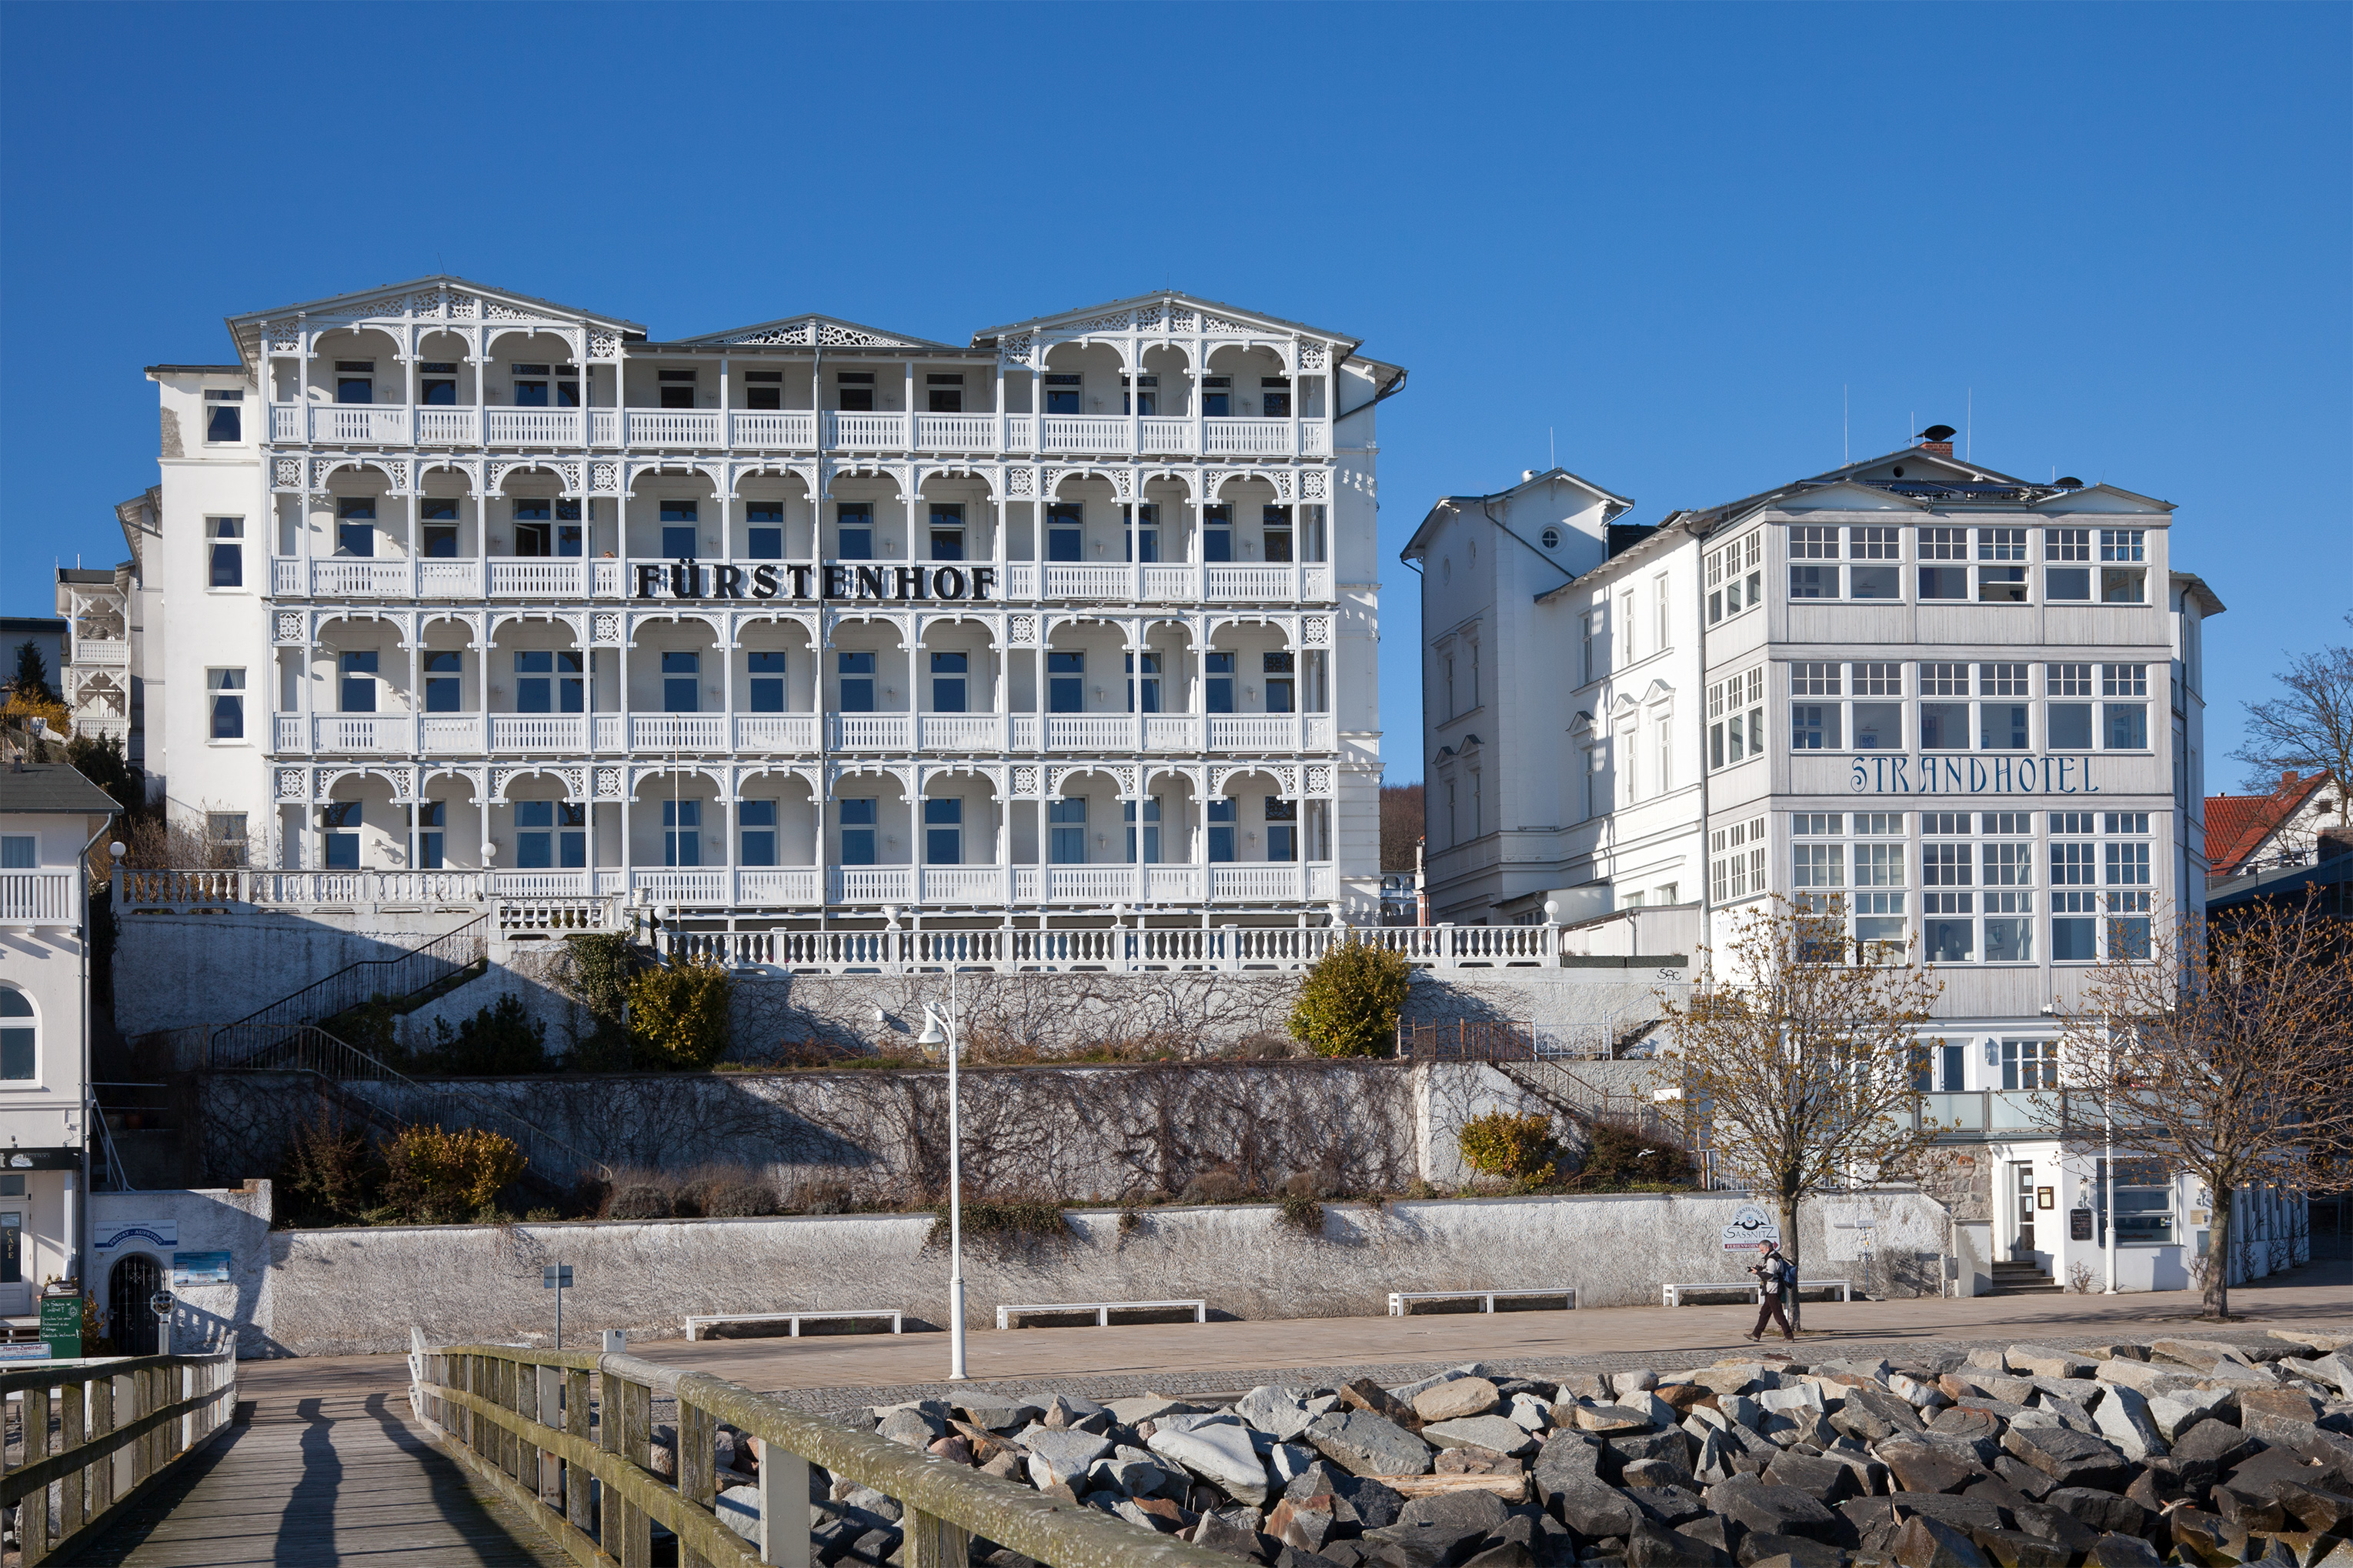
Putbus
Putbus is a town on the southeastern coast of the island of Rügen, in the county of Vorpommern-Rügen in the state of Mecklenburg-Western Pomerania, close to the Baltic Sea. The town has 4,741 inhabitants and is a significant tourist destination with ..
Putbus Wikipedia Page


About Our Data
The data on this page is estimated using a number of publicly available tools and resources. It is provided without warranty, and could contain inaccuracies. Use at your own risk.