Categories in Raunheim
Industries
Business Distribution by Industry in Raunheim
| Industry Description | Number of Establishments |
|---|---|
| Restaurants | 87 |
| Corporate management | 70 |
| Shopping | 58 |
| Electronics stores | 35 |
| Health and medical | 31 |
| Hairdressers | 30 |
| Construction of buildings | 29 |
| Real estate | 28 |
| Car repair | 27 |
| Beauty salons | 24 |
| Bars, pubs and taverns | 22 |
| Hotels and motels | 21 |
Raunheim Facts
| Area | 5.0 km² |
| Population | 12,357 |
| Male Population | 6,088 (49.3%) |
| Female Population | 6,269 (50.7%) |
| Population change (1975 to 2020) | +12.9% |
| Population change (2000 to 2020) | +0.0% |
| Median Age | 43.6 years (Male: 42.9, Female: 44.3) |
| Area Codes | 6142 |
| Neighborhoods | Höchst, Waldsee, Riedberg, Innenstadt, Linkenheim - Hochstetten |
| Local Time | |
| Timezone | Central European Summer Time |
| Lat & Lng | 50.01320, 8.45253 |
| Postal Codes | 65479 |
Map of Raunheim
Interactive Map
Raunheim Population
Years 1975 to 2020
| Data | 1975 | 1990 | 2000 | 2015 | 2020 |
|---|---|---|---|---|---|
| Population | 10,944 | 11,608 | 12,352 | 12,184 | 12,357 |
| Population Density | 2,188.8 / km² | 2,321.6 / km² | 2,470.4 / km² | 2,436.8 / km² | 2,471.4 / km² |
Raunheim Population change from 2000 to 2015
Decrease of 1.4% from year 2000 to 2015
| Location | Change since 1975 | Change since 1990 | Change since 2000 |
|---|---|---|---|
| Raunheim | +11.3% | +5% | -1.4% |
| Hesse | +9% | +5.7% | +0.4% |
| Germany | +2.6% | +2.2% | -1.5% |
Raunheim Median Age
Median Age: 43.6 years
| Location | Median Age | Median Age (Female) | Median Age (Male) |
|---|---|---|---|
| Raunheim | 43.6 yrs | 44.3 yrs | 42.9 yrs |
| Hesse | 44.2 yrs | 45.1 yrs | 43.3 yrs |
| Germany | 44.8 yrs | 46 yrs | 43.6 yrs |
Raunheim Population Density
Population Density: 2,471 / km²
| Location | Population | Area | Density |
|---|---|---|---|
| Raunheim | 12,357 | 5 km² | 2,471 / km² |
| Hesse | 6 million | 21,118.3 km² | 286 / km² |
| Germany | 80.7 million | 358,179.8 km² | 225 / km² |
Raunheim Historical and Projected Population
Estimated Population from 1200 to 2100
- JRC (European Commission's Joint Research Centre) work on the GHS built-up grid
- CIESIN (Center for International Earth Science Information Network)
- [Link] Klein Goldewijk, K., Beusen, A., Doelman, J., and Stehfest, E.: Anthropogenic land use estimates for the Holocene – HYDE 3.2, Earth Syst. Sci. Data, 9, 927–953, https://doi.org/10.5194/essd-9-927-2017, 2017.
Price Distribution
Business distribution by price for Raunheim
Human Development Index (HDI)
Statistic composite index of life expectancy, education, and per capita income.
Raunheim CO2 Emissions
Carbon Dioxide (CO2) Emissions Per Capita in Tonnes Per Year
| Location | CO2 Emissions | CO2 Emissions Per Capita | CO2 Emissions Intensity |
|---|---|---|---|
| Raunheim | 127,444 tn | 10.31 tn | 25,488.7 tons/km² |
| Hesse | 61,074,998 tn | 10.11 tn | 2,892 tons/km² |
| Germany | 755,339,039 tn | 9.36 tn | 2,108.8 tons/km² |
| 2013 CO2 emissions (tonnes/year) | 127,444 tn |
| 2013 CO2 emissions (tonnes/year) per capita | 10.31 tn |
| 2013 CO2 emissions intensity (tonnes/km²/year) | 25,488.7 tons/km² |
Natural Hazards Risk
Relative risk out of 10
| Hazard | Risk Level |
|---|---|
| Flood | High (9) |
| Earthquake | Low (2) |
* Risk, particularly concerning flood or landslide, may not be for the entire area.
- Dilley, M., R.S. Chen, U. Deichmann, A.L. Lerner-Lam, M. Arnold, J. Agwe, P. Buys, O. Kjekstad, B. Lyon, and G. Yetman. 2005. Natural Disaster Hotspots: A Global Risk Analysis. Washington, D.C.: World Bank. https://doi.org/10.1596/0-8213-5930-4.
- Center for Hazards and Risk Research - CHRR - Columbia University, Center for International Earth Science Information Network - CIESIN - Columbia University. 2005. Global Flood Hazard Frequency and Distribution. Palisades, NY: NASA Socioeconomic Data and Applications Center (SEDAC). https://doi.org/10.7927/H4668B3D.
- Center for Hazards and Risk Research - CHRR - Columbia University, Center for International Earth Science Information Network - CIESIN - Columbia University. 2005. Global Earthquake Hazard Distribution - Peak Ground Acceleration. Palisades, NY: NASA Socioeconomic Data and Applications Center (SEDAC). https://doi.org/10.7927/H4BZ63ZS.
Recent Nearby Earthquakes
Magnitude 3.0 and greater
| Date▼ | Time↕ | Magnitude↕ | Distance↕ | Depth↕ | Location↕ | Link |
|---|---|---|---|---|---|---|
| 5/17/14 | 4:46 PM | 3.6 | 27.6 km | 10,000 m | 2km SE of Pfungstadt, Germany | usgs.gov |
| 2/14/11 | 12:43 PM | 3.9 | 56.8 km | 12,000 m | Germany | usgs.gov |
| 12/23/10 | 1:35 AM | 3.4 | 16.5 km | 9,000 m | Germany | usgs.gov |
| 6/29/10 | 12:42 AM | 3.4 | 10.4 km | 10,000 m | Germany | usgs.gov |
| 4/11/10 | 11:16 AM | 3.4 | 88.1 km | 5,000 m | Germany | usgs.gov |
| 9/29/08 | 1:36 PM | 3 | 83.5 km | 14,800 m | Germany | usgs.gov |
| 12/13/07 | 2:11 PM | 3 | 43.2 km | 10,000 m | Germany | usgs.gov |
| 11/20/07 | 8:22 AM | 3 | 50.6 km | 10,000 m | Germany | usgs.gov |
| 8/3/07 | 2:58 AM | 4.4 | 96.9 km | 10,000 m | Germany | usgs.gov |
| 4/11/07 | 5:01 PM | 3.3 | 83.9 km | 11,500 m | Germany | usgs.gov |
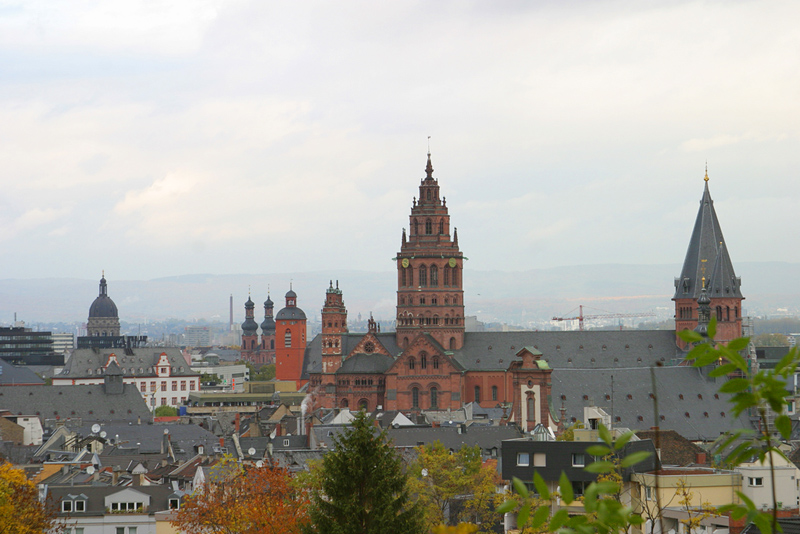
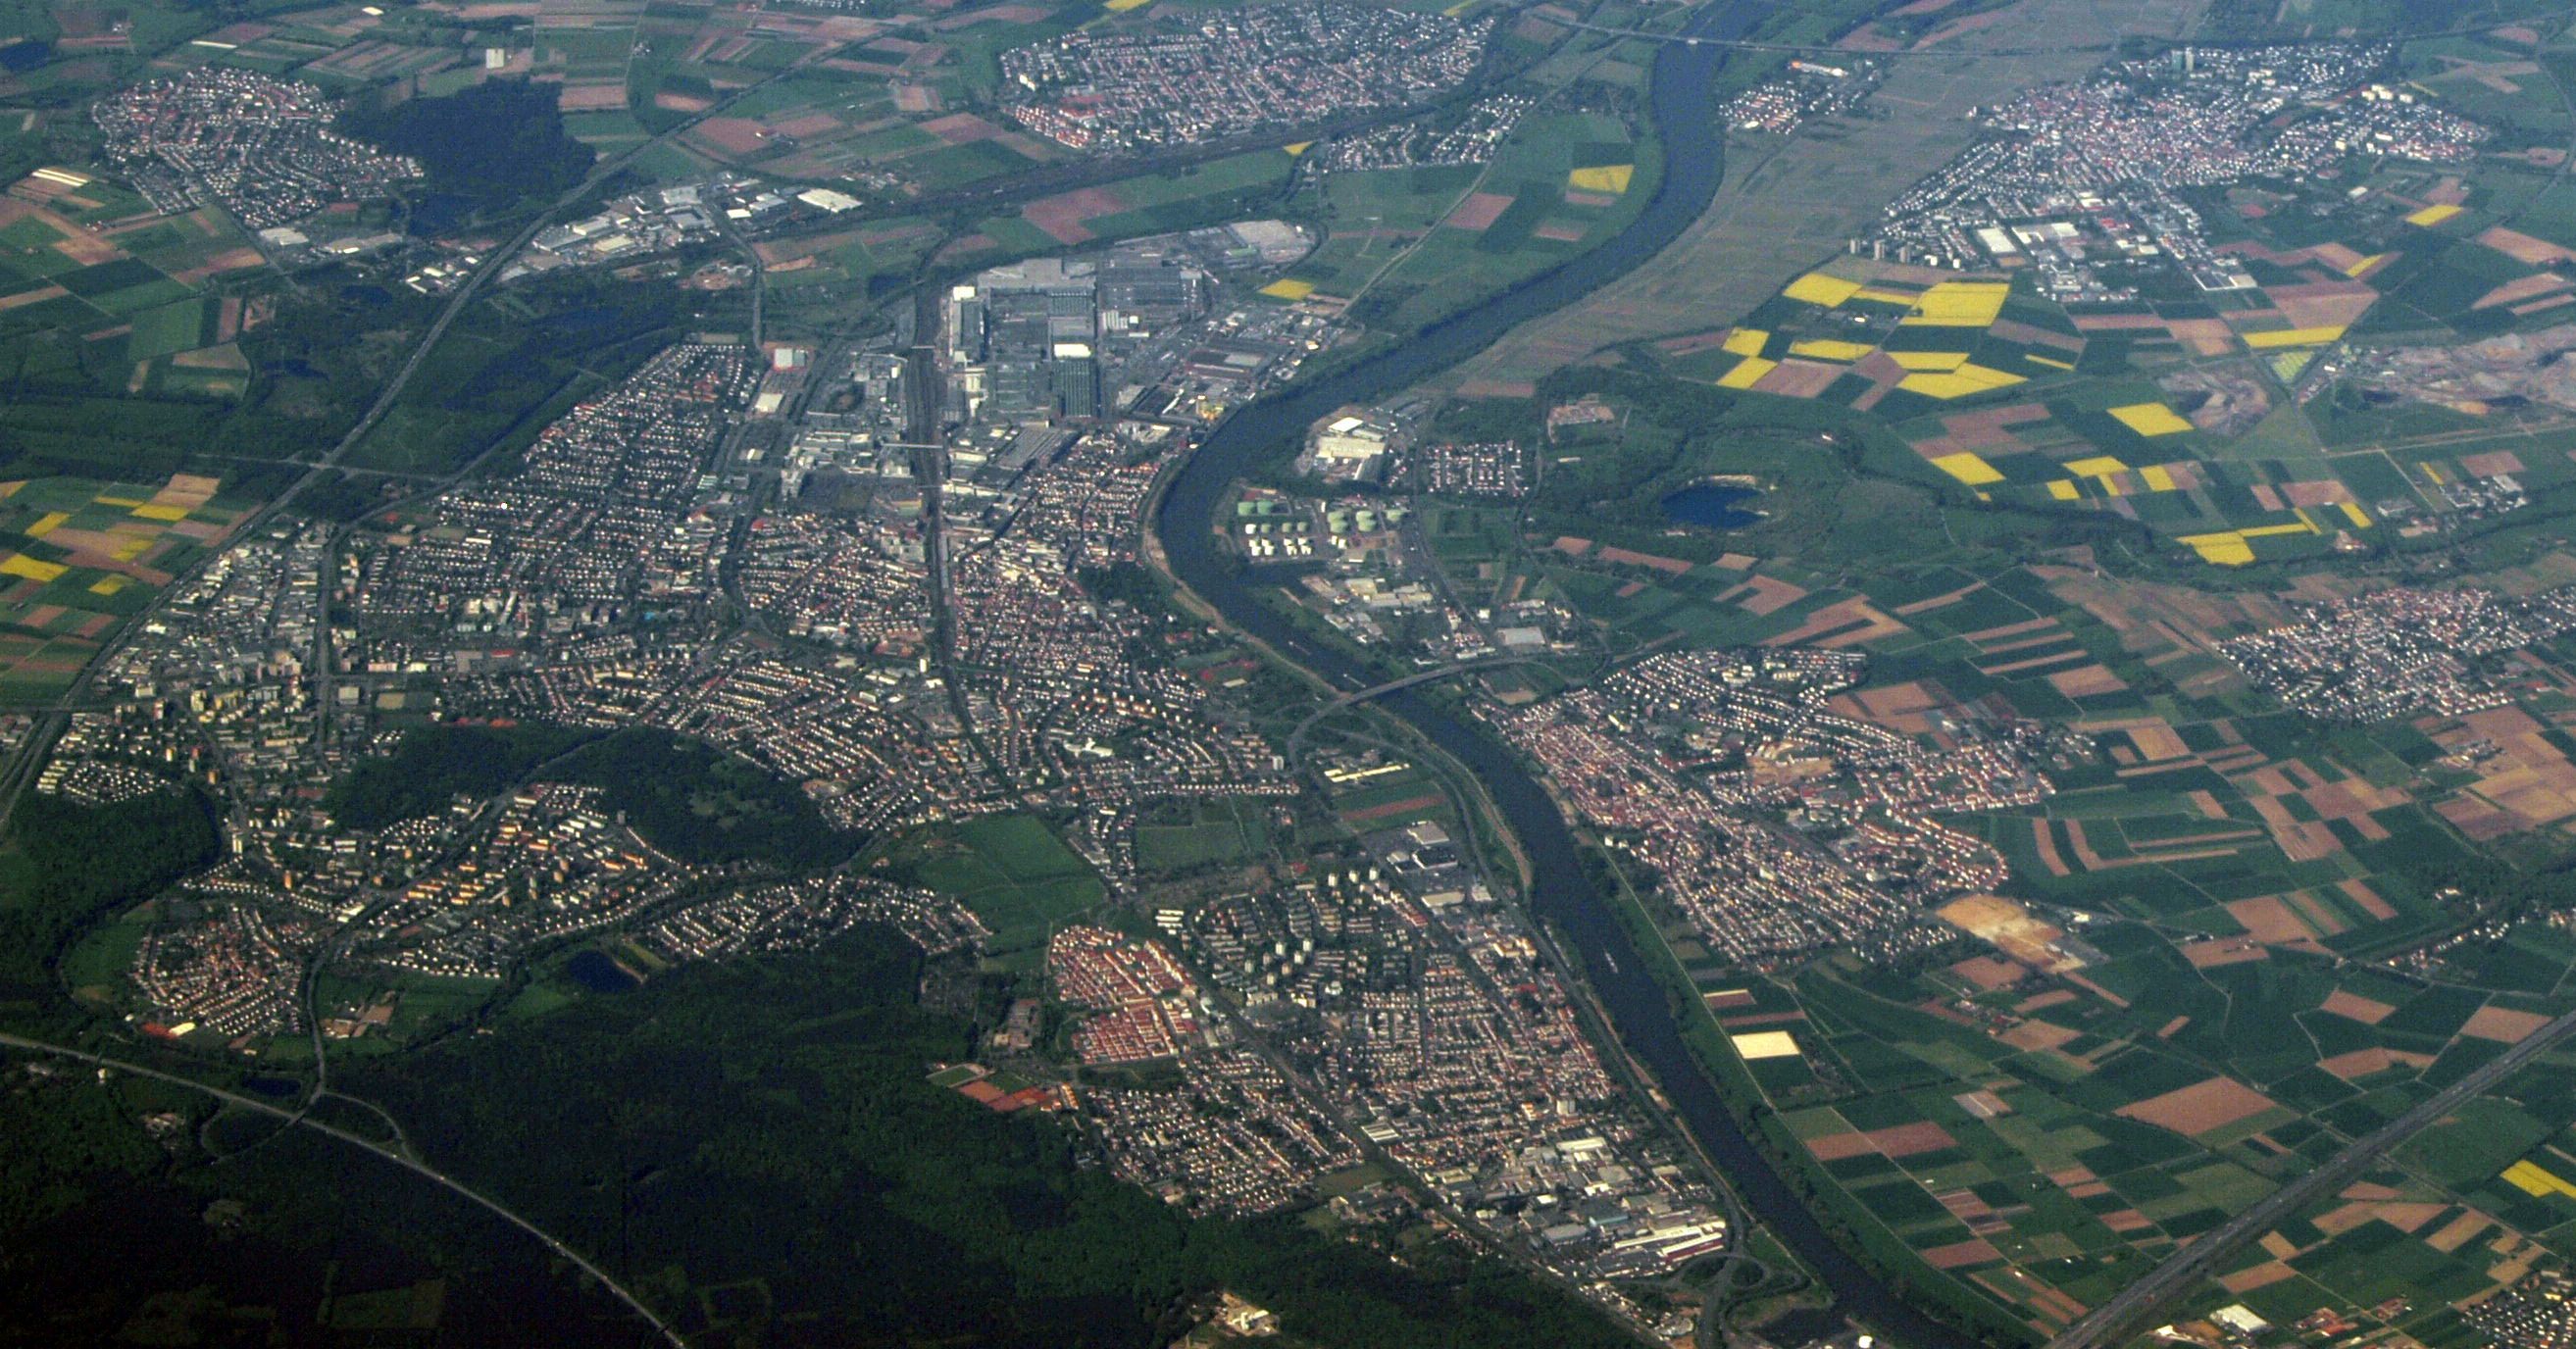
Raunheim
Raunheim is a town in Groß-Gerau district in Hesse, Germany and a part of the Frankfurt Urban Region as well as the Frankfurt Rhein-Main Region.
Raunheim Wikipedia Page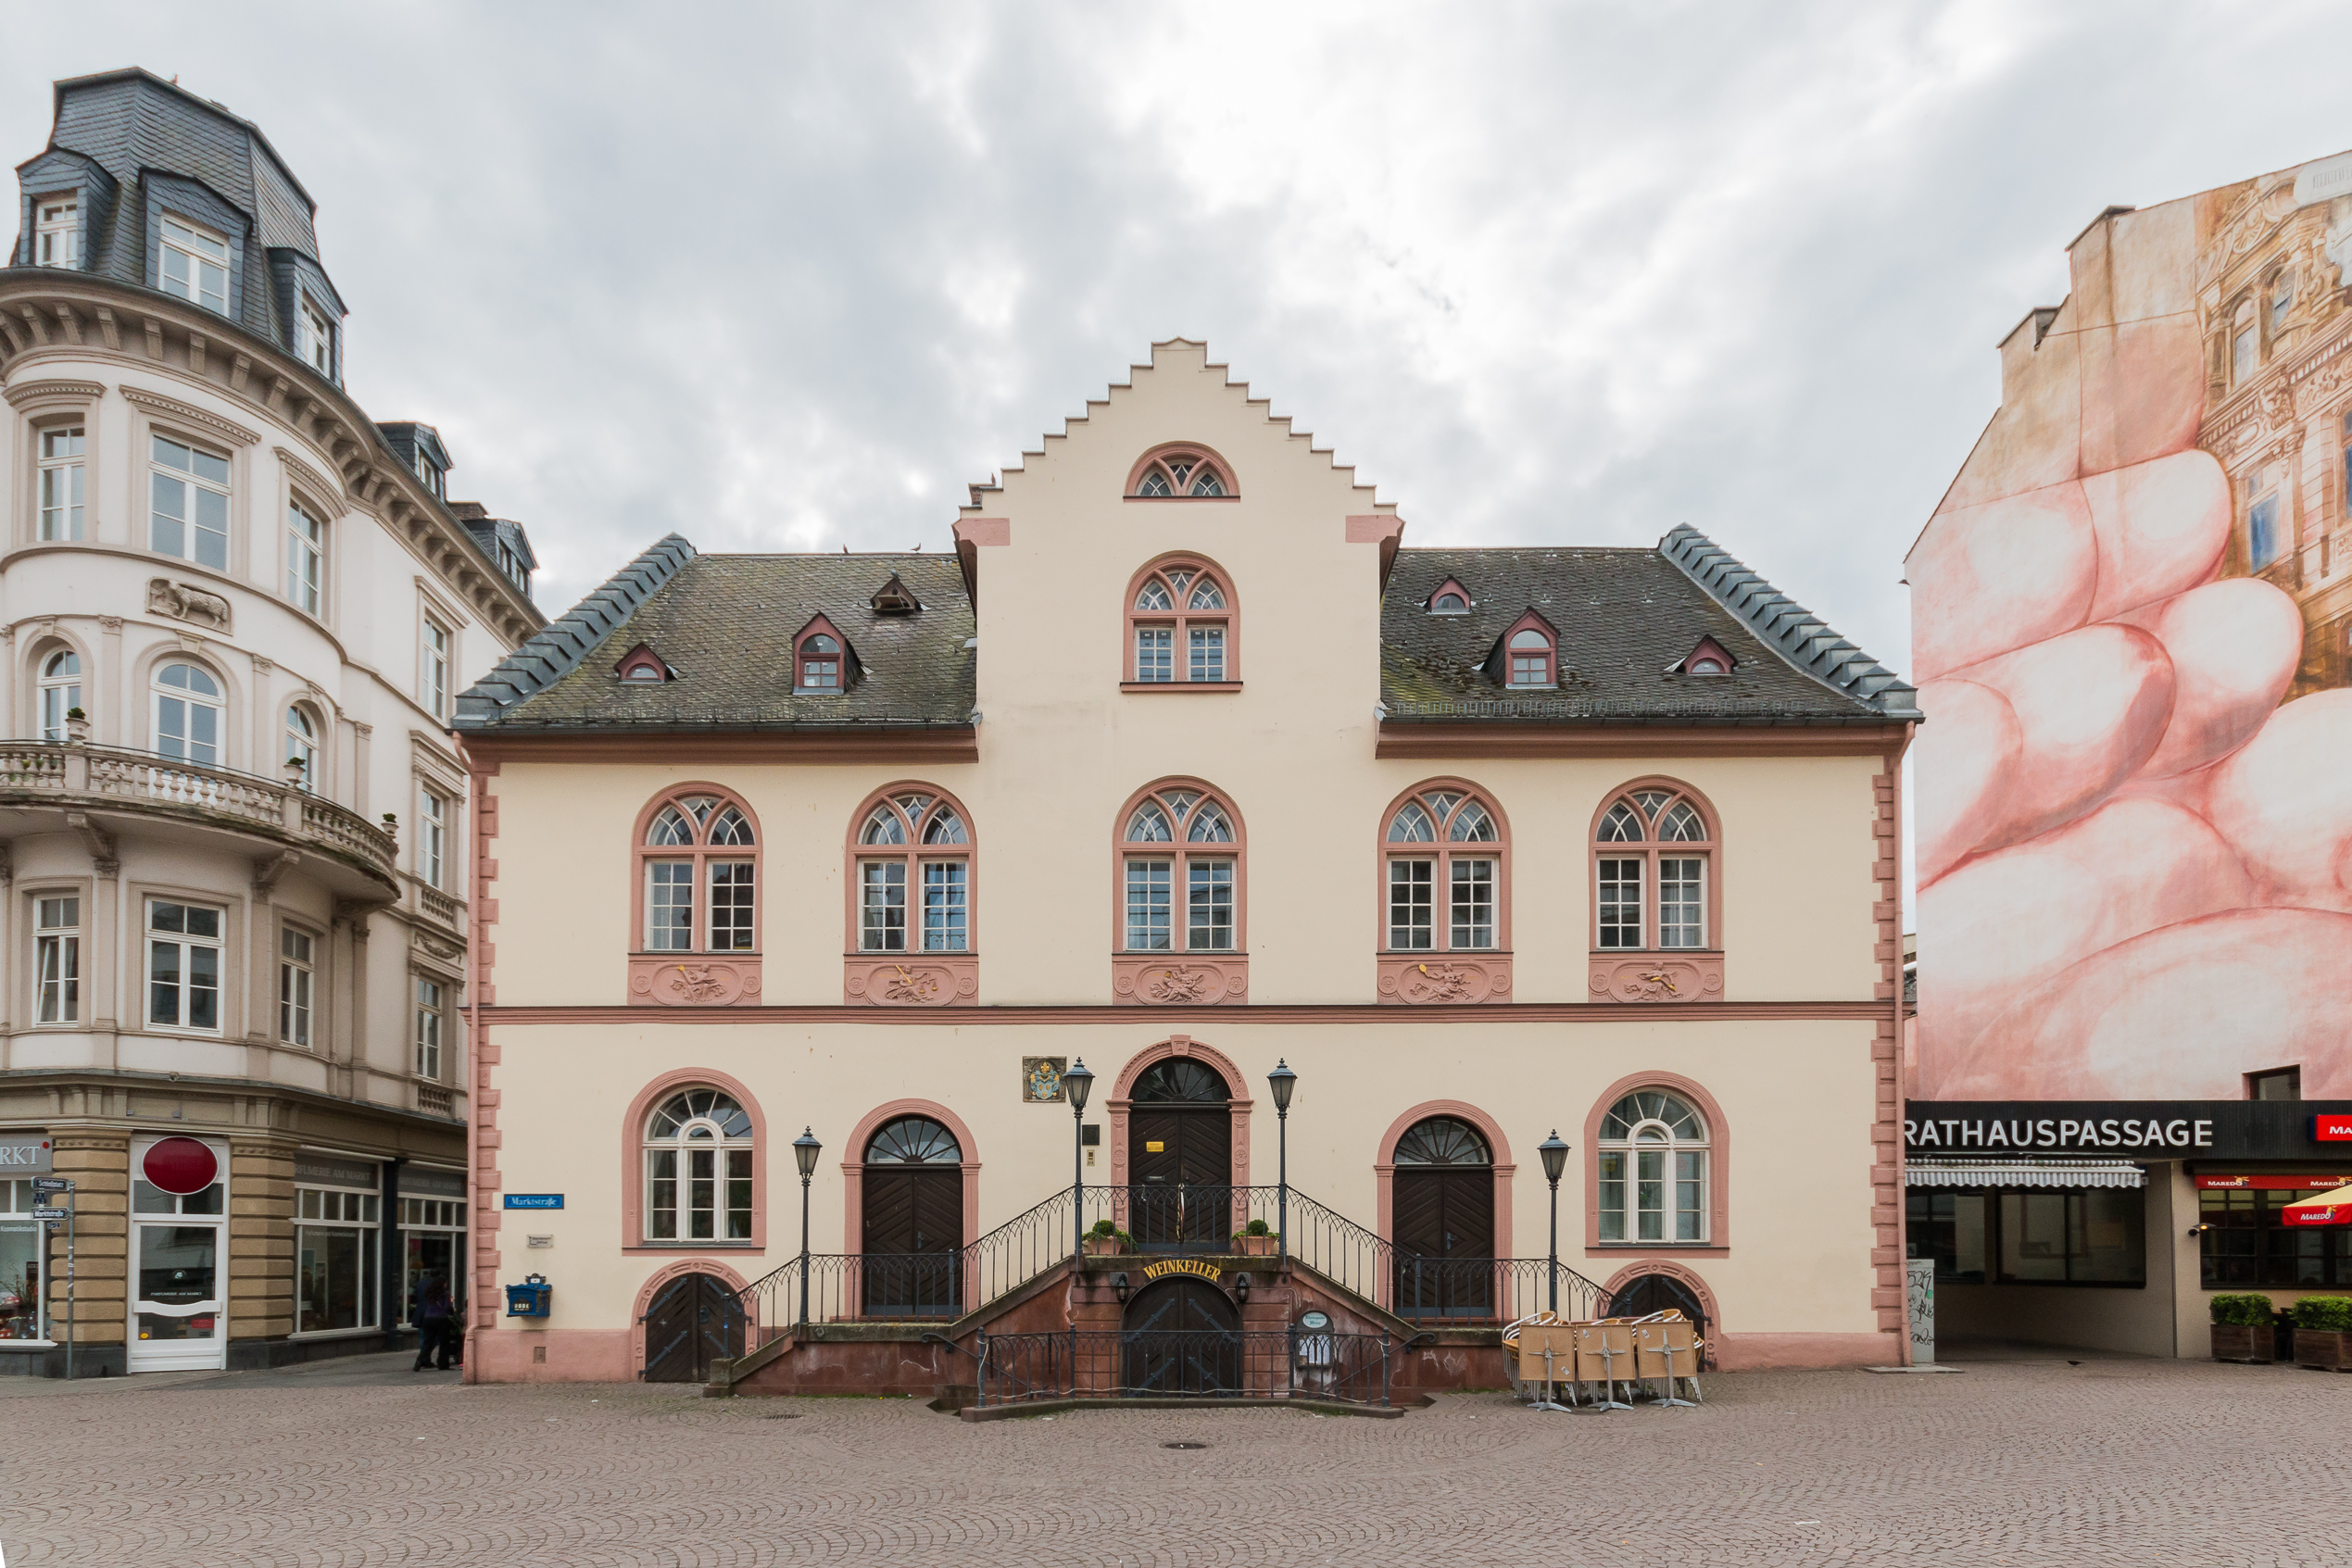
About Our Data
The data on this page is estimated using a number of publicly available tools and resources. It is provided without warranty, and could contain inaccuracies. Use at your own risk.