Categories in Templin
Industries
Business Distribution by Industry in Templin
| Industry Description | Number of Establishments |
|---|---|
| Health and medical | 112 |
| Restaurants | 86 |
| Shopping | 80 |
| Other accommodation | 74 |
| Corporate management | 62 |
| Other membership organizations | 60 |
| Buses and trains | 53 |
| Financial services | 46 |
| Real estate | 44 |
| Car repair | 42 |
| Construction of buildings | 42 |
| Hairdressers | 36 |
| Travel agencies | 33 |
| Electrical installation | 32 |
| Dentists | 32 |
| Churches | 31 |
Templin Facts
| Area | 5.1 km² |
| Population | 5,736 |
| Male Population | 2,811 (49.0%) |
| Female Population | 2,925 (51.0%) |
| Population change (1975 to 2020) | -57.1% |
| Population change (2000 to 2020) | -34.7% |
| Median Age | 49.5 years (Male: 48.1, Female: 51) |
| Area Codes | 3987, 39882, 39883, 39885 |
| Neighborhoods | Hindenburg, Hammelspring, Vietmannsdorf, Groß Dölln, Röddelin |
| Local Time | |
| Timezone | Central European Summer Time |
| Lat & Lng | 53.11865, 13.50220 |
Map of Templin
Interactive Map
Templin Population
Years 1975 to 2020
| Data | 1975 | 1990 | 2000 | 2015 | 2020 |
|---|---|---|---|---|---|
| Population | 13,364 | 10,439 | 8,786 | 5,935 | 5,736 |
| Population Density | 2,639.8 / km² | 2,062 / km² | 1,735.5 / km² | 1,172.3 / km² | 1,133 / km² |
Templin Population change from 2000 to 2015
Decrease of 32.4% from year 2000 to 2015
| Location | Change since 1975 | Change since 1990 | Change since 2000 |
|---|---|---|---|
| Templin | -55.6% | -43.1% | -32.4% |
| Brandenburg | -10% | -4.8% | -5.1% |
| Germany | +2.6% | +2.2% | -1.5% |
Templin Median Age
Median Age: 49.5 years
| Location | Median Age | Median Age (Female) | Median Age (Male) |
|---|---|---|---|
| Templin | 49.5 yrs | 51 yrs | 48.1 yrs |
| Brandenburg | 47.6 yrs | 48.8 yrs | 46.4 yrs |
| Germany | 44.8 yrs | 46 yrs | 43.6 yrs |
Templin Population Density
Population Density: 1,133 / km²
| Location | Population | Area | Density |
|---|---|---|---|
| Templin | 5,736 | 5.1 km² | 1,133 / km² |
| Brandenburg | 2.5 million | 29,652.8 km² | 83.3 / km² |
| Germany | 80.7 million | 358,179.8 km² | 225 / km² |
Templin Historical and Projected Population
Estimated Population from 0 to 2100
- JRC (European Commission's Joint Research Centre) work on the GHS built-up grid
- CIESIN (Center for International Earth Science Information Network)
- [Link] Klein Goldewijk, K., Beusen, A., Doelman, J., and Stehfest, E.: Anthropogenic land use estimates for the Holocene – HYDE 3.2, Earth Syst. Sci. Data, 9, 927–953, https://doi.org/10.5194/essd-9-927-2017, 2017.
Neighborhoods in Templin
Percentage of businesses by neighborhood in Templin
Price Distribution
Business distribution by price for Templin
Human Development Index (HDI)
Statistic composite index of life expectancy, education, and per capita income.
Templin CO2 Emissions
Carbon Dioxide (CO2) Emissions Per Capita in Tonnes Per Year
| Location | CO2 Emissions | CO2 Emissions Per Capita | CO2 Emissions Intensity |
|---|---|---|---|
| Templin | 48,979 tn | 8.54 tn | 9,674.9 tons/km² |
| Brandenburg | 22,189,824 tn | 8.99 tn | 748.3 tons/km² |
| Germany | 755,339,039 tn | 9.36 tn | 2,108.8 tons/km² |
| 2013 CO2 emissions (tonnes/year) | 48,979 tn |
| 2013 CO2 emissions (tonnes/year) per capita | 8.54 tn |
| 2013 CO2 emissions intensity (tonnes/km²/year) | 9,674.9 tons/km² |
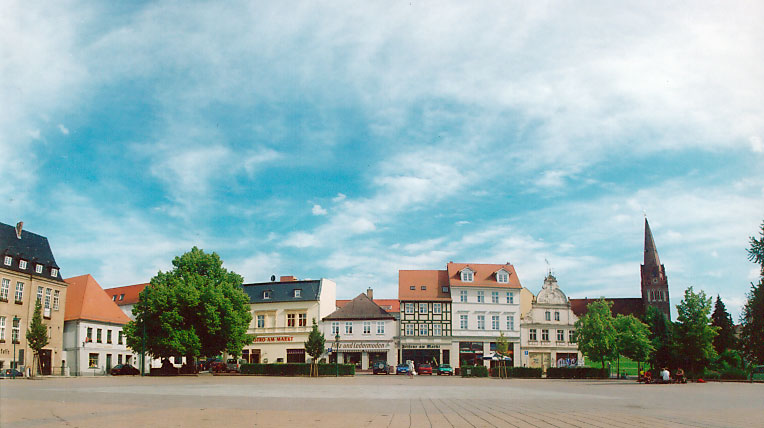
Templin
Templin is a small town in the Uckermark district of Brandenburg, Germany. Though it has a population of only 17,127 (2006), it is with 377.01 km2 (145.56 sq mi) the second largest town in Brandenburg (after Wittstock) and the seventh largest town in..
Templin Wikipedia Page


About Our Data
The data on this page is estimated using a number of publicly available tools and resources. It is provided without warranty, and could contain inaccuracies. Use at your own risk.