Categories in Haslev
Industries
Business Distribution by Industry in Haslev
| Industry Description | Number of Establishments | Average Age of Business |
|---|---|---|
| Construction of buildings | 207 | 30 years |
| Shopping other | 135 | 20 years |
| Corporate management | 129 | 23 years |
| Shopping | 108 | 28 years |
| Technical construction services | 99 | 21 years |
| Unreachable | 84 | 25 years |
| Landscaping | 79 | 25 years |
| Kitchen and bath cabinets and remodel | 77 | 16 years |
| Car repair | 65 | 22 years |
Haslev Facts
| Area | 8.1 km² |
| Population | 9,007 |
| Male Population | 4,447 (49.4%) |
| Female Population | 4,560 (50.6%) |
| Population change (1975 to 2020) | +1.0% |
| Population change (2000 to 2020) | -3.2% |
| Median Age | 41.1 years (Male: 39.8, Female: 42.3) |
| Neighborhoods | Valby, Vestegnen, Østerbros |
| Local Time | |
| Timezone | Central European Summer Time |
| Lat & Lng | 55.32346, 11.96389 |
| Postal Codes | 4690 |
Map of Haslev
Interactive Map
Haslev Population
Years 1975 to 2020
| Data | 1975 | 1990 | 2000 | 2015 | 2020 |
|---|---|---|---|---|---|
| Population | 8,918 | 9,270 | 9,300 | 8,837 | 9,007 |
| Population Density | 1,106.1 / km² | 1,149.8 / km² | 1,153.5 / km² | 1,096.1 / km² | 1,117.1 / km² |
Haslev Population change from 2000 to 2015
Decrease of 5% from year 2000 to 2015
| Location | Change since 1975 | Change since 1990 | Change since 2000 |
|---|---|---|---|
| Haslev | -0.9% | -4.7% | -5% |
| Region Zealand | +2.2% | +1.7% | +0.6% |
| Denmark | +12.1% | +10.4% | +6.3% |
Haslev Median Age
Median Age: 41.1 years
| Location | Median Age | Median Age (Female) | Median Age (Male) |
|---|---|---|---|
| Haslev | 41.1 yrs | 42.3 yrs | 39.8 yrs |
| Region Zealand | 42.9 yrs | 43.7 yrs | 42.2 yrs |
| Denmark | 40.5 yrs | 41.3 yrs | 39.6 yrs |
Haslev Population Density
Population Density: 1,117 / km²
| Location | Population | Area | Density |
|---|---|---|---|
| Haslev | 9,007 | 8.1 km² | 1,117 / km² |
| Region Zealand | 802,458 | 7,343.5 km² | 109 / km² |
| Denmark | 5.5 million | 43,072 km² | 129 / km² |
Haslev Historical and Projected Population
Estimated Population from 0 to 2100
- JRC (European Commission's Joint Research Centre) work on the GHS built-up grid
- CIESIN (Center for International Earth Science Information Network)
- [Link] Klein Goldewijk, K., Beusen, A., Doelman, J., and Stehfest, E.: Anthropogenic land use estimates for the Holocene – HYDE 3.2, Earth Syst. Sci. Data, 9, 927–953, https://doi.org/10.5194/essd-9-927-2017, 2017.
Price Distribution
Business distribution by price for Haslev
Human Development Index (HDI)
Statistic composite index of life expectancy, education, and per capita income.
Haslev CO2 Emissions
Carbon Dioxide (CO2) Emissions Per Capita in Tonnes Per Year
| Location | CO2 Emissions | CO2 Emissions Per Capita | CO2 Emissions Intensity |
|---|---|---|---|
| Haslev | 97,303 tn | 10.8 tn | 12,068.6 tons/km² |
| Region Zealand | 8,459,301 tn | 10.54 tn | 1,151.9 tons/km² |
| Denmark | 59,647,725 tn | 10.75 tn | 1,384.8 tons/km² |
| 2013 CO2 emissions (tonnes/year) | 97,303 tn |
| 2013 CO2 emissions (tonnes/year) per capita | 10.8 tn |
| 2013 CO2 emissions intensity (tonnes/km²/year) | 12,068.6 tons/km² |
Recent Nearby Earthquakes
Magnitude 3.0 and greater
| Date▼ | Time↕ | Magnitude↕ | Distance↕ | Depth↕ | Location↕ | Link |
|---|---|---|---|---|---|---|
| 12/16/08 | 5:20 AM | 4.3 | 94 km | 10,000 m | Sweden | usgs.gov |
| 2/3/05 | 5:49 PM | 3 | 98.9 km | 0 m | Denmark | usgs.gov |
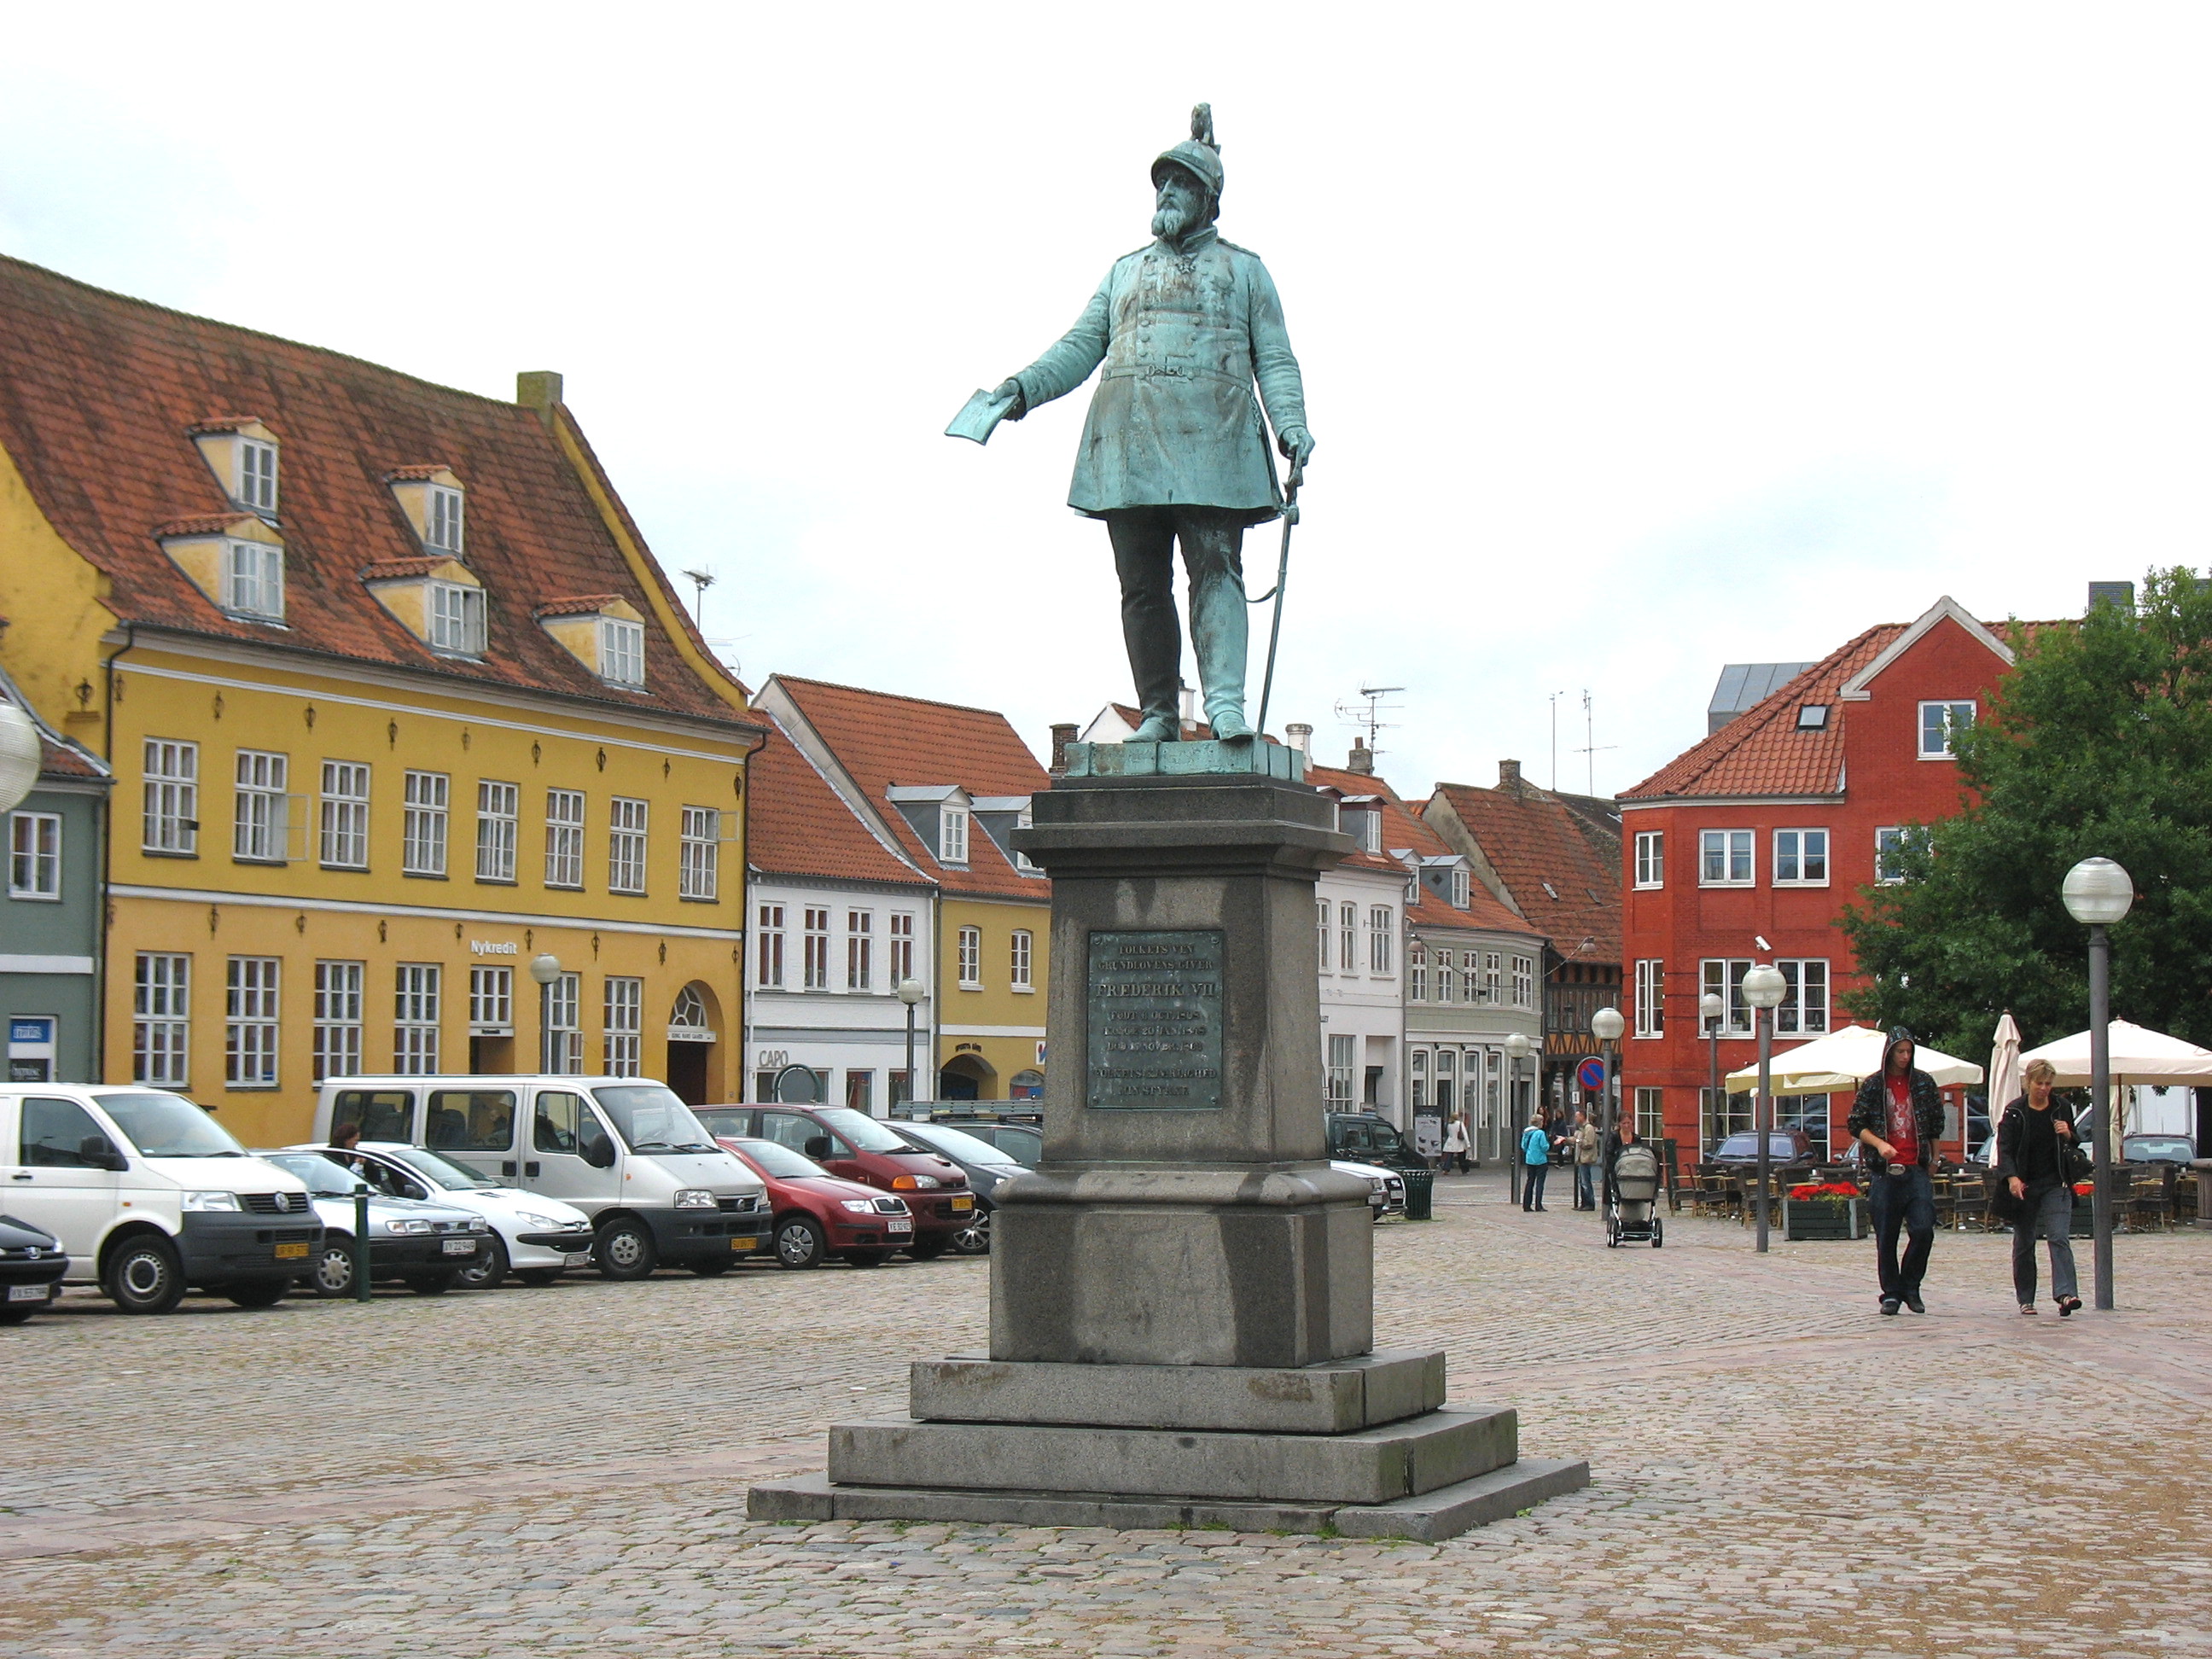
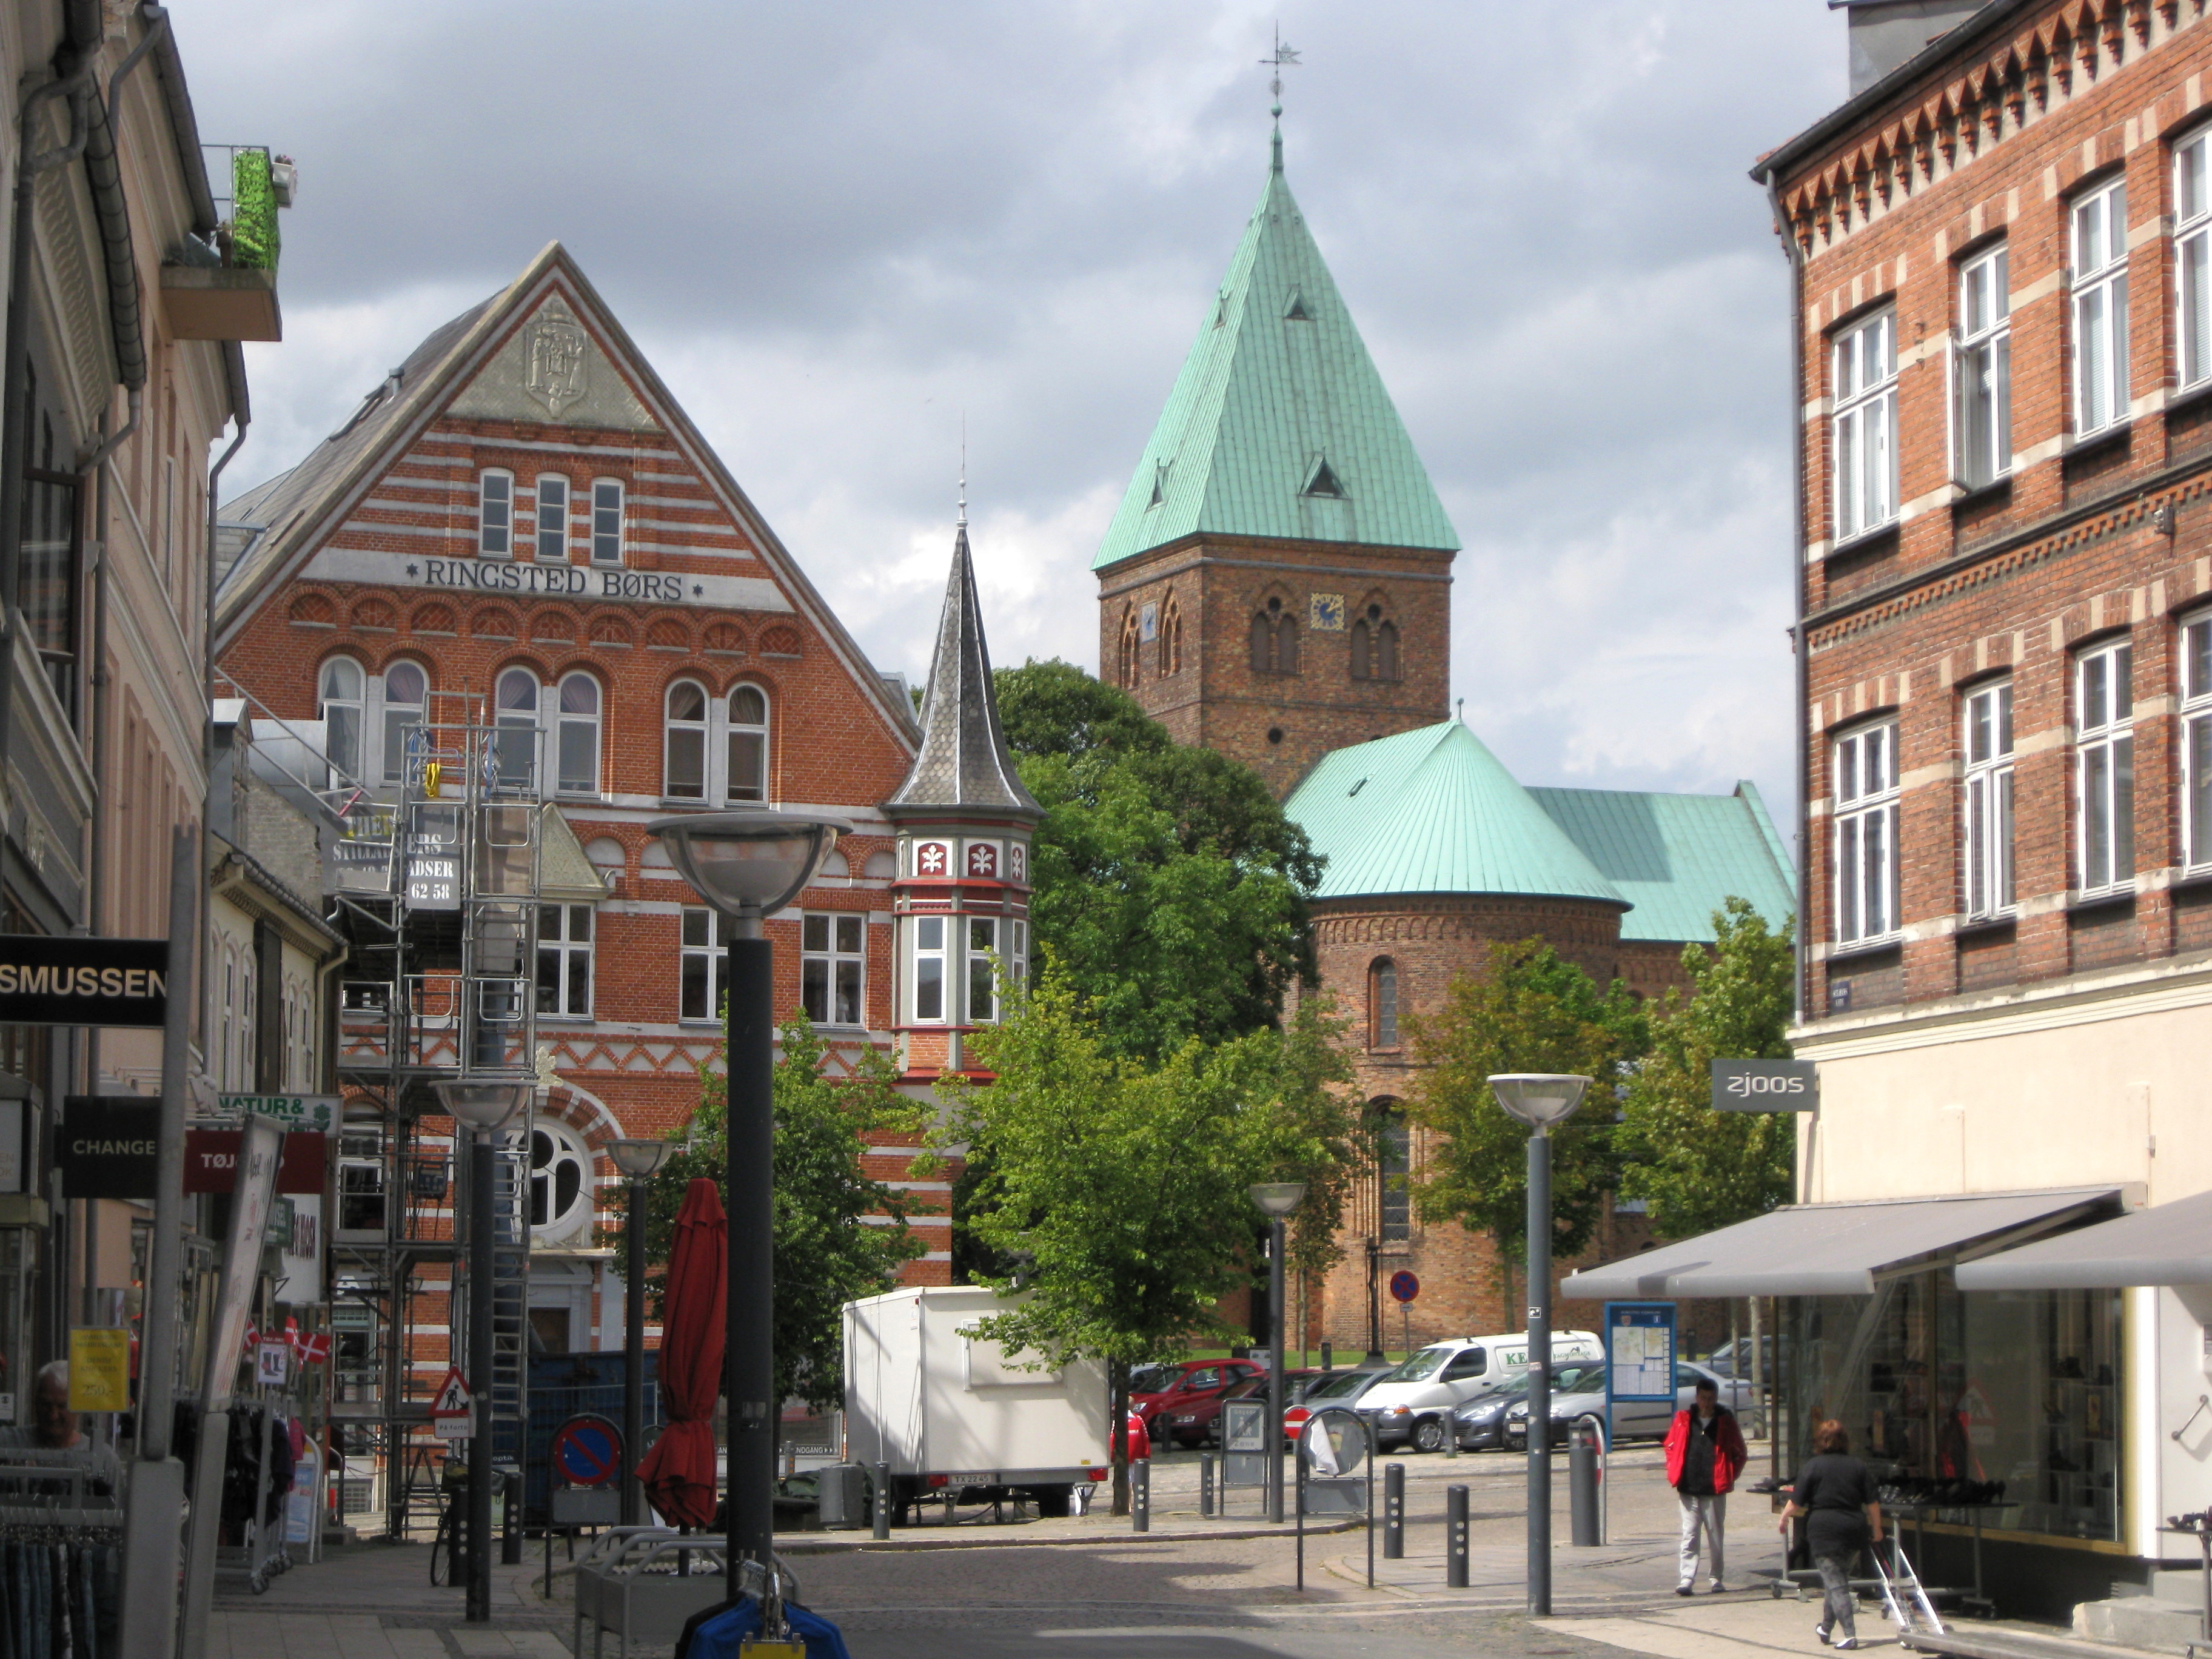
Haslev
Haslev, a town in Faxe municipality, lies in the southern part of Zealand, Denmark. About 60 km (37 mi) from Copenhagen, it has a population of 11,407 (1 January 2015). is popularly known as the school town with the green surroundings (skolebyen i d..
Haslev Wikipedia Page

About Our Data
The data on this page is estimated using a number of publicly available tools and resources. It is provided without warranty, and could contain inaccuracies. Use at your own risk.