Categories in Slangerup
Auto Parts StoreCar repairCar Repair and MaintenanceCar WashGas StationMotorcycle DealerNew car dealersComputer WholesalerFarmingJoinerMachines WholesaleClothing storesWomen's clothingAssociation or OrganizationCity or Town HallCultural AssociationDay Care CenterHomeowners' AssociationHuman Rights AssociationPolitical PartyProfessional and Hobby AssociationsShipping CompanyComputer ConsultantInformation servicesSoftware CompanySoftware ConsultantArchitectsArchitecture FirmBricklayerBuilding Construction ContractorCarpenterConstruction of buildingsContractorElectrical Installation ServiceElectricianEngineerEngineering Consultancy OfficeFlooring ServicesGeneral contractorsHeating installation and repairHVAC ContractorInsulation ContractorKitchen and bath cabinets and remodelMasonry ContractorPainting and paint contractorsPlumbing installation and repairWater Utility CompanyWindow Installation ServiceDriving schoolsEducation
Showing 1-50 of 116
Industries
Business Distribution by Industry in Slangerup
| Industry Description | Number of Establishments | Average Age of Business |
|---|---|---|
| Construction of buildings | 152 | 15 years |
| Corporate management | 120 | 26 years |
| Shopping | 85 | 24 years |
| Shopping other | 77 | 32 years |
| Technical construction services | 70 | 25 years |
| Other construction | 61 | 22 years |
| Unreachable | 45 | 19 years |
| Landscaping | 44 | 15 years |
| Travel and transportation | 44 | — |
Slangerup Facts
| Area | 3.4 km² |
| Population | 5,690 |
| Male Population | 2,787 (49.0%) |
| Female Population | 2,903 (51.0%) |
| Population change (1975 to 2020) | -19.4% |
| Population change (2000 to 2020) | -10.2% |
| Median Age | 39.9 years (Male: 39.6, Female: 40.1) |
| Neighborhoods | Vestegnen, Northern Suburbs, Hellerup, Indre By, Nørrebro |
| Local Time | |
| Timezone | Central European Summer Time |
| Lat & Lng | 55.85000, 12.18333 |
| Postal Codes | 3550 |
Map of Slangerup
Interactive Map
Slangerup Population
Years 1975 to 2020
| Data | 1975 | 1990 | 2000 | 2015 | 2020 |
|---|---|---|---|---|---|
| Population | 7,058 | 6,641 | 6,339 | 5,525 | 5,690 |
| Population Density | 2,091.3 / km² | 1,967.7 / km² | 1,878.2 / km² | 1,637 / km² | 1,685.9 / km² |
Sources: JRC (European Commission's Joint Research Centre) work on the GHS built-up grid
Slangerup Population change from 2000 to 2015
Decrease of 12.8% from year 2000 to 2015
| Location | Change since 1975 | Change since 1990 | Change since 2000 |
|---|---|---|---|
| Slangerup | -21.7% | -16.8% | -12.8% |
| Capital Region of Denmark | +36.4% | +22.8% | +13.4% |
| Denmark | +12.1% | +10.4% | +6.3% |
Sources: JRC (European Commission's Joint Research Centre) work on the GHS built-up grid
Slangerup Median Age
Median Age: 39.9 years
| Location | Median Age | Median Age (Female) | Median Age (Male) |
|---|---|---|---|
| Slangerup | 39.9 yrs | 40.1 yrs | 39.6 yrs |
| Capital Region of Denmark | 38.9 yrs | 39.7 yrs | 38 yrs |
| Denmark | 40.5 yrs | 41.3 yrs | 39.6 yrs |
Sources: CIESIN (Center for International Earth Science Information Network)
Slangerup Population Density
Population Density: 1,686 / km²
| Location | Population | Area | Density |
|---|---|---|---|
| Slangerup | 5,690 | 3.375 km² | 1,686 / km² |
| Capital Region of Denmark | 1.7 million | 2,602.8 km² | 670 / km² |
| Denmark | 5.5 million | 43,072 km² | 129 / km² |
Sources: JRC (European Commission's Joint Research Centre) work on the GHS built-up grid
Slangerup Historical and Projected Population
Estimated Population from 0 to 2100
Sources:
- JRC (European Commission's Joint Research Centre) work on the GHS built-up grid
- CIESIN (Center for International Earth Science Information Network)
- [Link] Klein Goldewijk, K., Beusen, A., Doelman, J., and Stehfest, E.: Anthropogenic land use estimates for the Holocene – HYDE 3.2, Earth Syst. Sci. Data, 9, 927–953, https://doi.org/10.5194/essd-9-927-2017, 2017.
Price Distribution
Business distribution by price for Slangerup
Human Development Index (HDI)
Statistic composite index of life expectancy, education, and per capita income.
Source: [Link] Kummu, M., Taka, M. &Guillaume, J. Gridded global datasets for Gross Domestic Product and Human Development Index over 1990–2015. Sci Data 5, 180004 (2018) doi:10.1038/sdata.2018.4
Slangerup CO2 Emissions
Carbon Dioxide (CO2) Emissions Per Capita in Tonnes Per Year
| Location | CO2 Emissions | CO2 Emissions Per Capita | CO2 Emissions Intensity |
|---|---|---|---|
| Slangerup | 60,935 tn | 10.71 tn | 18,055 tons/km² |
| Capital Region of Denmark | 18,123,923 tn | 10.4 tn | 6,963.3 tons/km² |
| Denmark | 59,647,725 tn | 10.75 tn | 1,384.8 tons/km² |
Sources: [Link] Moran, D., Kanemoto K; Jiborn, M., Wood, R., Többen, J., and Seto, K.C. (2018) Carbon footprints of 13,000 cities. Environmental Research Letters DOI: 10.1088/1748-9326/aac72a
Slangerup CO2 Emissions
| 2013 CO2 emissions (tonnes/year) | 60,935 tn |
| 2013 CO2 emissions (tonnes/year) per capita | 10.71 tn |
| 2013 CO2 emissions intensity (tonnes/km²/year) | 18,055 tons/km² |
Recent Nearby Earthquakes
Magnitude 3.0 and greater
| Date▼ | Time↕ | Magnitude↕ | Distance↕ | Depth↕ | Location↕ | Link |
|---|---|---|---|---|---|---|
| 8/6/12 | 2:57 AM | 4.2 | 84.7 km | 9,800 m | Sweden | usgs.gov |
| 12/16/08 | 5:20 AM | 4.3 | 85.8 km | 10,000 m | Sweden | usgs.gov |
| 2/3/05 | 5:49 PM | 3 | 57.1 km | 0 m | Denmark | usgs.gov |
| 2/3/05 | 3:49 PM | 3 | 69.5 km | 100 m | Denmark | usgs.gov |
| 10/4/95 | 8:49 PM | 3.9 | 94.6 km | 10,000 m | Sweden | usgs.gov |
| 4/1/86 | 9:56 AM | 4.2 | 63.9 km | 33,000 m | Sweden | usgs.gov |
| 6/15/85 | 12:40 AM | 4.4 | 67.8 km | 33,000 m | Sweden | usgs.gov |
Source: U.S. Geological Survey (USGS)
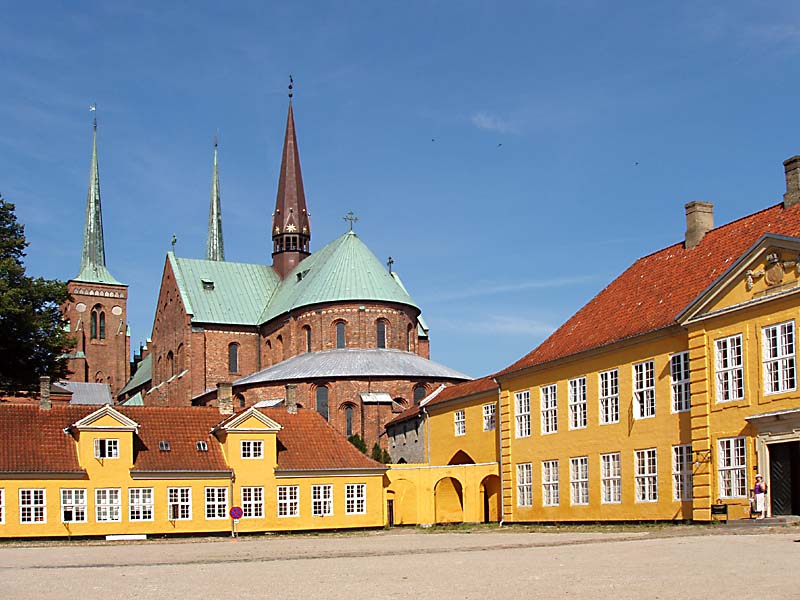
Slangerup
Slangerup is a town in Frederikssund municipality, about 30 km north-west of central Copenhagen, in the Capital Region of Denmark.
Slangerup Wikipedia Page


About Our Data
The data on this page is estimated using a number of publicly available tools and resources. It is provided without warranty, and could contain inaccuracies. Use at your own risk.