Categories in Tarm
Industries
Business Distribution by Industry in Tarm
| Industry Description | Number of Establishments | Average Age of Business |
|---|---|---|
| Landscaping | 75 | 26 years |
| Construction of buildings | 69 | 25 years |
| Unreachable | 63 | 27 years |
| Shopping other | 61 | 29 years |
| Other membership organizations | 40 | 20 years |
| Corporate management | 40 | 33 years |
| Shopping | 38 | 20 years |
| All membership organizations | 34 | 16 years |
| Holding companies | 30 | 23 years |
| Nurseries and garden supplies | 27 | 31 years |
| All food and beverage | 27 | — |
Tarm Facts
| Area | 3.4 km² |
| Population | 3,803 |
| Male Population | 1,877 (49.4%) |
| Female Population | 1,926 (50.6%) |
| Population change (1975 to 2020) | +11.9% |
| Population change (2000 to 2020) | +2.6% |
| Median Age | 46.4 years (Male: 44.7, Female: 48.1) |
| Neighborhoods | Bork Havn |
| Local Time | |
| Timezone | Central European Summer Time |
| Lat & Lng | 55.90861, 8.53041 |
| Postal Codes | 6880 |
Map of Tarm
Interactive Map
Tarm Population
Years 1975 to 2020
| Data | 1975 | 1990 | 2000 | 2015 | 2020 |
|---|---|---|---|---|---|
| Population | 3,400 | 3,615 | 3,707 | 3,720 | 3,803 |
| Population Density | 989.1 / km² | 1,051.6 / km² | 1,078.4 / km² | 1,082.2 / km² | 1,106.3 / km² |
Tarm Population change from 2000 to 2015
Increase of 0.4% from year 2000 to 2015
| Location | Change since 1975 | Change since 1990 | Change since 2000 |
|---|---|---|---|
| Tarm | +9.4% | +2.9% | +0.4% |
| Central Denmark Region | +4.3% | +11.5% | +7.5% |
| Denmark | +12.1% | +10.4% | +6.3% |
Tarm Median Age
Median Age: 46.4 years
| Location | Median Age | Median Age (Female) | Median Age (Male) |
|---|---|---|---|
| Tarm | 46.4 yrs | 48.1 yrs | 44.7 yrs |
| Central Denmark Region | 39.6 yrs | 40.3 yrs | 38.8 yrs |
| Denmark | 40.5 yrs | 41.3 yrs | 39.6 yrs |
Tarm Population Density
Population Density: 1,106 / km²
| Location | Population | Area | Density |
|---|---|---|---|
| Tarm | 3,803 | 3.438 km² | 1,106 / km² |
| Central Denmark Region | 1.3 million | 13,192.2 km² | 96.2 / km² |
| Denmark | 5.5 million | 43,072 km² | 129 / km² |
Tarm Historical and Projected Population
Estimated Population from 0 to 2100
- JRC (European Commission's Joint Research Centre) work on the GHS built-up grid
- CIESIN (Center for International Earth Science Information Network)
- [Link] Klein Goldewijk, K., Beusen, A., Doelman, J., and Stehfest, E.: Anthropogenic land use estimates for the Holocene – HYDE 3.2, Earth Syst. Sci. Data, 9, 927–953, https://doi.org/10.5194/essd-9-927-2017, 2017.
Price Distribution
Business distribution by price for Tarm
Human Development Index (HDI)
Statistic composite index of life expectancy, education, and per capita income.
Tarm CO2 Emissions
Carbon Dioxide (CO2) Emissions Per Capita in Tonnes Per Year
| Location | CO2 Emissions | CO2 Emissions Per Capita | CO2 Emissions Intensity |
|---|---|---|---|
| Tarm | 39,567 tn | 10.4 tn | 11,510.4 tons/km² |
| Central Denmark Region | 13,156,967 tn | 10.36 tn | 997.3 tons/km² |
| Denmark | 59,647,725 tn | 10.75 tn | 1,384.8 tons/km² |
| 2013 CO2 emissions (tonnes/year) | 39,567 tn |
| 2013 CO2 emissions (tonnes/year) per capita | 10.4 tn |
| 2013 CO2 emissions intensity (tonnes/km²/year) | 11,510.4 tons/km² |
Natural Hazards Risk
Relative risk out of 10
| Hazard | Risk Level |
|---|---|
| Drought | Low (2) |
* Risk, particularly concerning flood or landslide, may not be for the entire area.
- Dilley, M., R.S. Chen, U. Deichmann, A.L. Lerner-Lam, M. Arnold, J. Agwe, P. Buys, O. Kjekstad, B. Lyon, and G. Yetman. 2005. Natural Disaster Hotspots: A Global Risk Analysis. Washington, D.C.: World Bank. https://doi.org/10.1596/0-8213-5930-4.
- Center for Hazards and Risk Research - CHRR - Columbia University, Center for International Earth Science Information Network - CIESIN - Columbia University, and International Research Institute for Climate and Society - IRI - Columbia University. 2005. Global Drought Hazard Frequency and Distribution. Palisades, NY: NASA Socioeconomic Data and Applications Center (SEDAC). https://doi.org/10.7927/H4VX0DFT.
Recent Nearby Earthquakes
Magnitude 3.0 and greater
| Date▼ | Time↕ | Magnitude↕ | Distance↕ | Depth↕ | Location↕ | Link |
|---|---|---|---|---|---|---|
| 9/16/18 | 8:57 AM | 3.8 | 62.8 km | 10,000 m | 23km NW of Ulfborg, Denmark | usgs.gov |
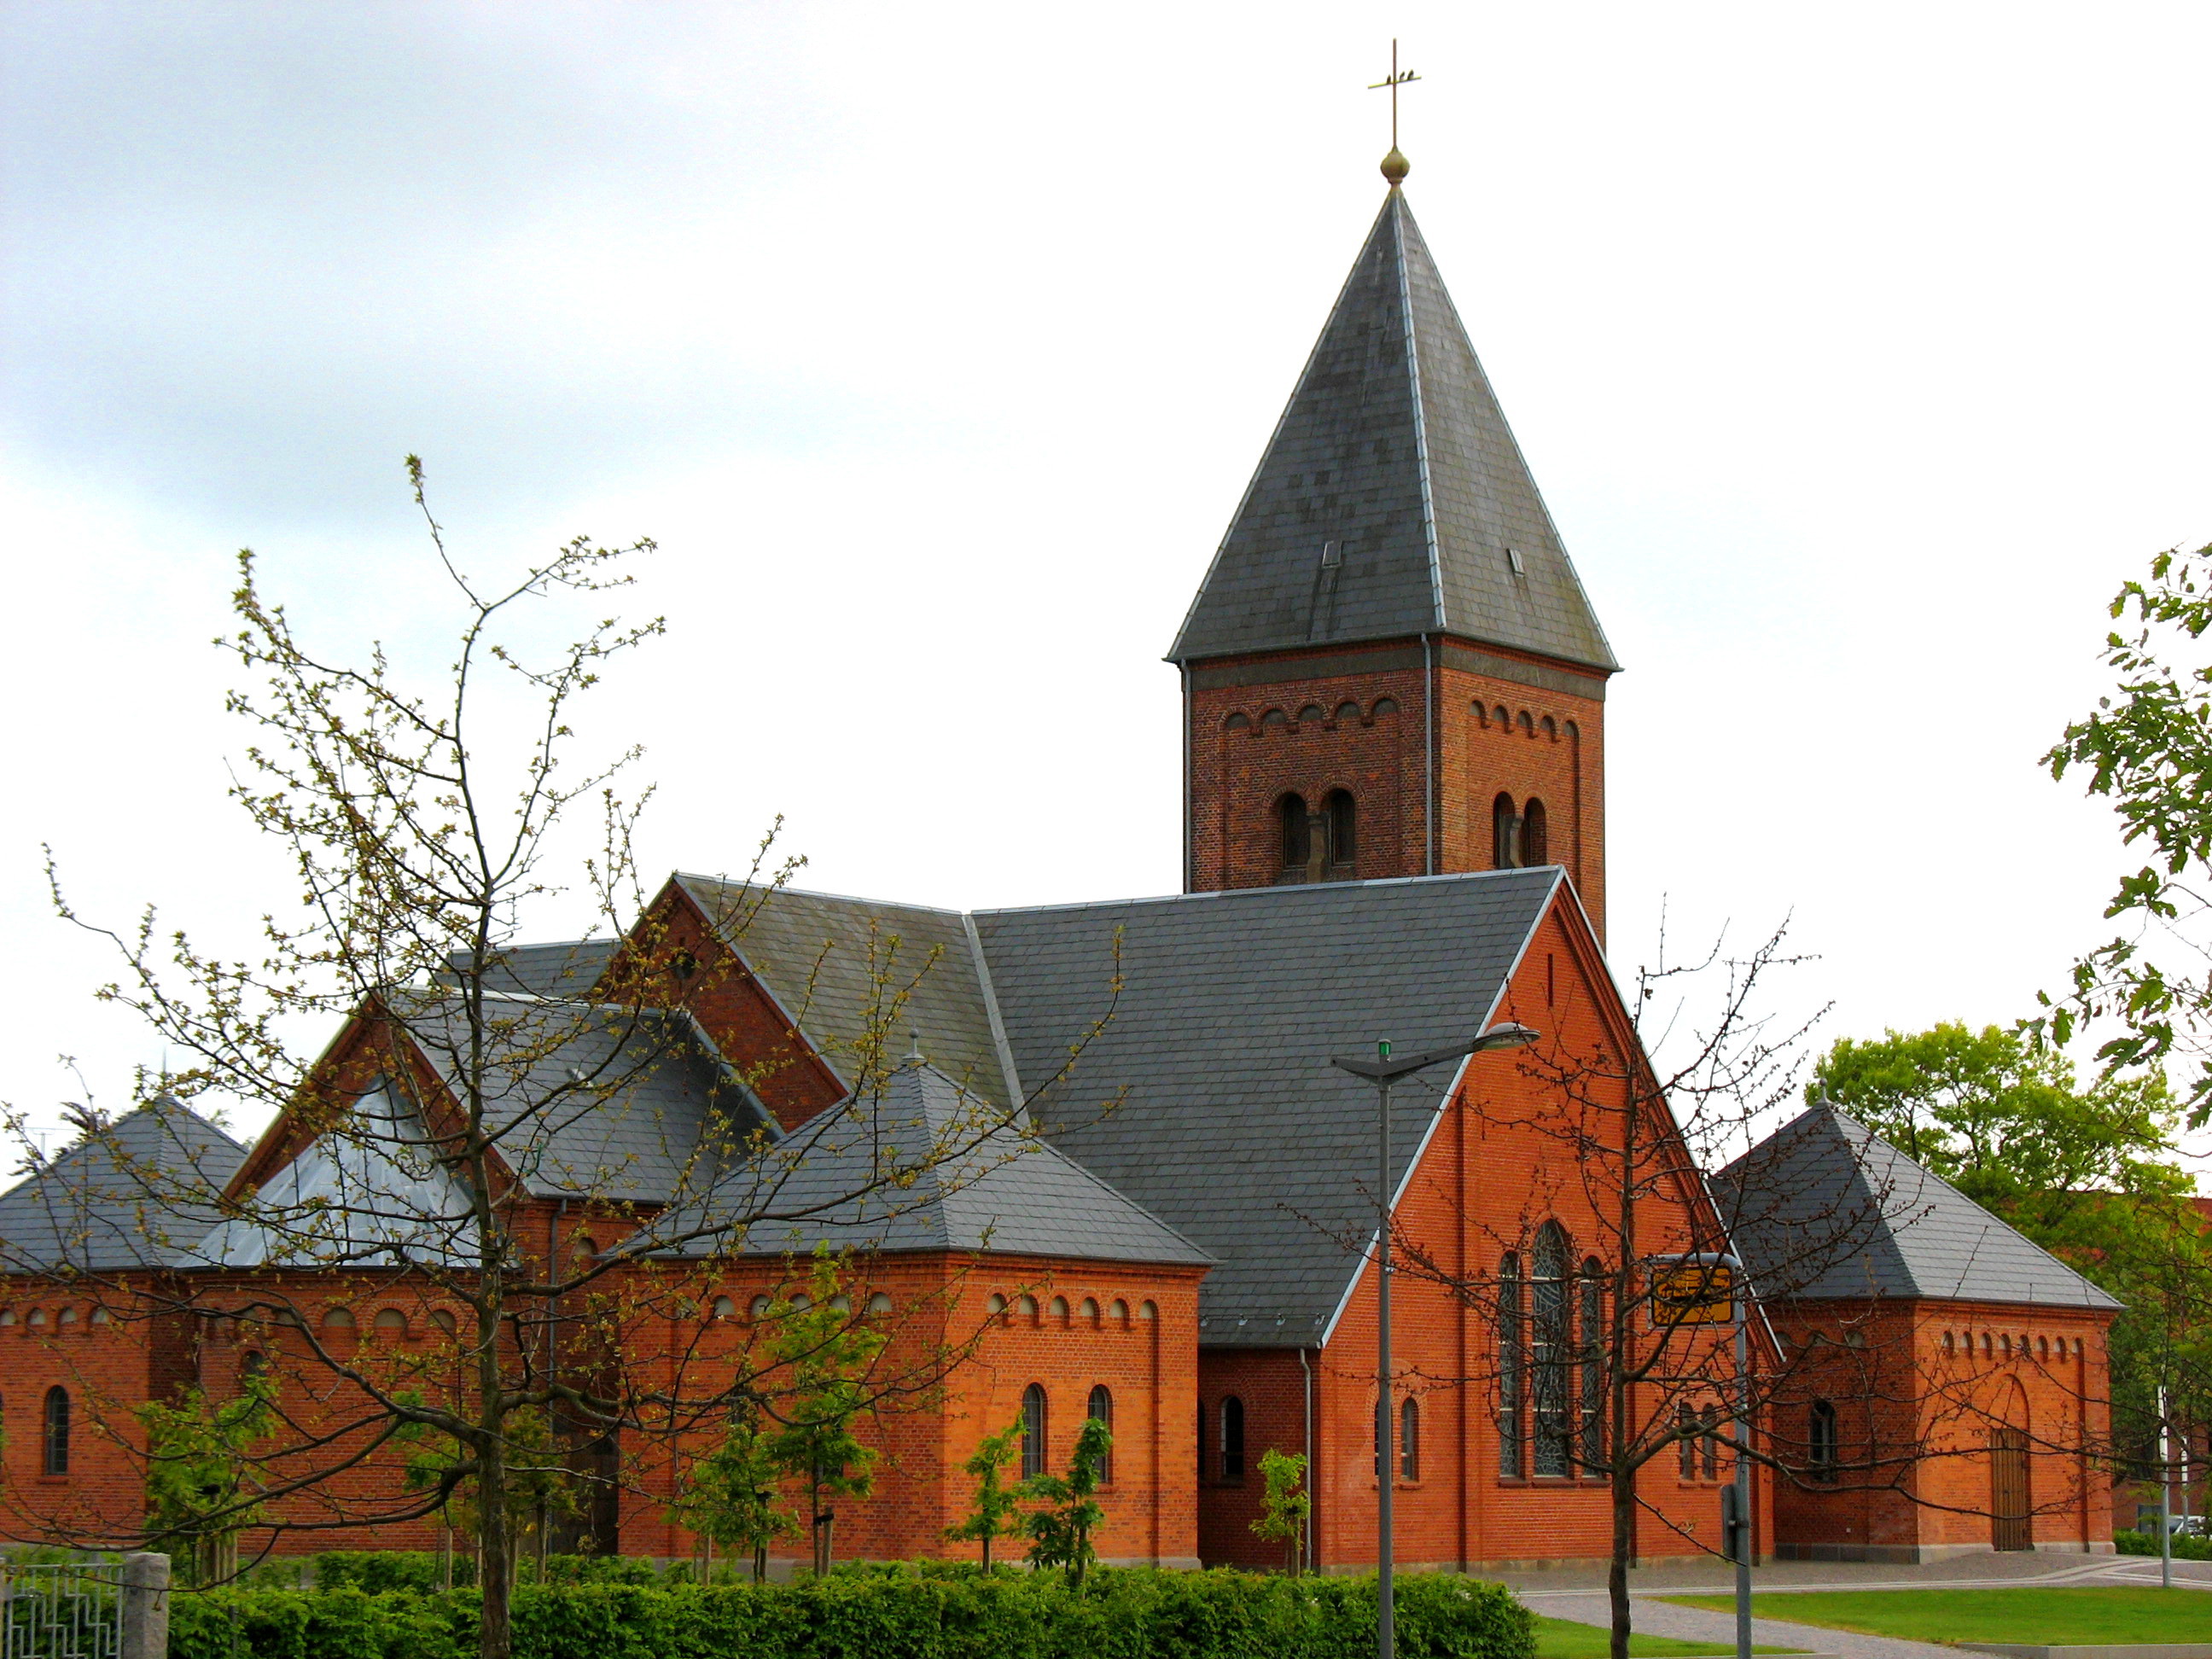
Tarm
Tarm is a small railway town with a population of 4,084 (1 January 2014) in west Denmark, 36 kilometres southwest of Herning (air distance). The road distance between Herning and Tarm is exactly 47,8 kilometres (Herning-Videbæk-Skjern-Tarm route).
Tarm Wikipedia Page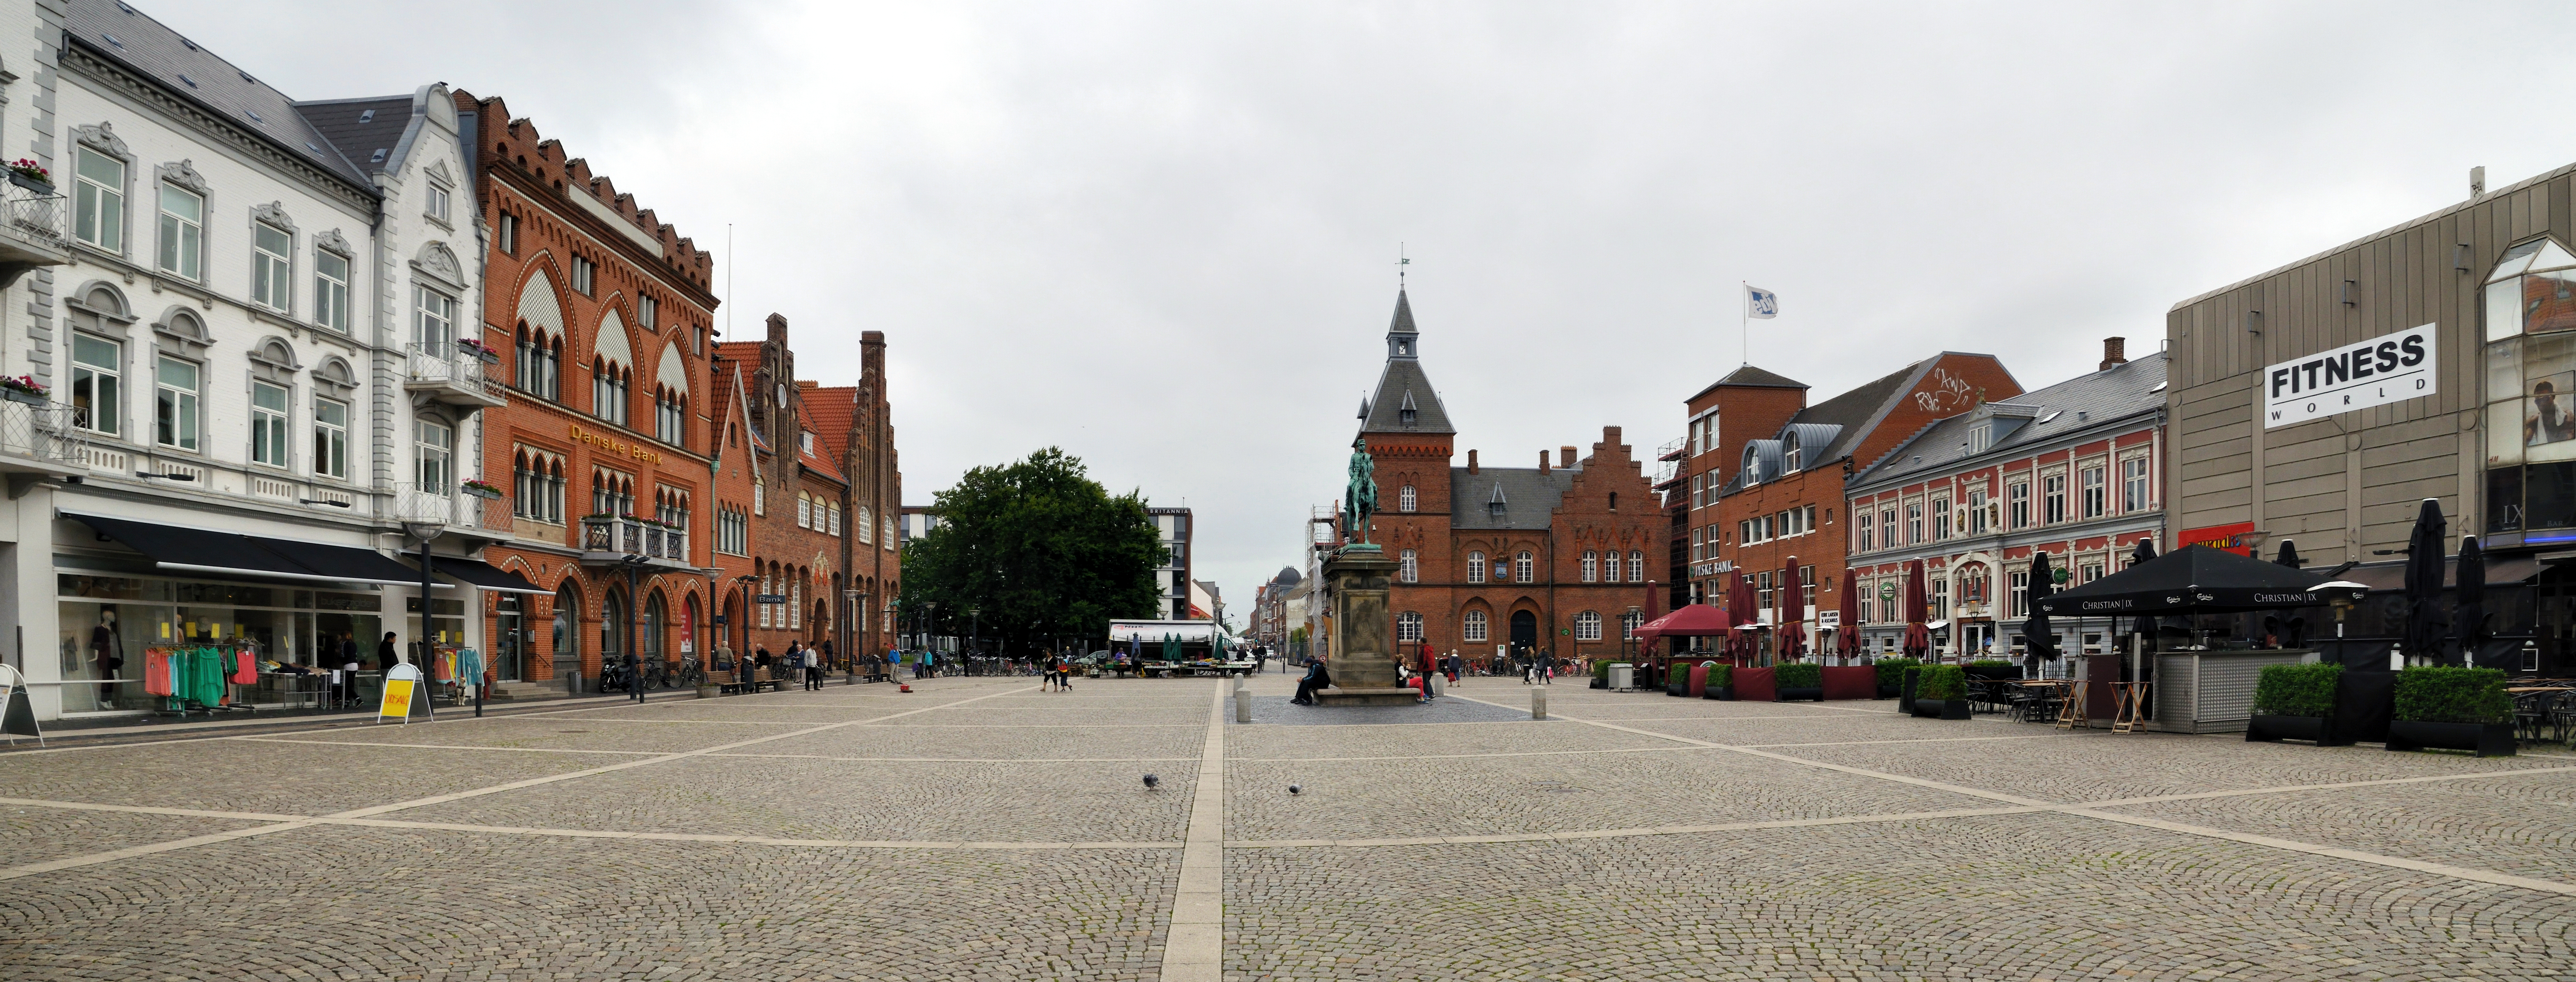

About Our Data
The data on this page is estimated using a number of publicly available tools and resources. It is provided without warranty, and could contain inaccuracies. Use at your own risk.