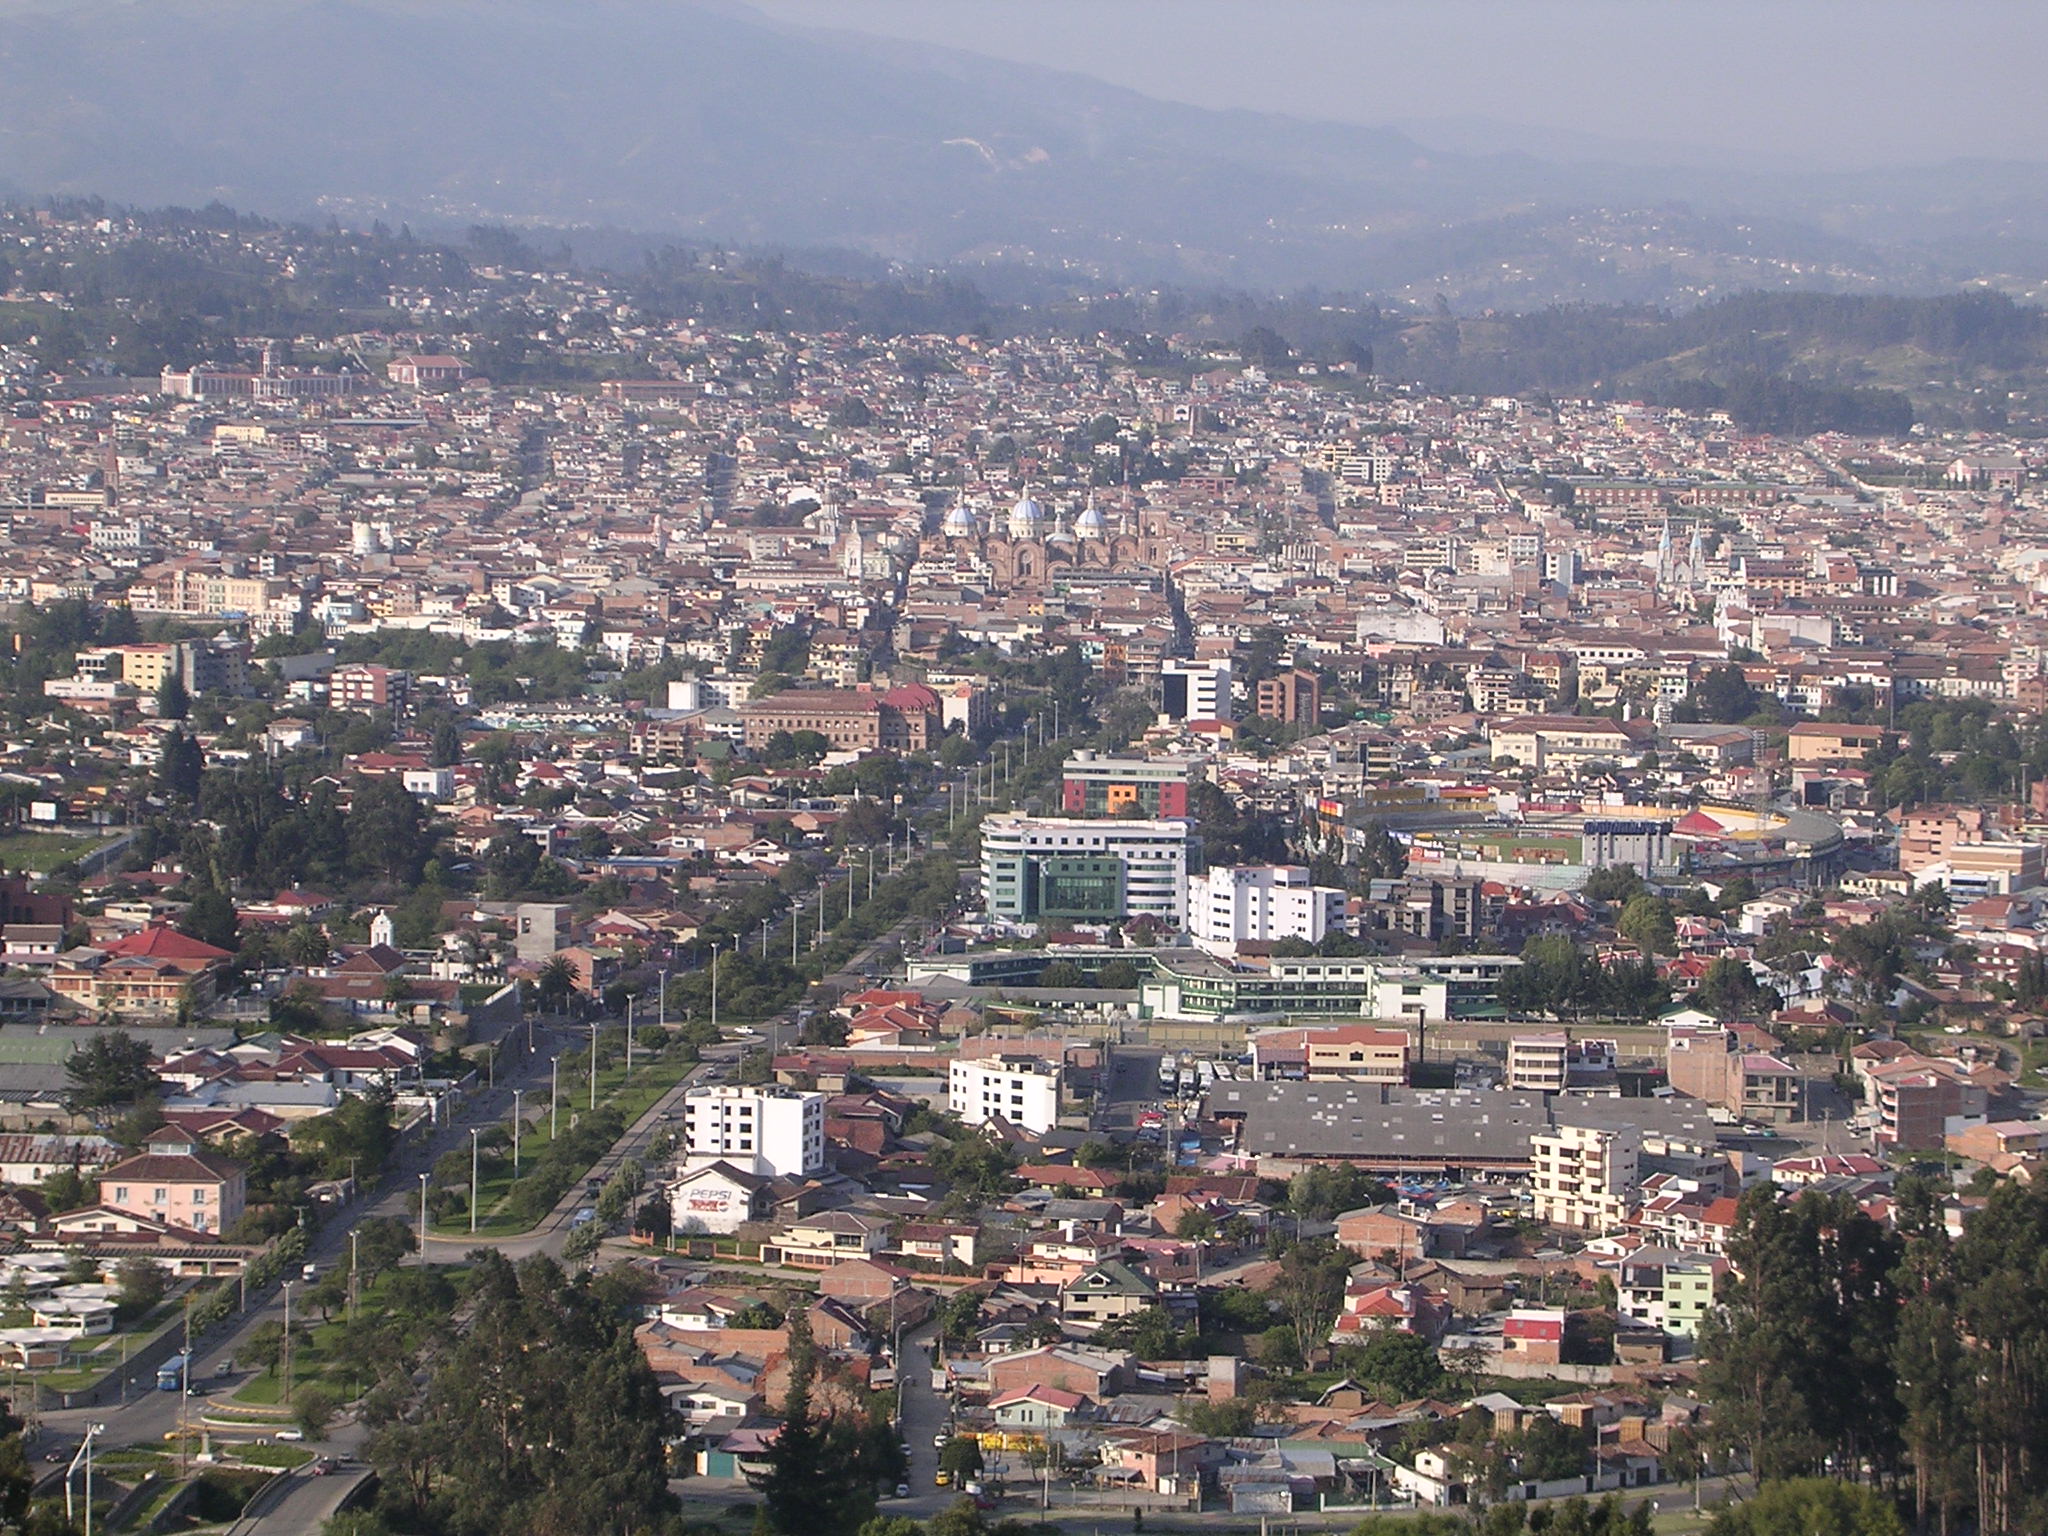
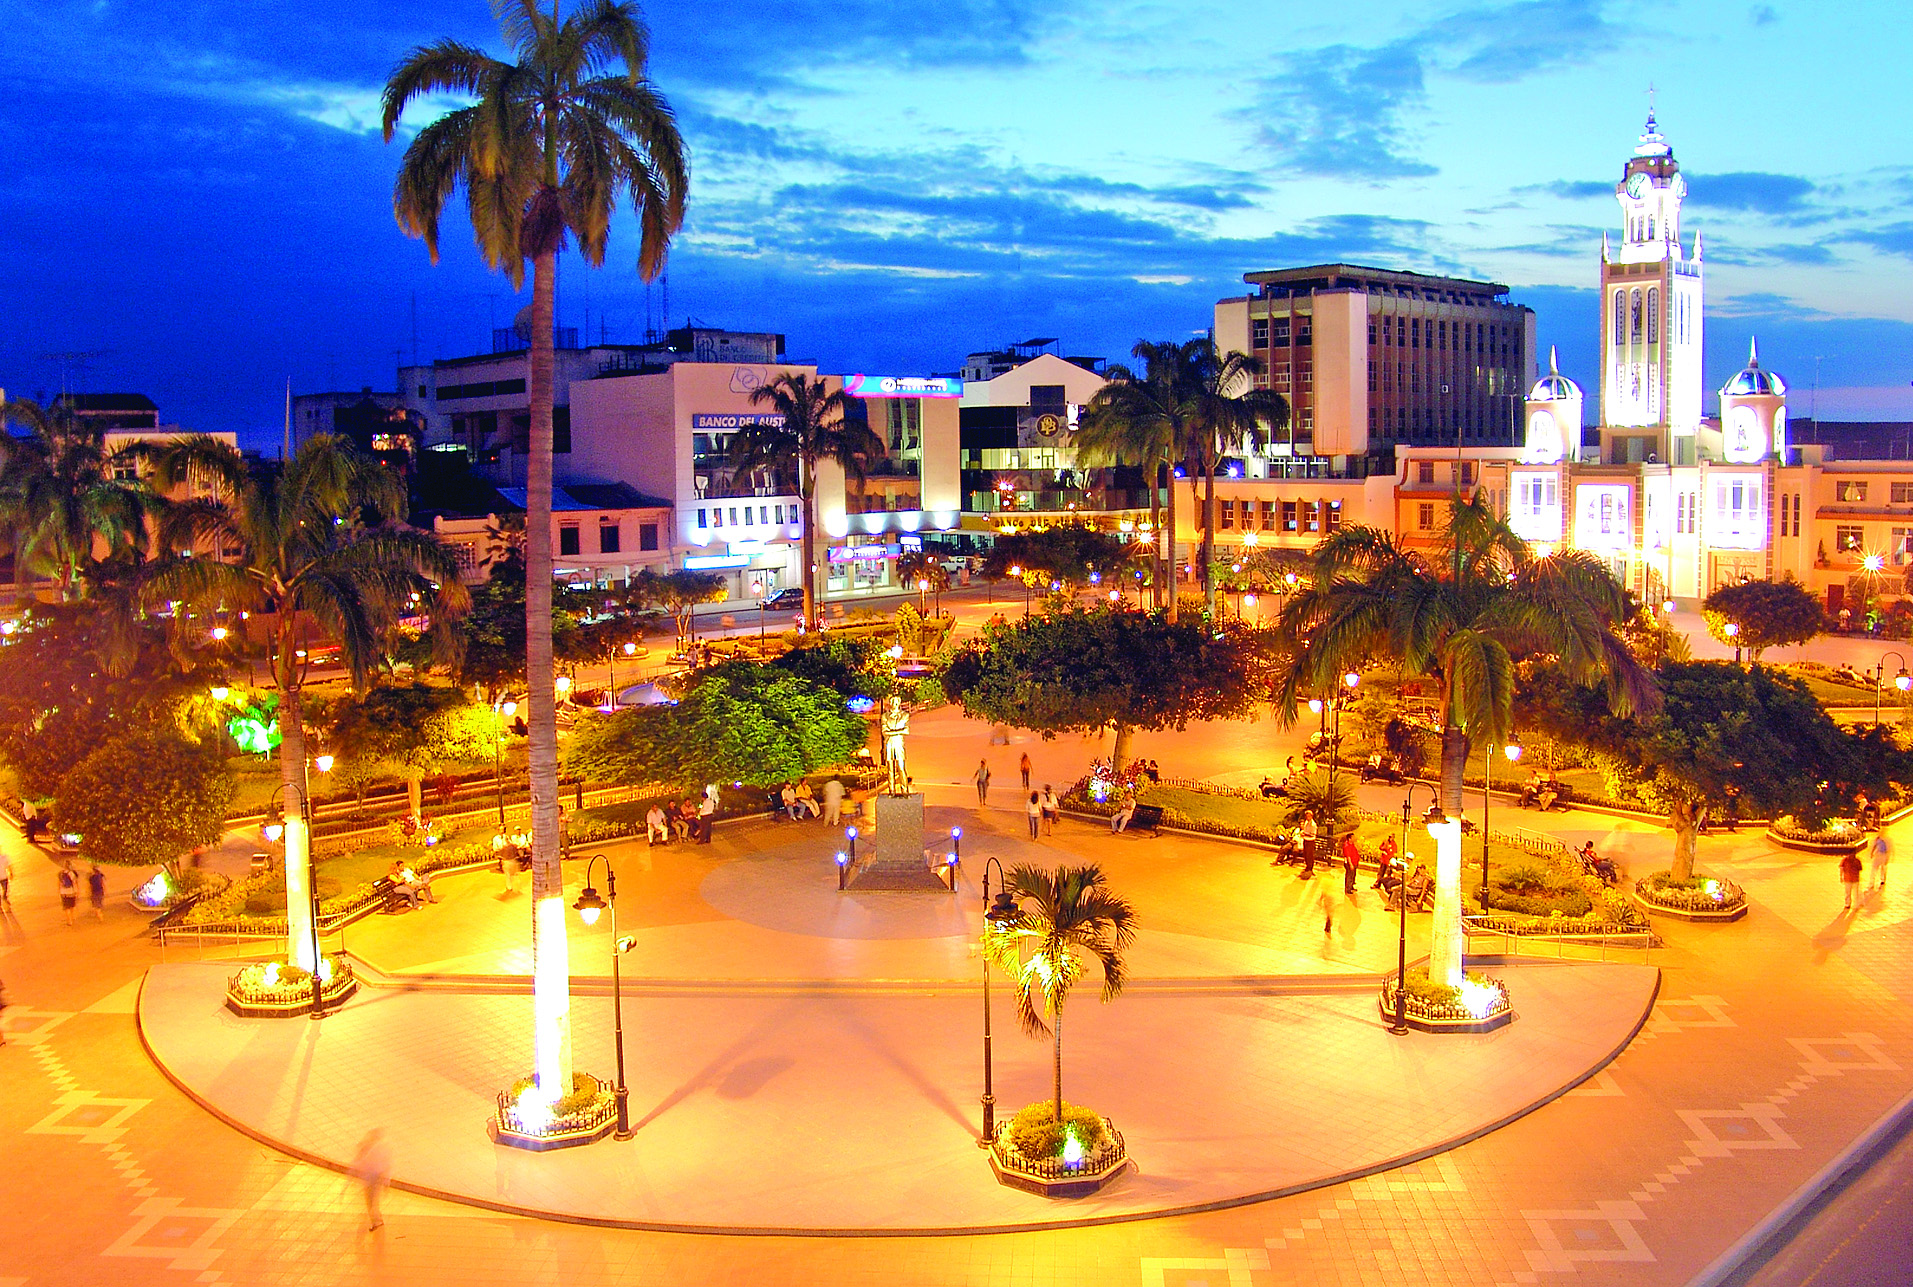
Categories in Guabo
Auto Parts StoreCar Accessories StoreCar repairCar WashGas StationAgricultural ProductionBoutiqueClothing storesInternet Service ProviderMobile phone storesChurchesGovernment OfficeSoup KitchenElectronics StoreConstruction of buildingsHardware storeHome Goods StoreHousing DevelopmentEducationEducation CenterTourist AttractionBakeriesBars, pubs and tavernsBurger restaurantsButcherCafesCake ShopCoffee ShopFast food restaurantsGrocery stores and supermarketsIce Cream ShopInternet cafesRestaurantsBanksDental ClinicHospitalsBarbersBeauty salonsAdvertising AgencyLivery CompanyApartment BuildingApartment ComplexCondominium ComplexCountry HouseHousing ComplexComputer storesDrug StoreGeneral StoreGift ShopPharmacy
Showing 1-50 of 64
Industries
Business Distribution by Industry in Guabo
| Industry Description | Number of Establishments |
|---|---|
| Restaurants | 68 |
| Shopping | 61 |
| Grocery stores and supermarkets | 47 |
| Education | 39 |
| Corporate management | 30 |
| Clothing stores | 24 |
| Bars, pubs and taverns | 20 |
| Other accommodation | 19 |
| Churches | 18 |
| Pharmacies and drug stores | 17 |
| Health and medical | 17 |
| Beauty salons | 15 |
| Car repair | 14 |
| Cafes | 14 |
Guabo Facts
| Area | 164.1 km² |
| Population | 34,722 |
| Male Population | 18,002 (51.8%) |
| Female Population | 16,720 (48.2%) |
| Population change (1975 to 2020) | +106.1% |
| Population change (2000 to 2020) | +24.6% |
| Median Age | 24.5 years (Male: 24.7, Female: 24.2) |
| Area Codes | 7 |
| Local Time | |
| Timezone | Ecuador Time |
| Lat & Lng | -3.24401, -79.82874 |
| Postal Codes | 070650 |
Map of Guabo
Interactive Map
Guabo Population
Years 1975 to 2020
| Data | 1975 | 1990 | 2000 | 2015 | 2020 |
|---|---|---|---|---|---|
| Population | 16,849 | 23,181 | 27,857 | 32,751 | 34,722 |
| Population Density | 102.7 / km² | 141.3 / km² | 169.8 / km² | 199.6 / km² | 211.6 / km² |
Sources: JRC (European Commission's Joint Research Centre) work on the GHS built-up grid
Guabo Population change from 2000 to 2015
Increase of 17.6% from year 2000 to 2015
| Location | Change since 1975 | Change since 1990 | Change since 2000 |
|---|---|---|---|
| Guabo | +94.4% | +41.3% | +17.6% |
| El Oro Province | +93.9% | +40.8% | +19.1% |
| Ecuador | +131.1% | +58.1% | +27.9% |
Sources: JRC (European Commission's Joint Research Centre) work on the GHS built-up grid
Guabo Median Age
Median Age: 24.5 years
| Location | Median Age | Median Age (Female) | Median Age (Male) |
|---|---|---|---|
| Guabo | 24.5 yrs | 24.2 yrs | 24.7 yrs |
| El Oro Province | 25.7 yrs | 25.8 yrs | 25.6 yrs |
| Ecuador | 25.1 yrs | 25.6 yrs | 24.5 yrs |
Sources: CIESIN (Center for International Earth Science Information Network)
Guabo Population Density
Population Density: 212 / km²
| Location | Population | Area | Density |
|---|---|---|---|
| Guabo | 34,722 | 164.1 km² | 212 / km² |
| El Oro Province | 652,480 | 5,811.1 km² | 112 / km² |
| Ecuador | 15.8 million | 256,053.3 km² | 61.9 / km² |
Sources: JRC (European Commission's Joint Research Centre) work on the GHS built-up grid
Guabo Historical and Projected Population
Estimated Population from 800 to 2100
Sources:
- JRC (European Commission's Joint Research Centre) work on the GHS built-up grid
- CIESIN (Center for International Earth Science Information Network)
- [Link] Klein Goldewijk, K., Beusen, A., Doelman, J., and Stehfest, E.: Anthropogenic land use estimates for the Holocene – HYDE 3.2, Earth Syst. Sci. Data, 9, 927–953, https://doi.org/10.5194/essd-9-927-2017, 2017.
Price Distribution
Business distribution by price for Guabo
Human Development Index (HDI)
Statistic composite index of life expectancy, education, and per capita income.
Source: [Link] Kummu, M., Taka, M. &Guillaume, J. Gridded global datasets for Gross Domestic Product and Human Development Index over 1990–2015. Sci Data 5, 180004 (2018) doi:10.1038/sdata.2018.4
Guabo CO2 Emissions
Carbon Dioxide (CO2) Emissions Per Capita in Tonnes Per Year
| Location | CO2 Emissions | CO2 Emissions Per Capita | CO2 Emissions Intensity |
|---|---|---|---|
| Guabo | 108,428 tn | 3.12 tn | 660.9 tons/km² |
| El Oro Province | 2,022,007 tn | 3.1 tn | 348 tons/km² |
| Ecuador | 43,886,500 tn | 2.77 tn | 171.4 tons/km² |
Sources: [Link] Moran, D., Kanemoto K; Jiborn, M., Wood, R., Többen, J., and Seto, K.C. (2018) Carbon footprints of 13,000 cities. Environmental Research Letters DOI: 10.1088/1748-9326/aac72a
Guabo CO2 Emissions
| 2013 CO2 emissions (tonnes/year) | 108,428 tn |
| 2013 CO2 emissions (tonnes/year) per capita | 3.12 tn |
| 2013 CO2 emissions intensity (tonnes/km²/year) | 660.9 tons/km² |
Natural Hazards Risk
Relative risk out of 10
| Hazard | Risk Level |
|---|---|
| Drought | Low (2) |
| Flood | High (9) |
| Earthquake | Medium (7) |
| Landslide | Medium (6) |
* Risk, particularly concerning flood or landslide, may not be for the entire area.
Sources:
- Dilley, M., R.S. Chen, U. Deichmann, A.L. Lerner-Lam, M. Arnold, J. Agwe, P. Buys, O. Kjekstad, B. Lyon, and G. Yetman. 2005. Natural Disaster Hotspots: A Global Risk Analysis. Washington, D.C.: World Bank. https://doi.org/10.1596/0-8213-5930-4.
- Center for Hazards and Risk Research - CHRR - Columbia University, Center for International Earth Science Information Network - CIESIN - Columbia University, and Norwegian Geotechnical Institute - NGI. 2005. Global Landslide Hazard Distribution. Palisades, NY: NASA Socioeconomic Data and Applications Center (SEDAC). https://doi.org/10.7927/H4P848VZ.
- Center for Hazards and Risk Research - CHRR - Columbia University, Center for International Earth Science Information Network - CIESIN - Columbia University, and International Research Institute for Climate and Society - IRI - Columbia University. 2005. Global Drought Hazard Frequency and Distribution. Palisades, NY: NASA Socioeconomic Data and Applications Center (SEDAC). https://doi.org/10.7927/H4VX0DFT.
- Center for Hazards and Risk Research - CHRR - Columbia University, Center for International Earth Science Information Network - CIESIN - Columbia University. 2005. Global Flood Hazard Frequency and Distribution. Palisades, NY: NASA Socioeconomic Data and Applications Center (SEDAC). https://doi.org/10.7927/H4668B3D.
- Center for Hazards and Risk Research - CHRR - Columbia University, Center for International Earth Science Information Network - CIESIN - Columbia University. 2005. Global Earthquake Hazard Distribution - Peak Ground Acceleration. Palisades, NY: NASA Socioeconomic Data and Applications Center (SEDAC). https://doi.org/10.7927/H4BZ63ZS.
Recent Nearby Earthquakes
Magnitude 3.0 and greater
| Date▼ | Time↕ | Magnitude↕ | Distance↕ | Depth↕ | Location↕ | Link |
|---|---|---|---|---|---|---|
| 4/22/19 | 1:04 AM | 4.8 | 67.9 km | 38,190 m | 30km NW of Zarumilla, Peru | usgs.gov |
| 2/14/19 | 1:42 PM | 4.7 | 73.3 km | 46,920 m | 42km N of Tumbes, Peru | usgs.gov |
| 10/29/18 | 12:20 PM | 4.5 | 74.1 km | 58,160 m | 19km SE of Tumbes, Peru | usgs.gov |
| 7/9/18 | 6:14 PM | 4.6 | 61.9 km | 49,530 m | 25km N of Balao, Ecuador | usgs.gov |
| 3/3/18 | 7:09 PM | 4.3 | 45.9 km | 4,270 m | 12km NE of Balao, Ecuador | usgs.gov |
| 2/27/18 | 2:20 PM | 4.5 | 49 km | 3,170 m | 13km NNE of Balao, Ecuador | usgs.gov |
| 2/27/18 | 3:40 AM | 4.7 | 39.7 km | 10,000 m | 5km NE of Balao, Ecuador | usgs.gov |
| 11/18/17 | 4:23 AM | 5.5 | 33.6 km | 35,000 m | 13km ESE of Balao, Ecuador | usgs.gov |
| 1/30/17 | 4:56 AM | 4.2 | 64.4 km | 50,820 m | 19km SE of Naranjal, Ecuador | usgs.gov |
| 1/7/17 | 9:11 AM | 4.1 | 65.9 km | 25,900 m | 34km S of Playas, Ecuador | usgs.gov |
Source: U.S. Geological Survey (USGS)
About Our Data
The data on this page is estimated using a number of publicly available tools and resources. It is provided without warranty, and could contain inaccuracies. Use at your own risk.