Categories in Pasaje
Industries
Business Distribution by Industry in Pasaje
| Industry Description | Number of Establishments |
|---|---|
| Restaurants | 282 |
| Shopping | 165 |
| Grocery stores and supermarkets | 129 |
| Education | 103 |
| Bars, pubs and taverns | 78 |
| Car repair | 57 |
| Clothing stores | 56 |
| Health and medical | 50 |
| Corporate management | 49 |
| Beauty salons | 47 |
| Churches | 45 |
Pasaje Facts
| Area | 107.8 km² |
| Population | 62,163 |
| Male Population | 31,105 (50.0%) |
| Female Population | 31,058 (50.0%) |
| Population change (1975 to 2020) | +106.5% |
| Population change (2000 to 2020) | +25.2% |
| Median Age | 26.3 years (Male: 26, Female: 26.5) |
| Area Codes | 7 |
| Neighborhoods | Ochoa León, Bolívar, El Progreso, Tres Cerritos, Cumbayá |
| Local Time | |
| Timezone | Ecuador Time |
| Lat & Lng | -3.32561, -79.80697 |
| Postal Codes | 070101, 070102, 070103, 070104, 070902, More |
Map of Pasaje
Interactive Map
Pasaje Population
Years 1975 to 2020
| Data | 1975 | 1990 | 2000 | 2015 | 2020 |
|---|---|---|---|---|---|
| Population | 30,097 | 41,407 | 49,637 | 58,546 | 62,163 |
| Population Density | 279.3 / km² | 384.3 / km² | 460.7 / km² | 543.4 / km² | 576.9 / km² |
Pasaje Population change from 2000 to 2015
Increase of 17.9% from year 2000 to 2015
| Location | Change since 1975 | Change since 1990 | Change since 2000 |
|---|---|---|---|
| Pasaje | +94.5% | +41.4% | +17.9% |
| El Oro Province | +93.9% | +40.8% | +19.1% |
| Ecuador | +131.1% | +58.1% | +27.9% |
Pasaje Median Age
Median Age: 26.3 years
| Location | Median Age | Median Age (Female) | Median Age (Male) |
|---|---|---|---|
| Pasaje | 26.3 yrs | 26.5 yrs | 26 yrs |
| El Oro Province | 25.7 yrs | 25.8 yrs | 25.6 yrs |
| Ecuador | 25.1 yrs | 25.6 yrs | 24.5 yrs |
Pasaje Population Density
Population Density: 577 / km²
| Location | Population | Area | Density |
|---|---|---|---|
| Pasaje | 62,163 | 107.8 km² | 577 / km² |
| El Oro Province | 652,480 | 5,811.1 km² | 112 / km² |
| Ecuador | 15.8 million | 256,053.3 km² | 61.9 / km² |
Pasaje Historical and Projected Population
Estimated Population from 1800 to 2100
- JRC (European Commission's Joint Research Centre) work on the GHS built-up grid
- CIESIN (Center for International Earth Science Information Network)
- [Link] Klein Goldewijk, K., Beusen, A., Doelman, J., and Stehfest, E.: Anthropogenic land use estimates for the Holocene – HYDE 3.2, Earth Syst. Sci. Data, 9, 927–953, https://doi.org/10.5194/essd-9-927-2017, 2017.
Neighborhoods in Pasaje
Percentage of businesses by neighborhood in Pasaje
Area Codes
Percentage Area Codes used by businesses in Pasaje
Price Distribution
Business distribution by price for Pasaje
Human Development Index (HDI)
Statistic composite index of life expectancy, education, and per capita income.
Pasaje CO2 Emissions
Carbon Dioxide (CO2) Emissions Per Capita in Tonnes Per Year
| Location | CO2 Emissions | CO2 Emissions Per Capita | CO2 Emissions Intensity |
|---|---|---|---|
| Pasaje | 193,868 tn | 3.12 tn | 1,799.2 tons/km² |
| El Oro Province | 2,022,007 tn | 3.1 tn | 348 tons/km² |
| Ecuador | 43,886,500 tn | 2.77 tn | 171.4 tons/km² |
| 2013 CO2 emissions (tonnes/year) | 193,868 tn |
| 2013 CO2 emissions (tonnes/year) per capita | 3.12 tn |
| 2013 CO2 emissions intensity (tonnes/km²/year) | 1,799.2 tons/km² |
Natural Hazards Risk
Relative risk out of 10
| Hazard | Risk Level |
|---|---|
| Drought | Low (2) |
| Flood | High (9) |
| Earthquake | Medium (7) |
| Landslide | Medium (6) |
* Risk, particularly concerning flood or landslide, may not be for the entire area.
- Dilley, M., R.S. Chen, U. Deichmann, A.L. Lerner-Lam, M. Arnold, J. Agwe, P. Buys, O. Kjekstad, B. Lyon, and G. Yetman. 2005. Natural Disaster Hotspots: A Global Risk Analysis. Washington, D.C.: World Bank. https://doi.org/10.1596/0-8213-5930-4.
- Center for Hazards and Risk Research - CHRR - Columbia University, Center for International Earth Science Information Network - CIESIN - Columbia University, and Norwegian Geotechnical Institute - NGI. 2005. Global Landslide Hazard Distribution. Palisades, NY: NASA Socioeconomic Data and Applications Center (SEDAC). https://doi.org/10.7927/H4P848VZ.
- Center for Hazards and Risk Research - CHRR - Columbia University, Center for International Earth Science Information Network - CIESIN - Columbia University, and International Research Institute for Climate and Society - IRI - Columbia University. 2005. Global Drought Hazard Frequency and Distribution. Palisades, NY: NASA Socioeconomic Data and Applications Center (SEDAC). https://doi.org/10.7927/H4VX0DFT.
- Center for Hazards and Risk Research - CHRR - Columbia University, Center for International Earth Science Information Network - CIESIN - Columbia University. 2005. Global Flood Hazard Frequency and Distribution. Palisades, NY: NASA Socioeconomic Data and Applications Center (SEDAC). https://doi.org/10.7927/H4668B3D.
- Center for Hazards and Risk Research - CHRR - Columbia University, Center for International Earth Science Information Network - CIESIN - Columbia University. 2005. Global Earthquake Hazard Distribution - Peak Ground Acceleration. Palisades, NY: NASA Socioeconomic Data and Applications Center (SEDAC). https://doi.org/10.7927/H4BZ63ZS.
Recent Nearby Earthquakes
Magnitude 3.0 and greater
| Date▼ | Time↕ | Magnitude↕ | Distance↕ | Depth↕ | Location↕ | Link |
|---|---|---|---|---|---|---|
| 4/29/19 | 3:15 AM | 4.1 | 85.1 km | 71,190 m | 35km SSE of Tumbes, Peru | usgs.gov |
| 4/22/19 | 1:04 AM | 4.8 | 70.4 km | 38,190 m | 30km NW of Zarumilla, Peru | usgs.gov |
| 2/14/19 | 1:42 PM | 4.7 | 77 km | 46,920 m | 42km N of Tumbes, Peru | usgs.gov |
| 10/29/18 | 12:20 PM | 4.5 | 70.2 km | 58,160 m | 19km SE of Tumbes, Peru | usgs.gov |
| 7/9/18 | 6:14 PM | 4.6 | 71 km | 49,530 m | 25km N of Balao, Ecuador | usgs.gov |
| 3/3/18 | 7:09 PM | 4.3 | 54.3 km | 4,270 m | 12km NE of Balao, Ecuador | usgs.gov |
| 2/27/18 | 2:20 PM | 4.5 | 57.9 km | 3,170 m | 13km NNE of Balao, Ecuador | usgs.gov |
| 2/27/18 | 3:40 AM | 4.7 | 48.4 km | 10,000 m | 5km NE of Balao, Ecuador | usgs.gov |
| 11/18/17 | 4:23 AM | 5.5 | 41.3 km | 35,000 m | 13km ESE of Balao, Ecuador | usgs.gov |
| 1/30/17 | 4:56 AM | 4.2 | 70.5 km | 50,820 m | 19km SE of Naranjal, Ecuador | usgs.gov |
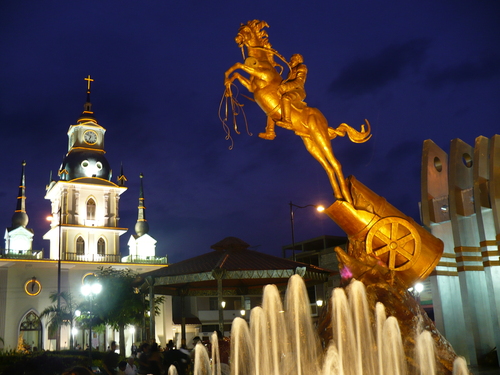
Pasaje
Pasaje is a small town in the lowlands of the El Oro Province, Ecuador. Pasaje is the seat of the Pasaje Canton. It is located on the border of the Jubones River.
Pasaje Wikipedia Page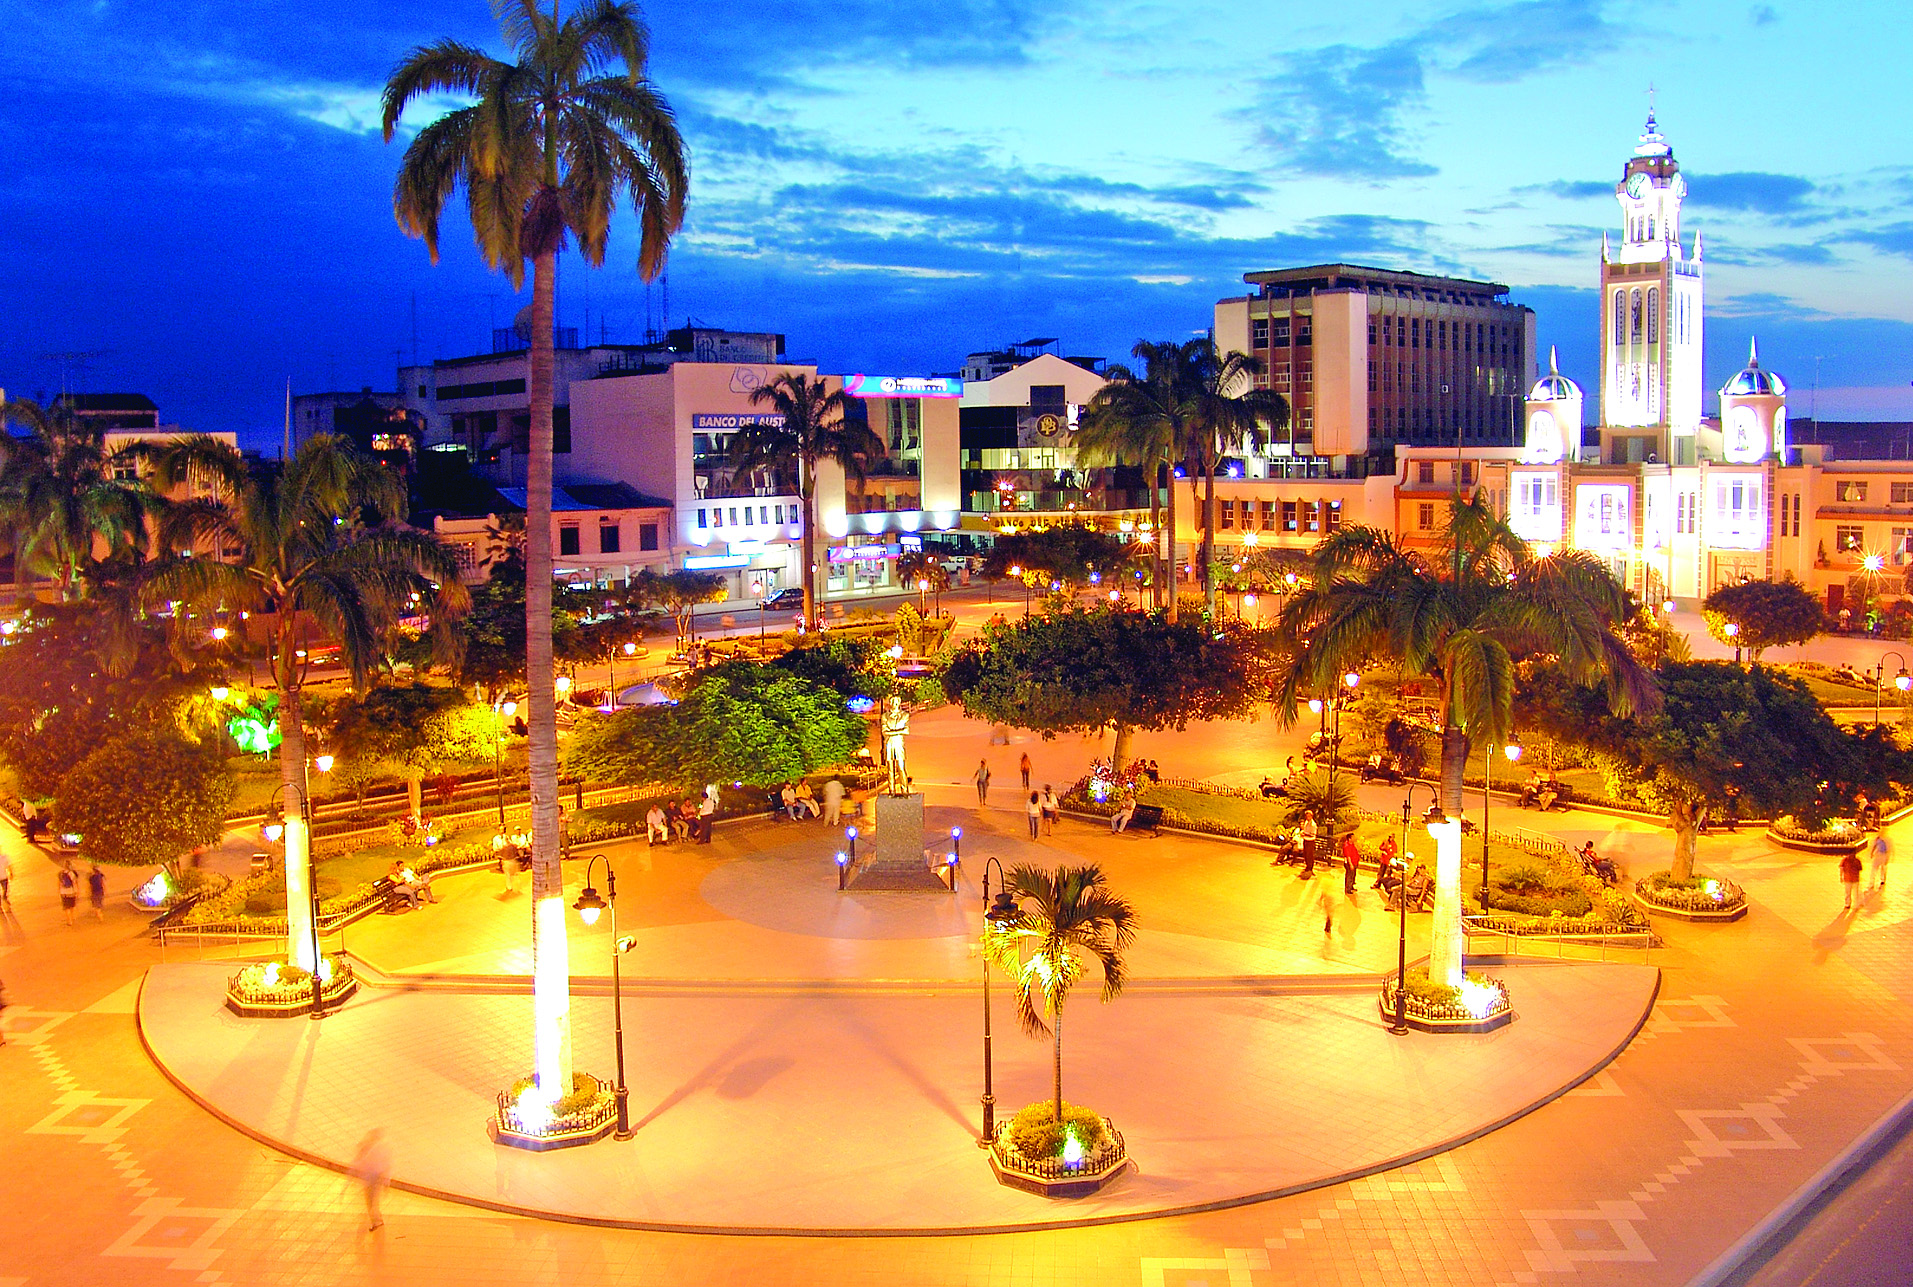

About Our Data
The data on this page is estimated using a number of publicly available tools and resources. It is provided without warranty, and could contain inaccuracies. Use at your own risk.