Categories in Dahab
Industries
Business Distribution by Industry in Dahab
| Industry Description | Number of Establishments |
|---|---|
| Restaurants | 173 |
| Other accommodation | 139 |
| Hotels and motels | 115 |
| Cafes | 77 |
| Real estate | 62 |
| Apartments | 44 |
| Physical education | 42 |
| Travel agencies | 42 |
| Shopping | 40 |
| Holiday homes, cabins and resorts | 39 |
| Grocery stores and supermarkets | 27 |
Dahab Facts
| Area | 1013.6 km² |
| Population | 7,903 |
| Male Population | 5,326 (67.4%) |
| Female Population | 2,577 (32.6%) |
| Population change (1975 to 2020) | +67.3% |
| Population change (2000 to 2020) | +27.4% |
| Median Age | 25.8 years (Male: 27.4, Female: 20.7) |
| Neighborhoods | المسبط, لاجونا, عسلة, MASBAT, ASLA |
| Local Time | |
| Timezone | Eastern European Summer Time |
| Lat & Lng | 28.50098, 34.51338 |
Map of Dahab
Interactive Map
Dahab Population
Years 1975 to 2020
| Data | 1975 | 1990 | 2000 | 2015 | 2020 |
|---|---|---|---|---|---|
| Population | 4,725 | 6,004 | 6,203 | 7,393 | 7,903 |
| Population Density | 4.7 / km² | 5.9 / km² | 6.1 / km² | 7.3 / km² | 7.8 / km² |
Dahab Population change from 2000 to 2015
Increase of 19.2% from year 2000 to 2015
| Location | Change since 1975 | Change since 1990 | Change since 2000 |
|---|---|---|---|
| Dahab | +56.5% | +23.1% | +19.2% |
| South Sinai Governorate | +79.9% | +38% | +20.3% |
| Egypt | +136.6% | +62.2% | +33.9% |
Dahab Median Age
Median Age: 25.8 years
| Location | Median Age | Median Age (Female) | Median Age (Male) |
|---|---|---|---|
| Dahab | 25.8 yrs | 20.7 yrs | 27.4 yrs |
| South Sinai Governorate | 27.6 yrs | 26.1 yrs | 28.2 yrs |
| Egypt | 22.8 yrs | 22.9 yrs | 22.7 yrs |
Dahab Population Density
Population Density: 7.8 / km²
| Location | Population | Area | Density |
|---|---|---|---|
| Dahab | 7,903 | 1,013.6 km² | 7.8 / km² |
| South Sinai Governorate | 142,459 | 29,276 km² | 4.9 / km² |
| Egypt | 90.9 million | 980,394.9 km² | 92.7 / km² |
Dahab Historical and Projected Population
Estimated Population from 0 to 2100
- JRC (European Commission's Joint Research Centre) work on the GHS built-up grid
- CIESIN (Center for International Earth Science Information Network)
- [Link] Klein Goldewijk, K., Beusen, A., Doelman, J., and Stehfest, E.: Anthropogenic land use estimates for the Holocene – HYDE 3.2, Earth Syst. Sci. Data, 9, 927–953, https://doi.org/10.5194/essd-9-927-2017, 2017.
Neighborhoods in Dahab
Percentage of businesses by neighborhood in Dahab
Area Codes
Percentage Area Codes used by businesses in Dahab
Price Distribution
Business distribution by price for Dahab
Human Development Index (HDI)
Statistic composite index of life expectancy, education, and per capita income.
Dahab CO2 Emissions
Carbon Dioxide (CO2) Emissions Per Capita in Tonnes Per Year
| Location | CO2 Emissions | CO2 Emissions Per Capita | CO2 Emissions Intensity |
|---|---|---|---|
| Dahab | 20,859 tn | 2.64 tn | 20.6 tons/km² |
| South Sinai Governorate | 385,902 tn | 2.71 tn | 13.2 tons/km² |
| Egypt | 209,857,539 tn | 2.31 tn | 214.1 tons/km² |
| 2013 CO2 emissions (tonnes/year) | 20,859 tn |
| 2013 CO2 emissions (tonnes/year) per capita | 2.64 tn |
| 2013 CO2 emissions intensity (tonnes/km²/year) | 20.6 tons/km² |
Natural Hazards Risk
Relative risk out of 10
| Hazard | Risk Level |
|---|---|
| Earthquake | Medium (5.5) |
* Risk, particularly concerning flood or landslide, may not be for the entire area.
- Dilley, M., R.S. Chen, U. Deichmann, A.L. Lerner-Lam, M. Arnold, J. Agwe, P. Buys, O. Kjekstad, B. Lyon, and G. Yetman. 2005. Natural Disaster Hotspots: A Global Risk Analysis. Washington, D.C.: World Bank. https://doi.org/10.1596/0-8213-5930-4.
- Center for Hazards and Risk Research - CHRR - Columbia University, Center for International Earth Science Information Network - CIESIN - Columbia University. 2005. Global Earthquake Hazard Distribution - Peak Ground Acceleration. Palisades, NY: NASA Socioeconomic Data and Applications Center (SEDAC). https://doi.org/10.7927/H4BZ63ZS.
Recent Nearby Earthquakes
Magnitude 3.0 and greater
| Date▼ | Time↕ | Magnitude↕ | Distance↕ | Depth↕ | Location↕ | Link |
|---|---|---|---|---|---|---|
| 11/29/16 | 5:01 PM | 4.4 | 8.1 km | 14,260 m | 8km NW of Dhahab, Egypt | usgs.gov |
| 5/16/16 | 1:45 AM | 5 | 19.7 km | 10,000 m | 19km NNE of Dhahab, Egypt | usgs.gov |
| 7/8/15 | 2:15 AM | 3.7 | 35.2 km | 14,170 m | 33km SSE of Nuwaybi`a, Egypt | usgs.gov |
| 10/28/00 | 9:02 PM | 3.4 | 22.1 km | 18,000 m | Egypt | usgs.gov |
| 4/6/00 | 6:37 AM | 4.2 | 37.1 km | 10,000 m | Egypt | usgs.gov |
| 3/8/00 | 2:22 PM | 4.9 | 42.6 km | 10,000 m | Egypt | usgs.gov |
| 2/2/99 | 6:01 PM | 4 | 39.5 km | 1,000 m | Egypt | usgs.gov |
| 5/10/97 | 11:01 PM | 4.7 | 43.8 km | 10,000 m | Egypt | usgs.gov |
| 6/1/96 | 4:06 PM | 3.7 | 19.9 km | 10,000 m | Egypt | usgs.gov |
| 2/26/96 | 7:17 AM | 5 | 39.6 km | 23,000 m | Egypt | usgs.gov |
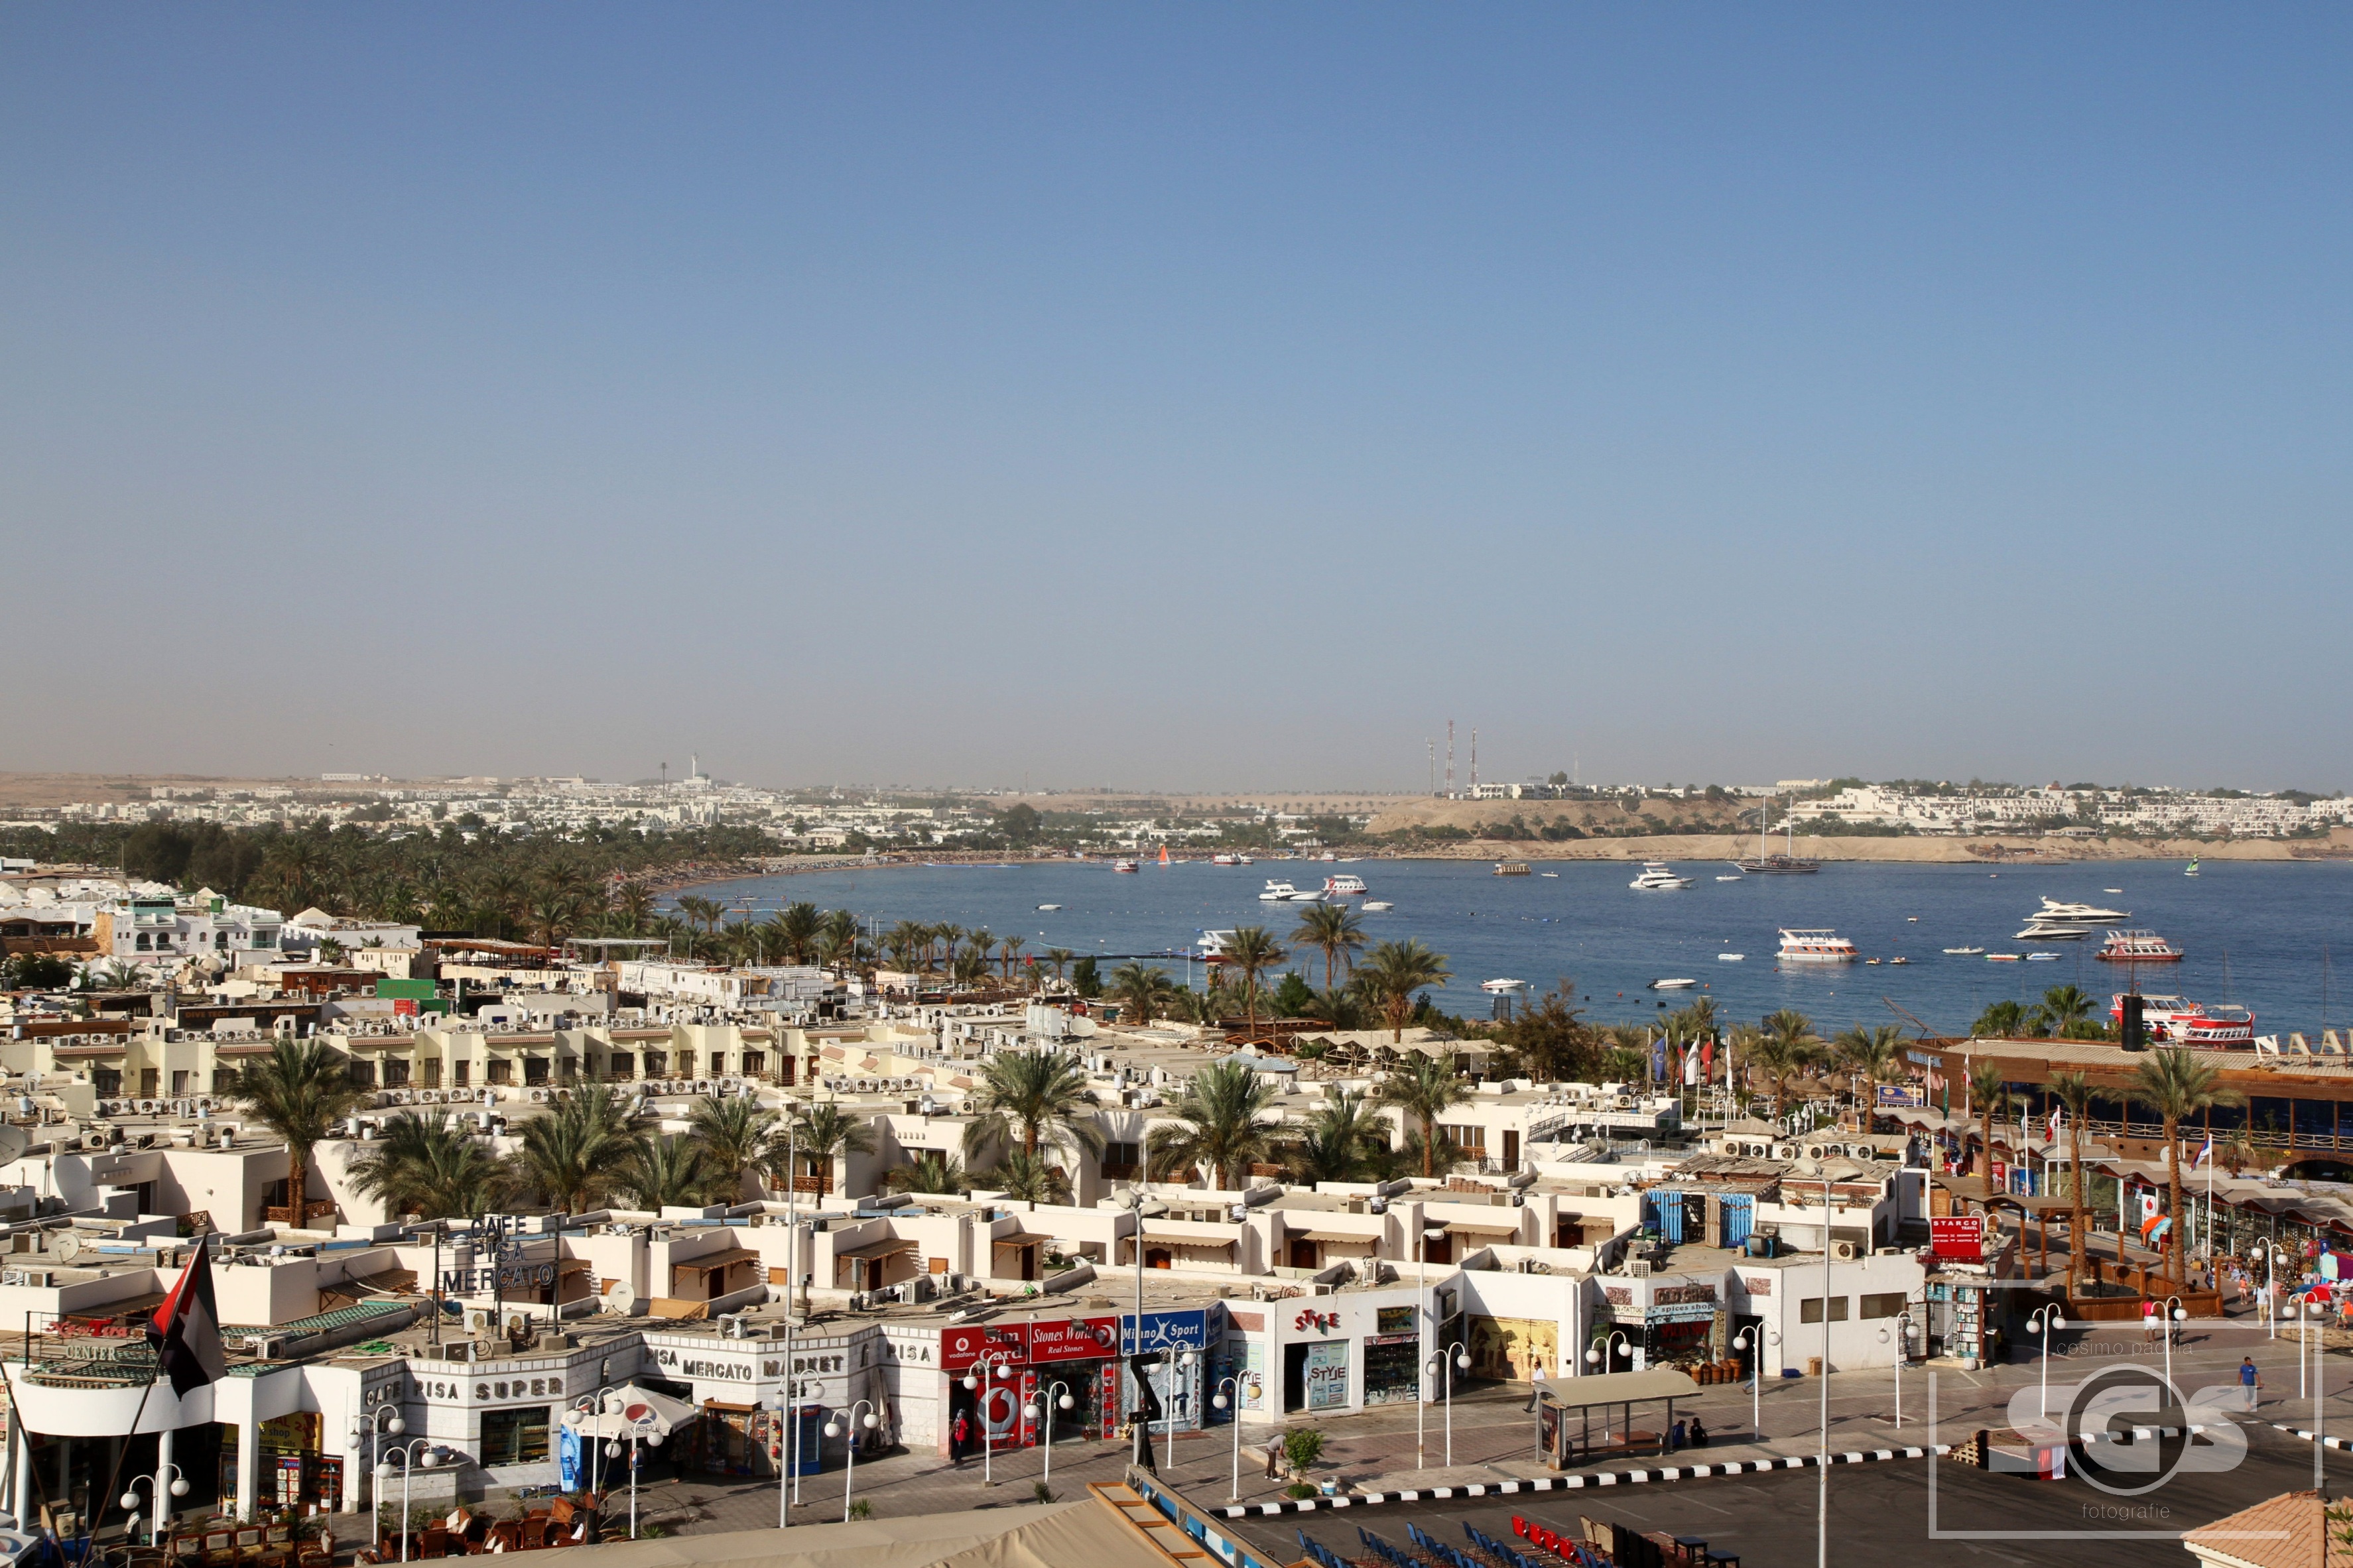
Dahab
Not to be confused with Oued Ed-Dahab Province in Moroccan Western Sahara. (Egyptian Arabic: دهب, IPA: [ˈdæhæb], "gold") is a small town situated on the southeast coast of the Sinai Peninsula in Egypt. Formerly a Bedouin fishing village, located app..
Dahab Wikipedia Page


About Our Data
The data on this page is estimated using a number of publicly available tools and resources. It is provided without warranty, and could contain inaccuracies. Use at your own risk.