Categories in Giza
Industries
Business Distribution by Industry in Giza
| Industry Description | Number of Establishments | Average Age of Business |
|---|---|---|
| Apartments | 2,971 | — |
| Shopping | 2,091 | — |
| Restaurants | 1,465 | 12 years |
| Grocery stores and supermarkets | 1,228 | — |
| Health and medical | 1,014 | — |
| Pharmacies and drug stores | 999 | — |
| Electronics stores | 867 | 21 years |
| Cafes | 862 | — |
| Corporate management | 721 | 26 years |
| Education | 650 | 29 years |
| Real estate | 645 | — |
| Clothing stores | 570 | — |
Giza Facts
| Area | 13.4 km² |
| Population | 424,282 |
| Male Population | 213,716 (50.4%) |
| Female Population | 210,566 (49.6%) |
| Population change (1975 to 2020) | +380.4% |
| Population change (2000 to 2020) | +77.1% |
| Median Age | 24.9 years (Male: 25.1, Female: 24.8) |
| Area Codes | 2 |
| Neighborhoods | Ad Doqi, فيصل, MOHANDESEEN, Oula, FAISAL |
| Local Time | |
| Timezone | Eastern European Summer Time |
| Lat & Lng | 30.00808, 31.21093 |
Map of Giza
Interactive Map
Giza Population
Years 1975 to 2020
| Data | 1975 | 1990 | 2000 | 2015 | 2020 |
|---|---|---|---|---|---|
| Population | 88,325 | 167,320 | 239,506 | 397,546 | 424,282 |
| Population Density | 6,603.7 / km² | 12,509.9 / km² | 17,907 / km² | 29,723.1 / km² | 31,722 / km² |
Giza Population change from 2000 to 2015
Increase of 66% from year 2000 to 2015
| Location | Change since 1975 | Change since 1990 | Change since 2000 |
|---|---|---|---|
| Giza | +350.1% | +137.6% | +66% |
| Giza Governorate | +289.9% | +119.4% | +59.8% |
| Egypt | +136.6% | +62.2% | +33.9% |
Giza Median Age
Median Age: 24.9 years
| Location | Median Age | Median Age (Female) | Median Age (Male) |
|---|---|---|---|
| Giza | 24.9 yrs | 24.8 yrs | 25.1 yrs |
| Giza Governorate | 23.1 yrs | 23 yrs | 23.1 yrs |
| Egypt | 22.8 yrs | 22.9 yrs | 22.7 yrs |
Giza Population Density
Population Density: 31,722 / km²
| Location | Population | Area | Density |
|---|---|---|---|
| Giza | 424,282 | 13.4 km² | 31,722 / km² |
| Giza Governorate | 8.8 million | 34,668.8 km² | 255 / km² |
| Egypt | 90.9 million | 980,394.9 km² | 92.7 / km² |
Giza Historical and Projected Population
Estimated Population from 1890 to 2100
- JRC (European Commission's Joint Research Centre) work on the GHS built-up grid
- CIESIN (Center for International Earth Science Information Network)
- [Link] Klein Goldewijk, K., Beusen, A., Doelman, J., and Stehfest, E.: Anthropogenic land use estimates for the Holocene – HYDE 3.2, Earth Syst. Sci. Data, 9, 927–953, https://doi.org/10.5194/essd-9-927-2017, 2017.
Neighborhoods in Giza
Percentage of businesses by neighborhood in Giza
Area Codes
Percentage Area Codes used by businesses in Giza
Price Distribution
Business distribution by price for Giza
Human Development Index (HDI)
Statistic composite index of life expectancy, education, and per capita income.
Giza CO2 Emissions
Carbon Dioxide (CO2) Emissions Per Capita in Tonnes Per Year
| Location | CO2 Emissions | CO2 Emissions Per Capita | CO2 Emissions Intensity |
|---|---|---|---|
| Giza | 1,131,091 tn | 2.67 tn | 84,567.5 tons/km² |
| Giza Governorate | 20,658,923 tn | 2.34 tn | 595.9 tons/km² |
| Egypt | 209,857,539 tn | 2.31 tn | 214.1 tons/km² |
| 2013 CO2 emissions (tonnes/year) | 1,131,091 tn |
| 2013 CO2 emissions (tonnes/year) per capita | 2.67 tn |
| 2013 CO2 emissions intensity (tonnes/km²/year) | 84,567.5 tons/km² |
Natural Hazards Risk
Relative risk out of 10
| Hazard | Risk Level |
|---|---|
| Earthquake | Medium (4) |
* Risk, particularly concerning flood or landslide, may not be for the entire area.
- Dilley, M., R.S. Chen, U. Deichmann, A.L. Lerner-Lam, M. Arnold, J. Agwe, P. Buys, O. Kjekstad, B. Lyon, and G. Yetman. 2005. Natural Disaster Hotspots: A Global Risk Analysis. Washington, D.C.: World Bank. https://doi.org/10.1596/0-8213-5930-4.
- Center for Hazards and Risk Research - CHRR - Columbia University, Center for International Earth Science Information Network - CIESIN - Columbia University. 2005. Global Earthquake Hazard Distribution - Peak Ground Acceleration. Palisades, NY: NASA Socioeconomic Data and Applications Center (SEDAC). https://doi.org/10.7927/H4BZ63ZS.
Recent Nearby Earthquakes
Magnitude 3.0 and greater
| Date▼ | Time↕ | Magnitude↕ | Distance↕ | Depth↕ | Location↕ | Link |
|---|---|---|---|---|---|---|
| 3/30/18 | 7:44 AM | 3.3 | 39.6 km | 10,000 m | 33km ENE of Halwan, Egypt | usgs.gov |
| 1/21/17 | 4:54 PM | 4.3 | 63.6 km | 10,000 m | 35km SE of Bilbays, Egypt | usgs.gov |
| 2/16/12 | 2:15 AM | 4.3 | 64.7 km | 10,000 m | Egypt | usgs.gov |
| 6/21/08 | 5:59 PM | 4.3 | 60.8 km | 6,200 m | Egypt | usgs.gov |
| 7/31/05 | 4:16 PM | 4.1 | 38.5 km | 22,000 m | Egypt | usgs.gov |
| 4/16/05 | 7:55 PM | 4.4 | 79.6 km | 10,000 m | Egypt | usgs.gov |
| 8/24/02 | 8:01 PM | 4.4 | 28.6 km | 10,000 m | Egypt | usgs.gov |
| 12/17/01 | 4:25 AM | 4.4 | 33 km | 10,000 m | Egypt | usgs.gov |
| 6/12/01 | 1:43 PM | 4.4 | 45.6 km | 10,000 m | Egypt | usgs.gov |
| 12/28/99 | 12:05 PM | 3.9 | 35.7 km | 10,000 m | Egypt | usgs.gov |
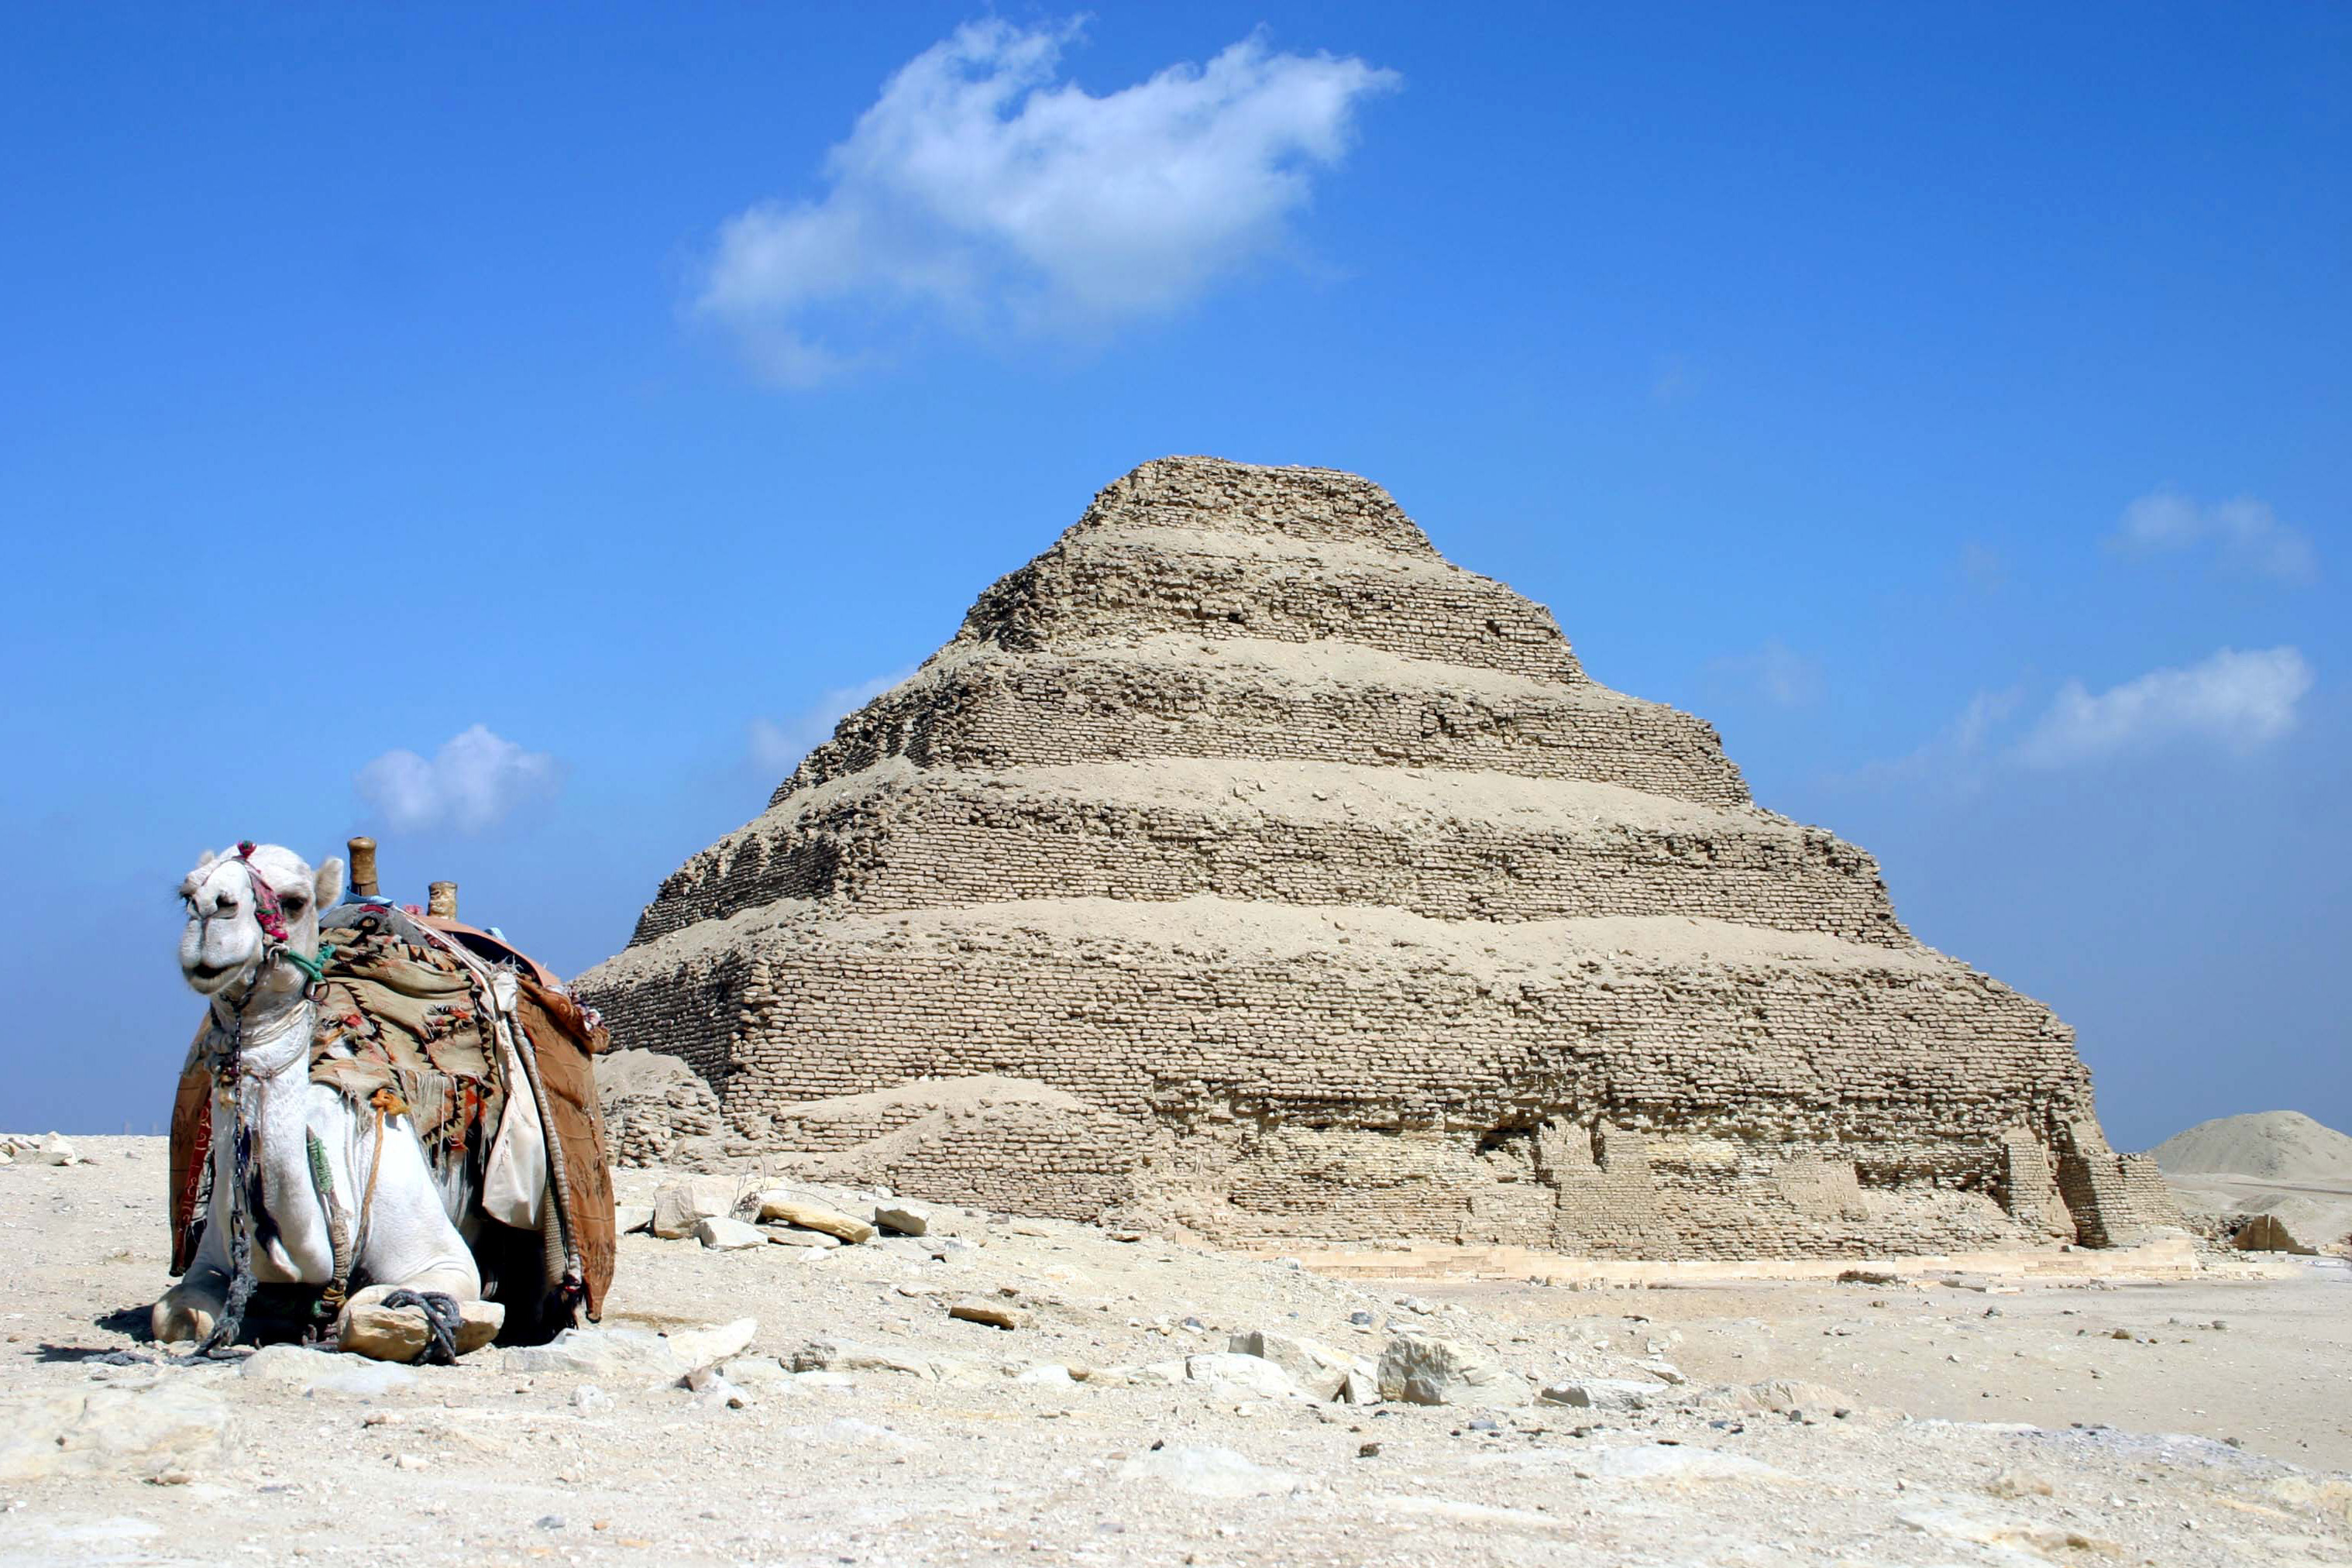
Giza
Giza (/ˈɡiːzə/; sometimes spelt Gizah or Jizah; Coptic: ⲅⲓⲍⲁ Giza; Egyptian Arabic: الجيزة el-Gīza), is the third-largest city in Egypt. It is located on the west bank of the Nile, some 20 km (12.43 mi) southwest of central Cairo. Along with Cairo Go..
Giza Wikipedia Page


About Our Data
The data on this page is estimated using a number of publicly available tools and resources. It is provided without warranty, and could contain inaccuracies. Use at your own risk.