Categories in Asmara
Industries
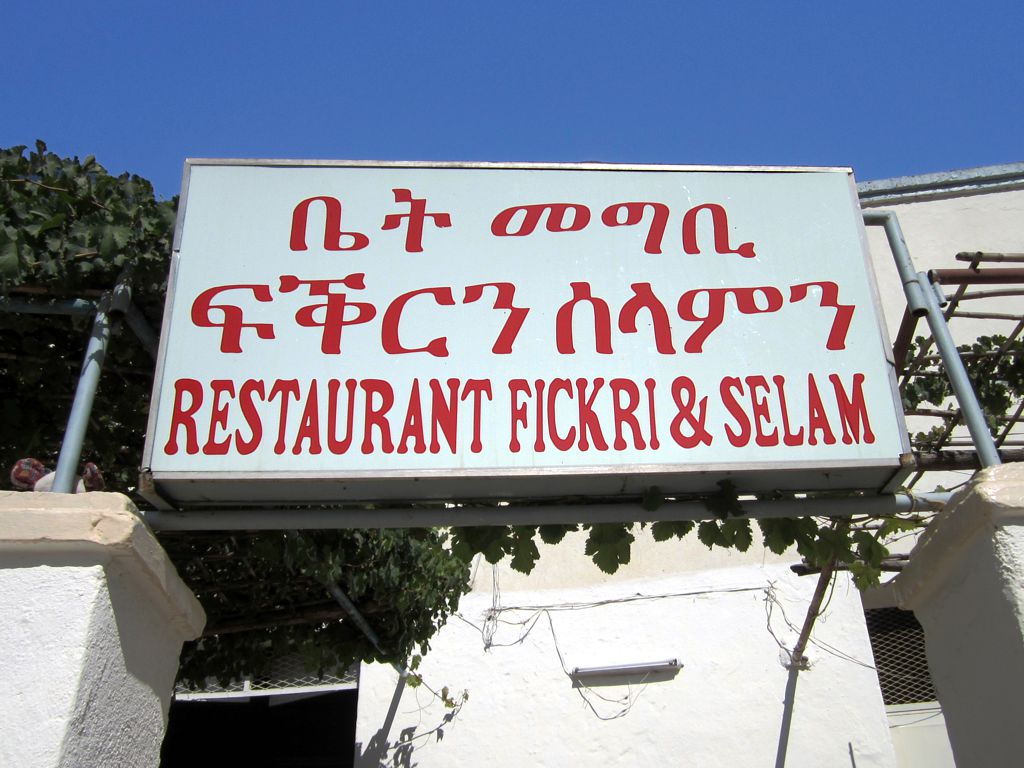
Business Distribution by Industry in Asmara
| Industry Description | Number of Establishments |
|---|---|
| Churches | 69 |
| Education | 68 |
| Restaurants | 51 |
| Public administration | 44 |
| Bars, pubs and taverns | 43 |
| Other accommodation | 30 |
| Cafes | 27 |
| Hotels and motels | 25 |
| Gas station | 24 |
| Apartments | 19 |
| Grocery stores and supermarkets | 19 |
| Mosques | 18 |
| Hospitals | 16 |
| Shopping | 15 |
Asmara Facts
| Area | 97.9 km² |
| Population | 700,098 |
| Male Population | 349,072 (49.9%) |
| Female Population | 351,026 (50.1%) |
| Population change (1975 to 2020) | +195.5% |
| Population change (2000 to 2020) | +60.4% |
| Median Age | 18.2 years (Male: 17.7, Female: 18.7) |
| Neighborhoods | Alfa Romeo |
| Local Time | |
| Timezone | East Africa Time |
| Lat & Lng | 15.33805, 38.93184 |
Map of Asmara
Interactive Map
Asmara Population
Years 1975 to 2020
| Data | 1975 | 1990 | 2000 | 2015 | 2020 |
|---|---|---|---|---|---|
| Population | 236,895 | 380,581 | 436,417 | 635,686 | 700,098 |
| Population Density | 2,420.4 / km² | 3,888.4 / km² | 4,458.9 / km² | 6,494.9 / km² | 7,153 / km² |
Asmara Population change from 2000 to 2015
Increase of 45.7% from year 2000 to 2015
| Location | Change since 1975 | Change since 1990 | Change since 2000 |
|---|---|---|---|
| Asmara | +168.3% | +67% | +45.7% |
| Maekel Region | +178.5% | +70.2% | +48.6% |
| Eritrea | +155.2% | +65.7% | +46.8% |
Asmara Median Age
Median Age: 18.2 years
| Location | Median Age | Median Age (Female) | Median Age (Male) |
|---|---|---|---|
| Asmara | 18.2 yrs | 18.7 yrs | 17.7 yrs |
| Maekel Region | 18.2 yrs | 18.7 yrs | 17.7 yrs |
| Eritrea | 18.2 yrs | 18.7 yrs | 17.7 yrs |
Asmara Population Density
Population Density: 7,153 / km²
| Location | Population | Area | Density |
|---|---|---|---|
| Asmara | 700,098 | 97.9 km² | 7,153 / km² |
| Maekel Region | 796,208 | 1,561.4 km² | 510 / km² |
| Eritrea | 4.8 million | 121,227 km² | 39.3 / km² |
Asmara Historical and Projected Population
Estimated Population from 1860 to 2100
- JRC (European Commission's Joint Research Centre) work on the GHS built-up grid
- CIESIN (Center for International Earth Science Information Network)
- [Link] Klein Goldewijk, K., Beusen, A., Doelman, J., and Stehfest, E.: Anthropogenic land use estimates for the Holocene – HYDE 3.2, Earth Syst. Sci. Data, 9, 927–953, https://doi.org/10.5194/essd-9-927-2017, 2017.
Price Distribution
Business distribution by price for Asmara
Human Development Index (HDI)
Statistic composite index of life expectancy, education, and per capita income.
Asmara CO2 Emissions
Carbon Dioxide (CO2) Emissions Per Capita in Tonnes Per Year
| Location | CO2 Emissions | CO2 Emissions Per Capita | CO2 Emissions Intensity |
|---|---|---|---|
| Asmara | 117,845 tn | 0.17 tn | 1,204 tons/km² |
| Maekel Region | 134,023 tn | 0.17 tn | 85.8 tons/km² |
| Eritrea | 786,978 tn | 0.17 tn | 6.5 tons/km² |
| 2013 CO2 emissions (tonnes/year) | 117,845 tn |
| 2013 CO2 emissions (tonnes/year) per capita | 0.17 tn |
| 2013 CO2 emissions intensity (tonnes/km²/year) | 1,204 tons/km² |
Natural Hazards Risk
Relative risk out of 10
| Hazard | Risk Level |
|---|---|
| Drought | High (9) |
| Earthquake | Medium (4) |
* Risk, particularly concerning flood or landslide, may not be for the entire area.
- Dilley, M., R.S. Chen, U. Deichmann, A.L. Lerner-Lam, M. Arnold, J. Agwe, P. Buys, O. Kjekstad, B. Lyon, and G. Yetman. 2005. Natural Disaster Hotspots: A Global Risk Analysis. Washington, D.C.: World Bank. https://doi.org/10.1596/0-8213-5930-4.
- Center for Hazards and Risk Research - CHRR - Columbia University, Center for International Earth Science Information Network - CIESIN - Columbia University, and International Research Institute for Climate and Society - IRI - Columbia University. 2005. Global Drought Hazard Frequency and Distribution. Palisades, NY: NASA Socioeconomic Data and Applications Center (SEDAC). https://doi.org/10.7927/H4VX0DFT.
- Center for Hazards and Risk Research - CHRR - Columbia University, Center for International Earth Science Information Network - CIESIN - Columbia University. 2005. Global Earthquake Hazard Distribution - Peak Ground Acceleration. Palisades, NY: NASA Socioeconomic Data and Applications Center (SEDAC). https://doi.org/10.7927/H4BZ63ZS.
Recent Nearby Earthquakes
Magnitude 3.0 and greater
| Date▼ | Time↕ | Magnitude↕ | Distance↕ | Depth↕ | Location↕ | Link |
|---|---|---|---|---|---|---|
| 6/29/18 | 2:45 PM | 4.3 | 96.5 km | 10,000 m | 46km ESE of Massawa, Eritrea | usgs.gov |
| 6/19/18 | 2:06 PM | 4.6 | 95.4 km | 10,000 m | 32km ENE of Massawa, Eritrea | usgs.gov |
| 9/18/13 | 9:04 AM | 5 | 63.8 km | 10,080 m | 15km NNW of Massawa, Eritrea | usgs.gov |
| 3/25/11 | 5:21 AM | 4.8 | 86.5 km | 10,000 m | Eritrea | usgs.gov |
| 4/25/08 | 2:13 AM | 4 | 91.5 km | 10,000 m | Eritrea | usgs.gov |
| 4/16/96 | 12:32 PM | 3.9 | 66.2 km | 10,000 m | Eritrea | usgs.gov |
| 2/20/96 | 8:36 AM | 4.5 | 56.5 km | 33,000 m | Eritrea | usgs.gov |
| 9/10/95 | 12:30 PM | 4.5 | 58.3 km | 10,000 m | Eritrea | usgs.gov |
| 11/10/79 | 5:42 PM | 4.3 | 91.5 km | 10,000 m | Eritrea-Ethiopia border region | usgs.gov |
| 9/23/15 | 8:14 AM | 6.2 | 98.1 km | 10,000 m | Eritrea-Ethiopia border region | usgs.gov |
Asmara
Asmara (Tigrinya: ኣስመራ?, Asmera), known locally as Asmera (meaning "The four (feminine plural) made them unite" in Tigrinya), is the capital city and largest settlement in Eritrea. Home to a population of around 649,000 inhabitants, it sits at an ele..
Asmara Wikipedia Page


About Our Data
The data on this page is estimated using a number of publicly available tools and resources. It is provided without warranty, and could contain inaccuracies. Use at your own risk.