Antillón Facts
| Area | 24.3 km² |
| Population | 143 |
| Male Population | 71 (49.9%) |
| Female Population | 72 (50.1%) |
| Population change (1975 to 2020) | +11.7% |
| Population change (2000 to 2020) | +5.9% |
| Median Age | 55.3 years (Male: 55.7, Female: 54.9) |
| Local Time | |
| Timezone | Central European Summer Time |
| Lat & Lng | 42.03639, -0.16239 |
Map of Antillón
Interactive Map
Antillón Population
Years 1975 to 2020
| Data | 1975 | 1990 | 2000 | 2015 | 2020 |
|---|---|---|---|---|---|
| Population | 128 | 135 | 135 | 142 | 143 |
| Population Density | 5.3 / km² | 5.6 / km² | 5.6 / km² | 5.9 / km² | 5.9 / km² |
Antillón Population change from 2000 to 2015
Increase of 5.2% from year 2000 to 2015
| Location | Change since 1975 | Change since 1990 | Change since 2000 |
|---|---|---|---|
| Antillón | +10.9% | +5.2% | +5.2% |
| Spain | +28.4% | +17.7% | +13.2% |
Antillón Median Age
Median Age: 55.3 years
| Location | Median Age | Median Age (Female) | Median Age (Male) |
|---|---|---|---|
| Antillón | 55.3 yrs | 54.9 yrs | 55.7 yrs |
| Spain | 40.8 yrs | 42 yrs | 39.7 yrs |
Antillón Population Density
Population Density: 5.9 / km²
| Location | Population | Area | Density |
|---|---|---|---|
| Antillón | 143 | 24.3 km² | 5.9 / km² |
| Spain | 45.3 million | 505,993.5 km² | 89.5 / km² |
Antillón Historical and Projected Population
Estimated Population from 0 to 2100
- JRC (European Commission's Joint Research Centre) work on the GHS built-up grid
- CIESIN (Center for International Earth Science Information Network)
- [Link] Klein Goldewijk, K., Beusen, A., Doelman, J., and Stehfest, E.: Anthropogenic land use estimates for the Holocene – HYDE 3.2, Earth Syst. Sci. Data, 9, 927–953, https://doi.org/10.5194/essd-9-927-2017, 2017.
Human Development Index (HDI)
Statistic composite index of life expectancy, education, and per capita income.
Antillón CO2 Emissions
Carbon Dioxide (CO2) Emissions Per Capita in Tonnes Per Year
| Location | CO2 Emissions | CO2 Emissions Per Capita | CO2 Emissions Intensity |
|---|---|---|---|
| Antillón | 1,088 tn | 7.61 tn | 44.9 tons/km² |
| Spain | 330,097,501 tn | 7.29 tn | 652.4 tons/km² |
| 2013 CO2 emissions (tonnes/year) | 1,088 tn |
| 2013 CO2 emissions (tonnes/year) per capita | 7.61 tn |
| 2013 CO2 emissions intensity (tonnes/km²/year) | 44.9 tons/km² |
Recent Nearby Earthquakes
Magnitude 3.0 and greater
| Date▼ | Time↕ | Magnitude↕ | Distance↕ | Depth↕ | Location↕ | Link |
|---|---|---|---|---|---|---|
| 12/29/08 | 12:24 PM | 3 | 33.4 km | 2,000 m | Spain | usgs.gov |
| 2/15/08 | 7:34 AM | 3.9 | 72.1 km | 4,000 m | Pyrenees | usgs.gov |
| 2/3/07 | 3:34 PM | 3 | 93 km | 5,000 m | Pyrenees | usgs.gov |
| 1/24/07 | 4:13 AM | 3 | 79.3 km | 0 m | Pyrenees | usgs.gov |
| 12/2/03 | 4:40 PM | 3.1 | 98.1 km | 2,000 m | Pyrenees | usgs.gov |
| 12/16/02 | 4:20 PM | 3.3 | 72.9 km | 10,000 m | Pyrenees | usgs.gov |
| 7/5/02 | 4:26 PM | 3.1 | 70.1 km | 1,500 m | Pyrenees | usgs.gov |
| 5/16/02 | 2:56 PM | 4.8 | 99.2 km | 3,000 m | Pyrenees | usgs.gov |
| 3/17/01 | 9:46 PM | 3 | 87.3 km | 8,000 m | Pyrenees | usgs.gov |
| 11/28/00 | 5:25 PM | 3 | 30.1 km | 2,000 m | Pyrenees | usgs.gov |
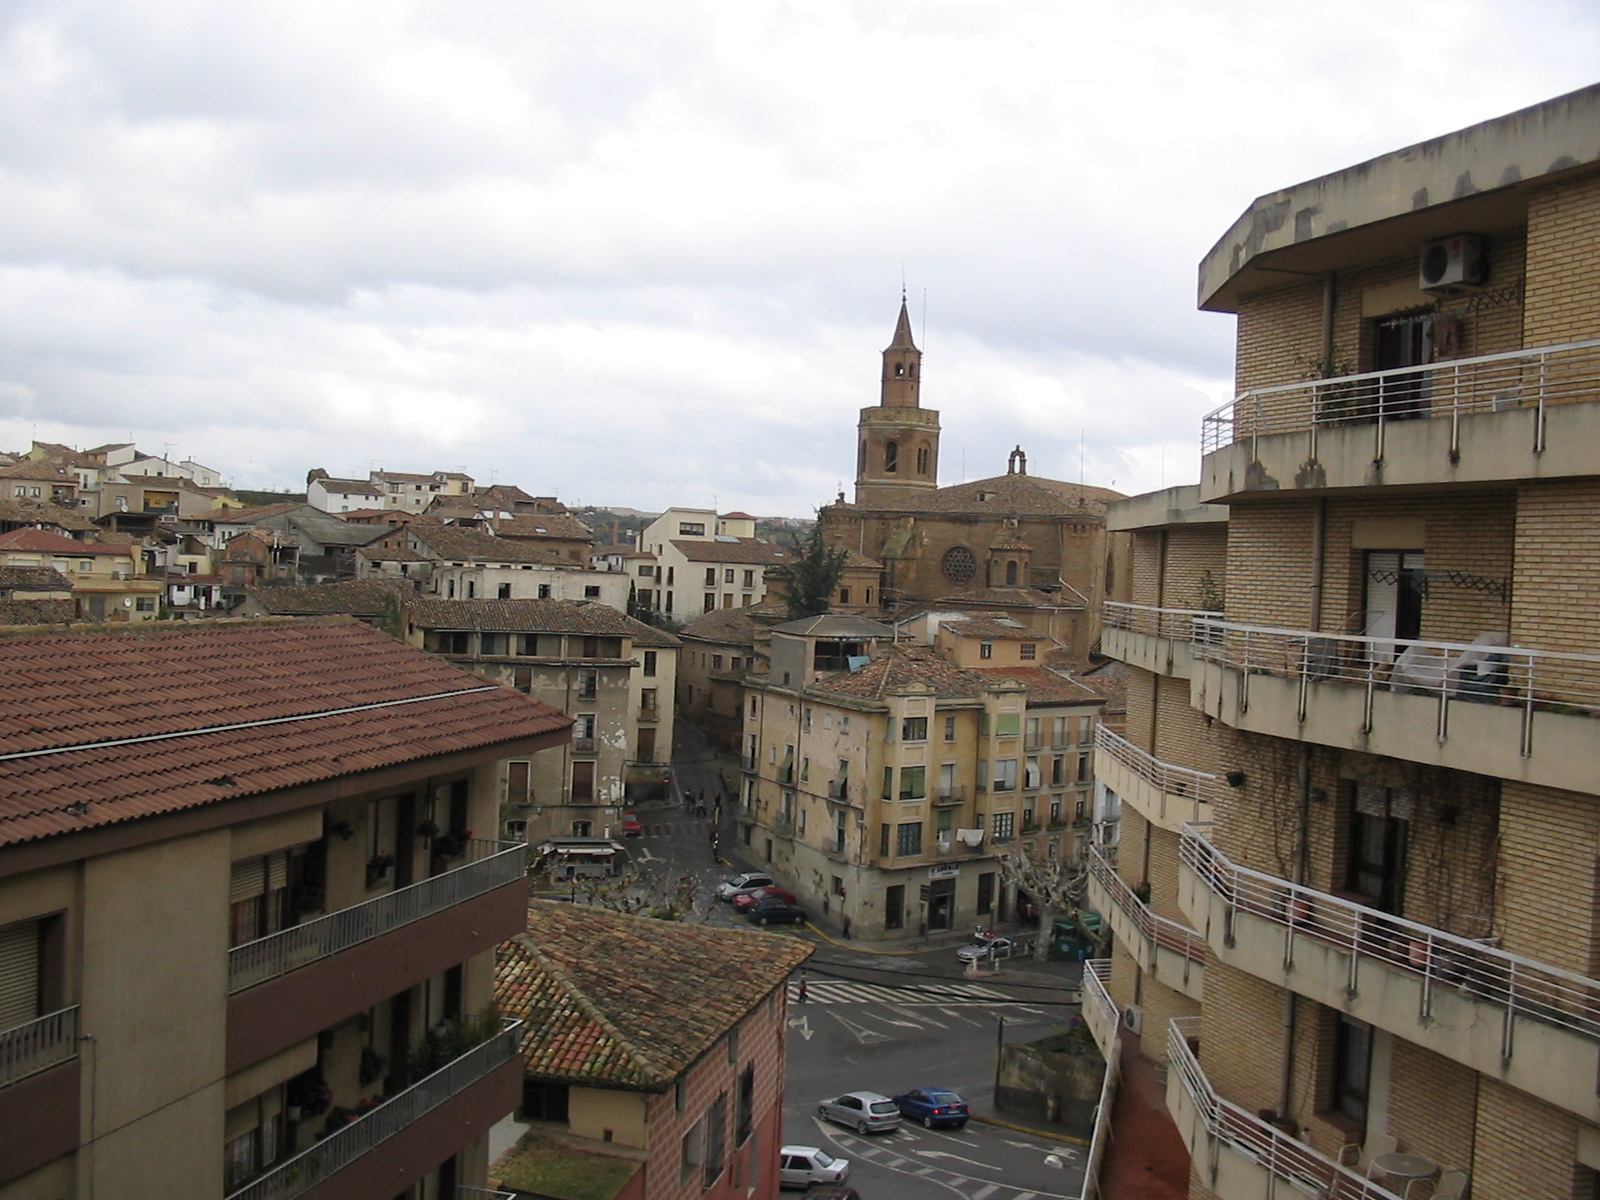
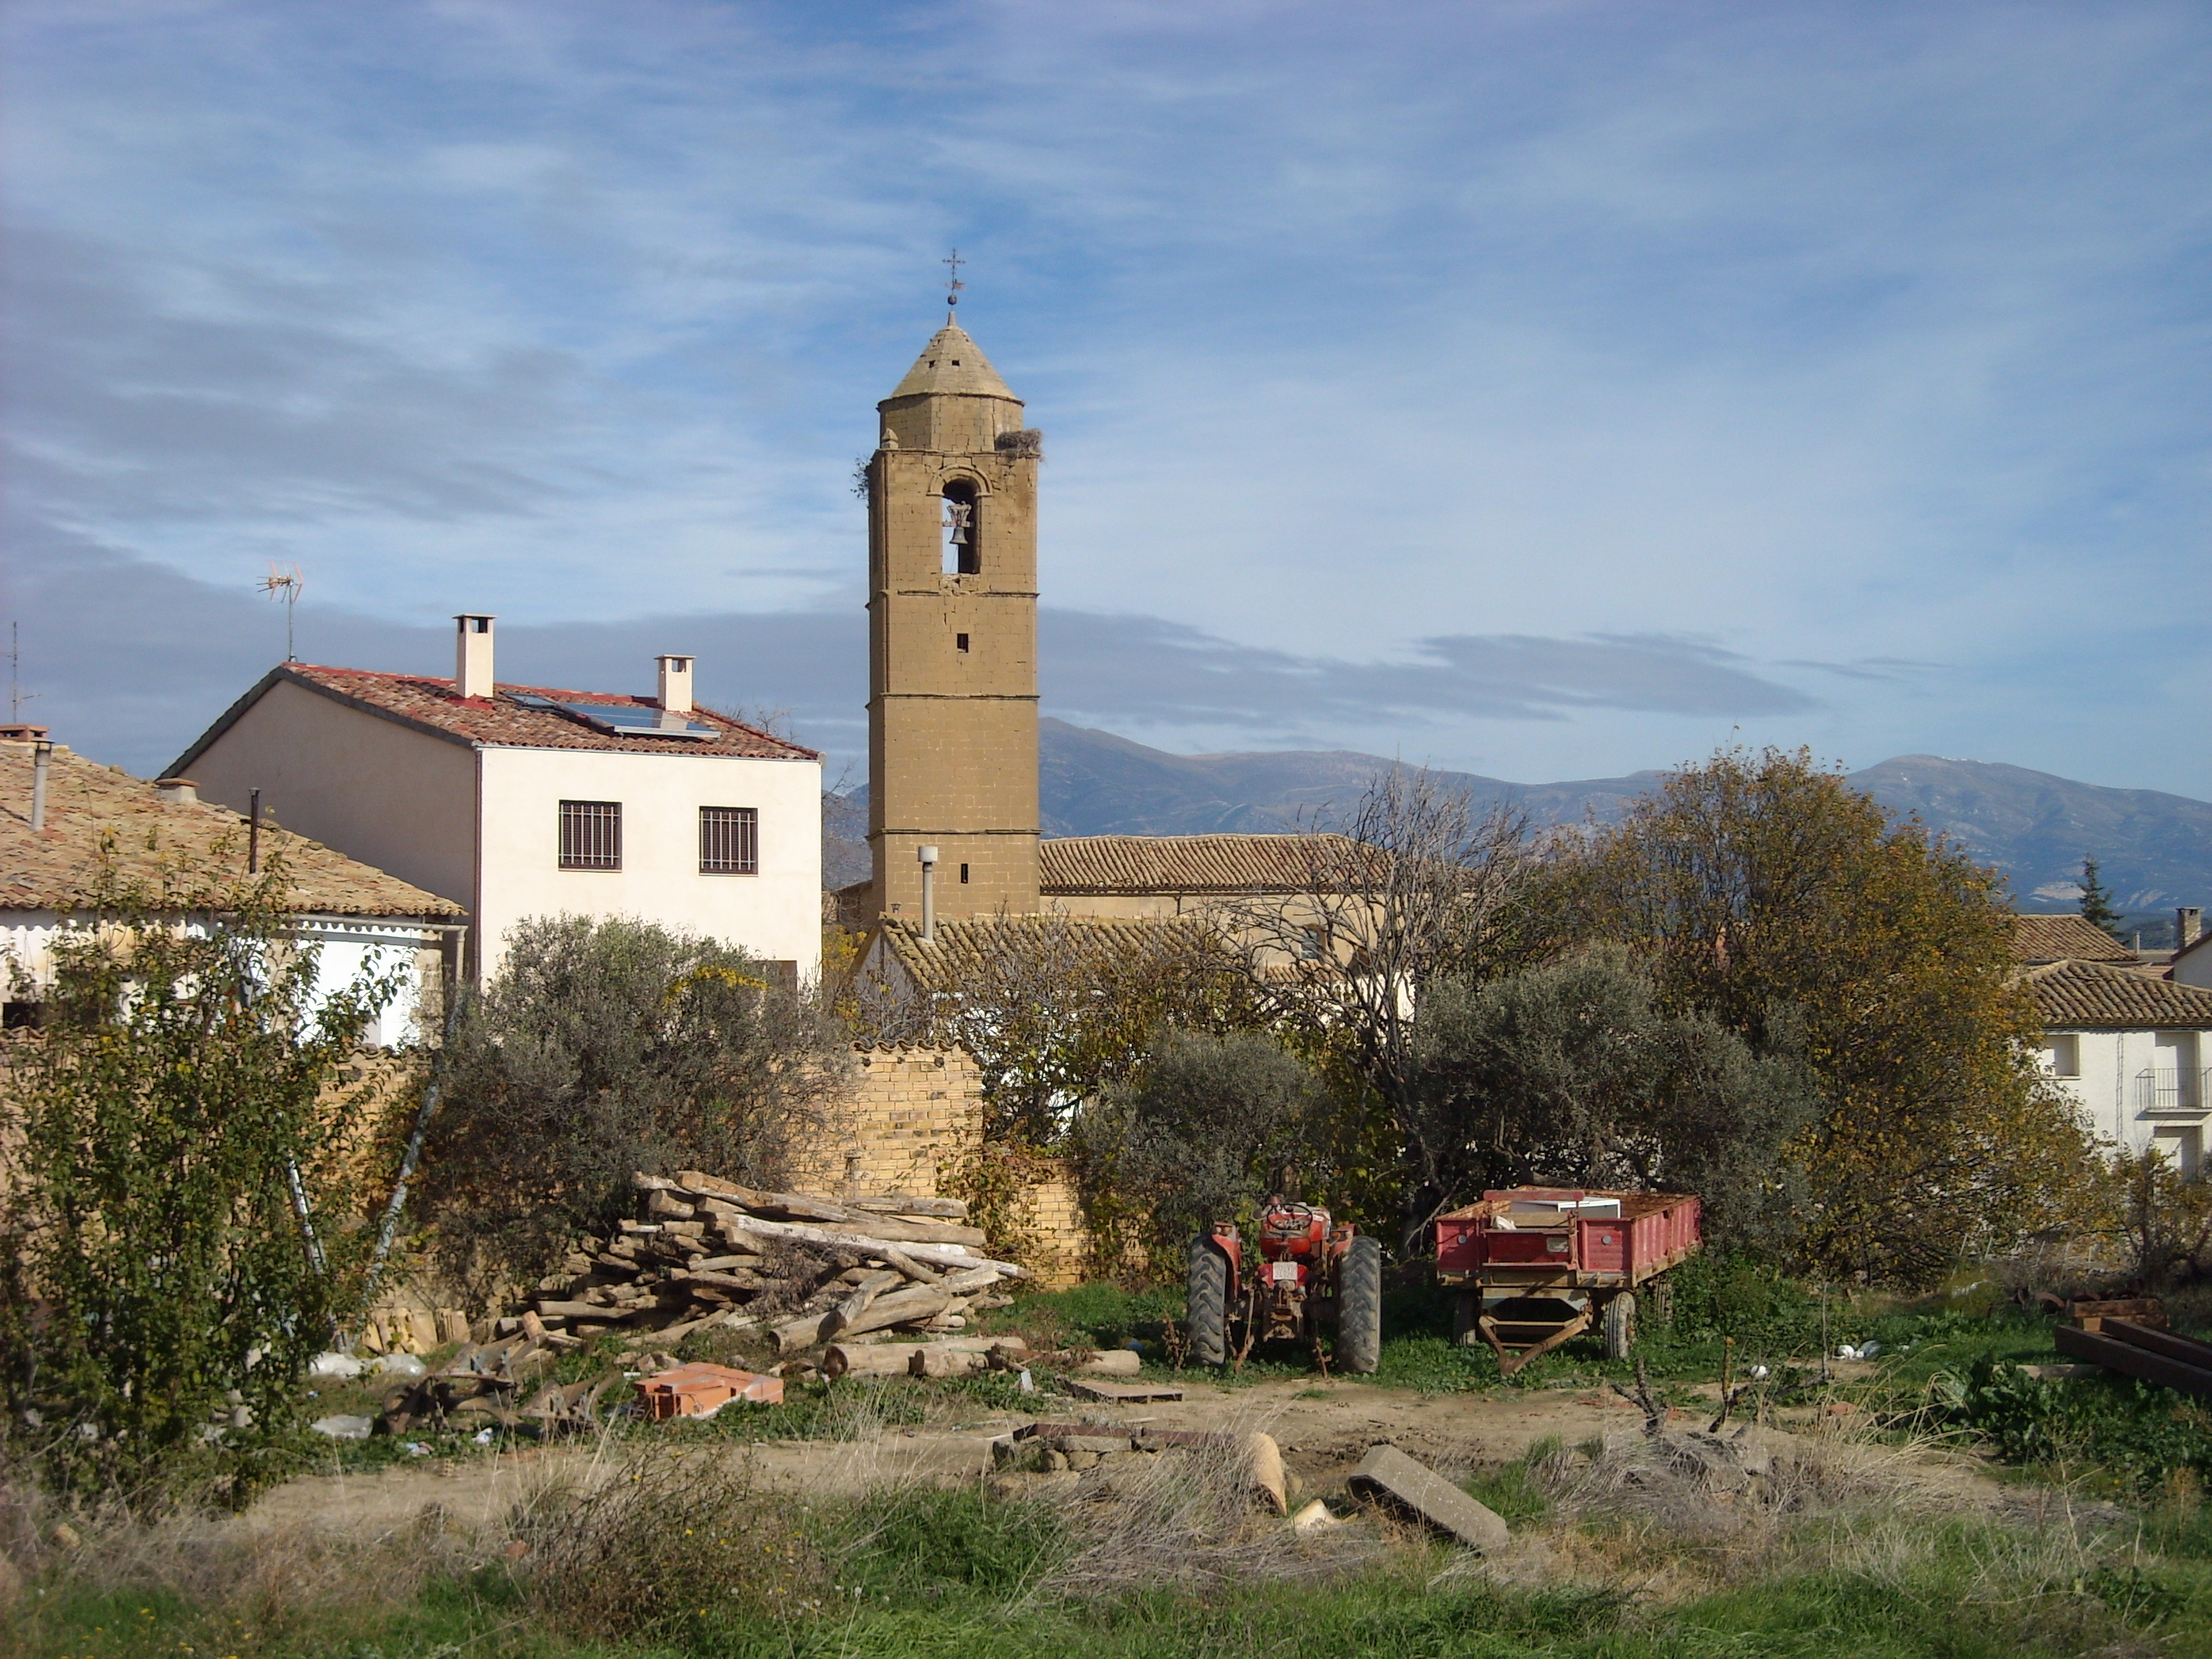
Antillón
Antillón is a municipality located in the province of Huesca, Aragon, Spain. As of 2010, (INE), the municipality has a population of 150 inhabitants. parish church was built between the eleventh and the sixteenth century, so it has parts in Romanesq..
Antillón Wikipedia Page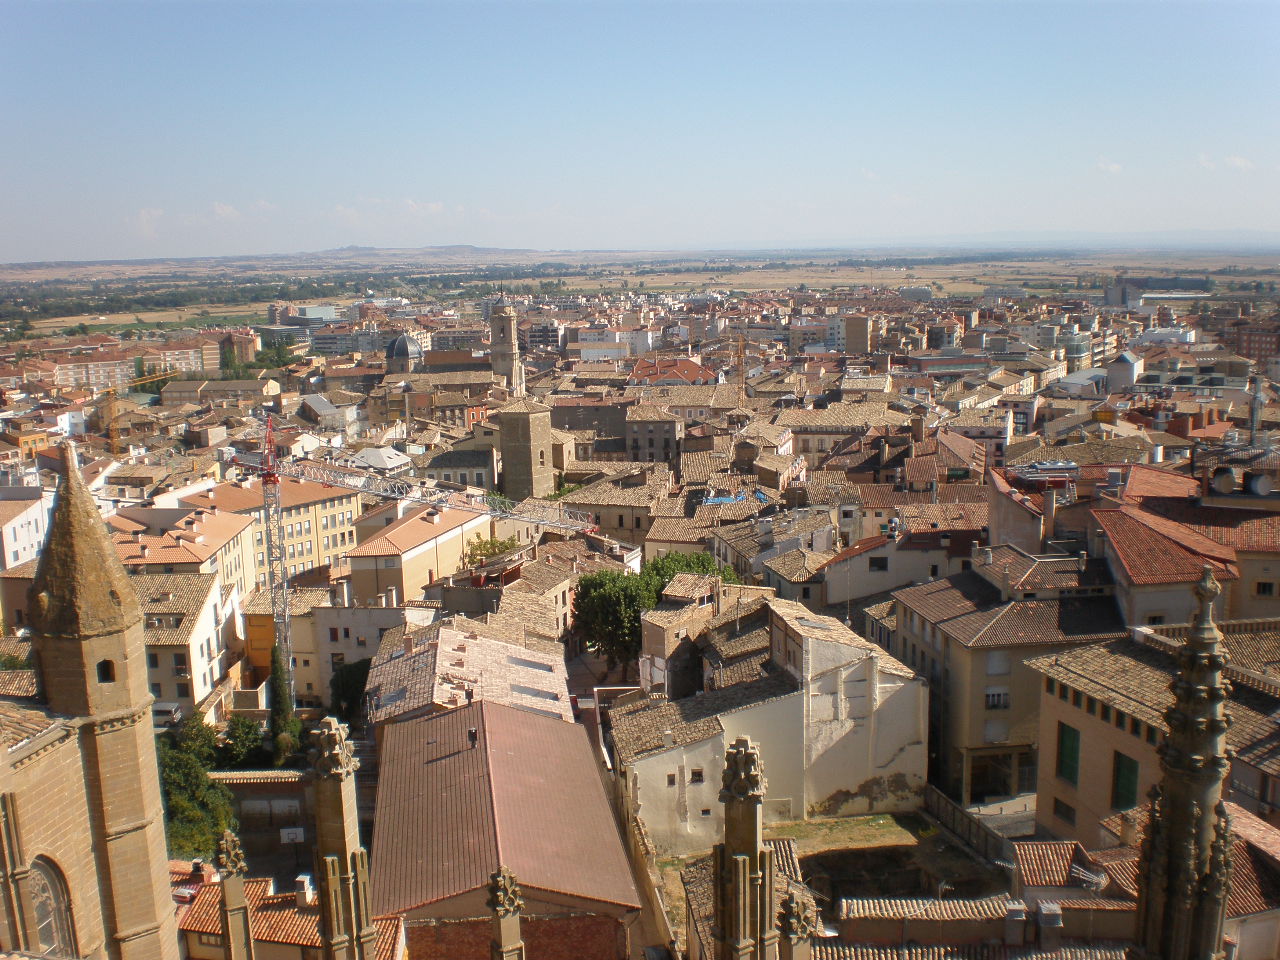
About Our Data
The data on this page is estimated using a number of publicly available tools and resources. It is provided without warranty, and could contain inaccuracies. Use at your own risk.