Categories in Burela
Industries
Business Distribution by Industry in Burela
| Industry Description | Number of Establishments |
|---|---|
| Shopping | 56 |
| Restaurants | 37 |
| Hospitals | 36 |
| Corporate management | 30 |
| Grocery stores and supermarkets | 27 |
| Clothing stores | 26 |
| Bars, pubs and taverns | 26 |
| Beauty salons | 19 |
| Car repair | 18 |
| Hairdressers | 18 |
| Shopping other | 18 |
| Lawyers legal | 17 |
| Seafood stores | 16 |
| Real estate | 16 |
| Health and medical | 15 |
| Construction of buildings | 15 |
| All food and beverage | 15 |
| Atm's | 14 |
| Financial services | 13 |
| Public administration | 13 |
| Travel agencies | 13 |
| Banks | 13 |
Burela Facts
| Area | 1.6 km² |
| Population | 4,715 |
| Male Population | 2,388 (50.6%) |
| Female Population | 2,327 (49.4%) |
| Population change (1975 to 2020) | -32.5% |
| Population change (2000 to 2020) | -11.5% |
| Median Age | 40.3 years (Male: 39.2, Female: 41.5) |
| Local Time | |
| Timezone | Central European Summer Time |
| Lat & Lng | 43.65000, -7.40000 |
| Postal Codes | 27880 |
Map of Burela
Interactive Map
Burela Population
Years 1975 to 2020
| Data | 1975 | 1990 | 2000 | 2015 | 2020 |
|---|---|---|---|---|---|
| Population | 6,982 | 6,038 | 5,329 | 4,592 | 4,715 |
| Population Density | 4,468.5 / km² | 3,864.3 / km² | 3,410.6 / km² | 2,938.9 / km² | 3,017.6 / km² |
Burela Population change from 2000 to 2015
Decrease of 13.8% from year 2000 to 2015
| Location | Change since 1975 | Change since 1990 | Change since 2000 |
|---|---|---|---|
| Burela | -34.2% | -23.9% | -13.8% |
| Spain | +28.4% | +17.7% | +13.2% |
Burela Median Age
Median Age: 40.3 years
| Location | Median Age | Median Age (Female) | Median Age (Male) |
|---|---|---|---|
| Burela | 40.3 yrs | 41.5 yrs | 39.2 yrs |
| Spain | 40.8 yrs | 42 yrs | 39.7 yrs |
Burela Population Density
Population Density: 3,018 / km²
| Location | Population | Area | Density |
|---|---|---|---|
| Burela | 4,715 | 1.563 km² | 3,018 / km² |
| Spain | 45.3 million | 505,993.5 km² | 89.5 / km² |
Burela Historical and Projected Population
Estimated Population from 0 to 2100
- JRC (European Commission's Joint Research Centre) work on the GHS built-up grid
- CIESIN (Center for International Earth Science Information Network)
- [Link] Klein Goldewijk, K., Beusen, A., Doelman, J., and Stehfest, E.: Anthropogenic land use estimates for the Holocene – HYDE 3.2, Earth Syst. Sci. Data, 9, 927–953, https://doi.org/10.5194/essd-9-927-2017, 2017.
Area Codes
Percentage Area Codes used by businesses in Burela
Price Distribution
Business distribution by price for Burela
Human Development Index (HDI)
Statistic composite index of life expectancy, education, and per capita income.
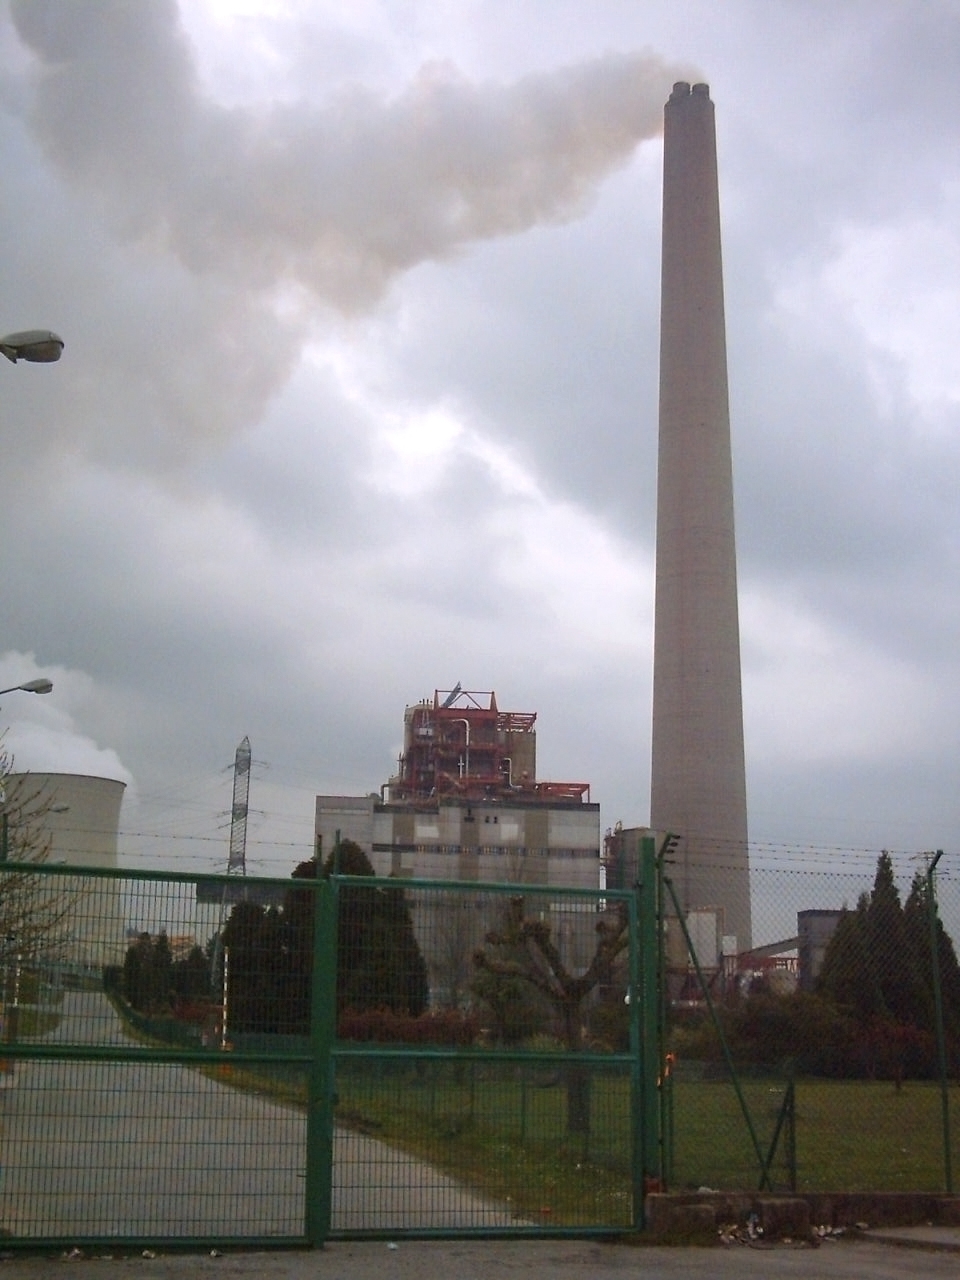
Burela CO2 Emissions
Carbon Dioxide (CO2) Emissions Per Capita in Tonnes Per Year
| Location | CO2 Emissions | CO2 Emissions Per Capita | CO2 Emissions Intensity |
|---|---|---|---|
| Burela | 35,865 tn | 7.61 tn | 22,953.9 tons/km² |
| Spain | 330,097,501 tn | 7.29 tn | 652.4 tons/km² |
| 2013 CO2 emissions (tonnes/year) | 35,865 tn |
| 2013 CO2 emissions (tonnes/year) per capita | 7.61 tn |
| 2013 CO2 emissions intensity (tonnes/km²/year) | 22,953.9 tons/km² |
Natural Hazards Risk
Relative risk out of 10
| Hazard | Risk Level |
|---|---|
| Drought | Low (2) |
| Earthquake | Low (2.5) |
* Risk, particularly concerning flood or landslide, may not be for the entire area.
- Dilley, M., R.S. Chen, U. Deichmann, A.L. Lerner-Lam, M. Arnold, J. Agwe, P. Buys, O. Kjekstad, B. Lyon, and G. Yetman. 2005. Natural Disaster Hotspots: A Global Risk Analysis. Washington, D.C.: World Bank. https://doi.org/10.1596/0-8213-5930-4.
- Center for Hazards and Risk Research - CHRR - Columbia University, Center for International Earth Science Information Network - CIESIN - Columbia University, and International Research Institute for Climate and Society - IRI - Columbia University. 2005. Global Drought Hazard Frequency and Distribution. Palisades, NY: NASA Socioeconomic Data and Applications Center (SEDAC). https://doi.org/10.7927/H4VX0DFT.
- Center for Hazards and Risk Research - CHRR - Columbia University, Center for International Earth Science Information Network - CIESIN - Columbia University. 2005. Global Earthquake Hazard Distribution - Peak Ground Acceleration. Palisades, NY: NASA Socioeconomic Data and Applications Center (SEDAC). https://doi.org/10.7927/H4BZ63ZS.
Recent Nearby Earthquakes
Magnitude 3.0 and greater
| Date▼ | Time↕ | Magnitude↕ | Distance↕ | Depth↕ | Location↕ | Link |
|---|---|---|---|---|---|---|
| 2/28/08 | 1:16 AM | 4.1 | 54.1 km | 23,300 m | Spain | usgs.gov |
| 7/21/02 | 7:31 AM | 3.3 | 50.8 km | 300 m | North Atlantic Ocean | usgs.gov |
| 8/27/01 | 8:08 AM | 3 | 91.8 km | 11,900 m | Spain | usgs.gov |
| 7/26/01 | 10:34 PM | 3.3 | 65.6 km | 20,300 m | Spain | usgs.gov |
| 4/10/01 | 5:09 PM | 3.7 | 54.5 km | 10,000 m | North Atlantic Ocean | usgs.gov |
| 4/10/01 | 12:37 AM | 3.1 | 80.2 km | 5,000 m | Spain | usgs.gov |
| 4/10/01 | 12:00 AM | 3.4 | 81 km | 10,000 m | Spain | usgs.gov |
| 4/9/01 | 11:59 PM | 3.4 | 78.5 km | 10,000 m | Spain | usgs.gov |
| 4/9/01 | 11:58 PM | 3.1 | 78.5 km | 10,000 m | Spain | usgs.gov |
| 9/23/99 | 9:07 AM | 3.4 | 73.6 km | 15,700 m | North Atlantic Ocean | usgs.gov |
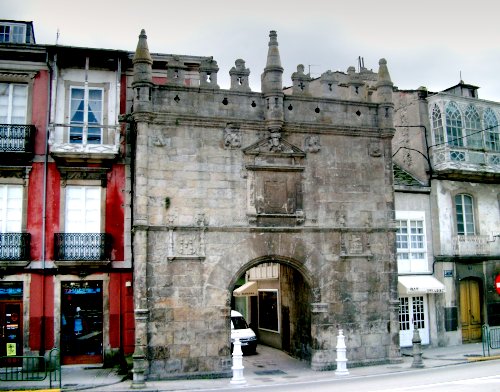
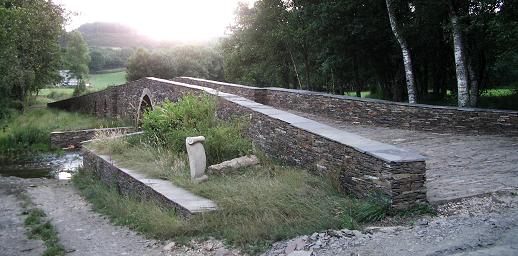
Burela
Burela is a municipality in the Galician province of Lugo. It is in the comarca of A Mariña. Burela is a coastal town on the shores of the Cantabrian Sea. An extension area of 8.2 square kilometers was created in 1994, following the segregation of th..
Burela Wikipedia Page
About Our Data
The data on this page is estimated using a number of publicly available tools and resources. It is provided without warranty, and could contain inaccuracies. Use at your own risk.