Categories in Gelsa
Gelsa Facts
| Area | 1.4 km² |
| Population | 812 |
| Male Population | 424 (52.2%) |
| Female Population | 388 (47.8%) |
| Population change (1975 to 2020) | +31.2% |
| Population change (2000 to 2020) | +1.6% |
| Median Age | 49.3 years (Male: 48.7, Female: 50.1) |
| Neighborhoods | Eras Bajas, Centro |
| Local Time | |
| Timezone | Central European Summer Time |
| Lat & Lng | 41.40766, -0.46158 |
| Postal Codes | 50786 |
Map of Gelsa
Interactive Map
Gelsa Population
Years 1975 to 2020
| Data | 1975 | 1990 | 2000 | 2015 | 2020 |
|---|---|---|---|---|---|
| Population | 619 | 790 | 799 | 807 | 812 |
| Population Density | 450.2 / km² | 574.5 / km² | 581.1 / km² | 586.9 / km² | 590.5 / km² |
Gelsa Population change from 2000 to 2015
Increase of 1% from year 2000 to 2015
| Location | Change since 1975 | Change since 1990 | Change since 2000 |
|---|---|---|---|
| Gelsa | +30.4% | +2.2% | +1% |
| Spain | +28.4% | +17.7% | +13.2% |
Gelsa Median Age
Median Age: 49.3 years
| Location | Median Age | Median Age (Female) | Median Age (Male) |
|---|---|---|---|
| Gelsa | 49.3 yrs | 50.1 yrs | 48.7 yrs |
| Spain | 40.8 yrs | 42 yrs | 39.7 yrs |
Gelsa Population Density
Population Density: 591 / km²
| Location | Population | Area | Density |
|---|---|---|---|
| Gelsa | 812 | 1.375 km² | 591 / km² |
| Spain | 45.3 million | 505,993.5 km² | 89.5 / km² |
Gelsa Historical and Projected Population
Estimated Population from 0 to 2100
- JRC (European Commission's Joint Research Centre) work on the GHS built-up grid
- CIESIN (Center for International Earth Science Information Network)
- [Link] Klein Goldewijk, K., Beusen, A., Doelman, J., and Stehfest, E.: Anthropogenic land use estimates for the Holocene – HYDE 3.2, Earth Syst. Sci. Data, 9, 927–953, https://doi.org/10.5194/essd-9-927-2017, 2017.
Area Codes
Percentage Area Codes used by businesses in Gelsa
Price Distribution
Business distribution by price for Gelsa
Human Development Index (HDI)
Statistic composite index of life expectancy, education, and per capita income.
Gelsa CO2 Emissions
Carbon Dioxide (CO2) Emissions Per Capita in Tonnes Per Year
| Location | CO2 Emissions | CO2 Emissions Per Capita | CO2 Emissions Intensity |
|---|---|---|---|
| Gelsa | 6,055 tn | 7.46 tn | 4,403.7 tons/km² |
| Spain | 330,097,501 tn | 7.29 tn | 652.4 tons/km² |
| 2013 CO2 emissions (tonnes/year) | 6,055 tn |
| 2013 CO2 emissions (tonnes/year) per capita | 7.46 tn |
| 2013 CO2 emissions intensity (tonnes/km²/year) | 4,403.7 tons/km² |
Recent Nearby Earthquakes
Magnitude 3.0 and greater
| Date▼ | Time↕ | Magnitude↕ | Distance↕ | Depth↕ | Location↕ | Link |
|---|---|---|---|---|---|---|
| 4/8/11 | 3:07 PM | 3.8 | 58.2 km | 11,000 m | Spain | usgs.gov |
| 12/29/08 | 12:24 PM | 3 | 82.6 km | 2,000 m | Spain | usgs.gov |
| 10/21/05 | 3:34 PM | 3.6 | 96 km | 10,000 m | Spain | usgs.gov |
| 7/7/03 | 6:36 PM | 3.2 | 85.5 km | 6,100 m | Spain | usgs.gov |
| 2/6/02 | 12:57 PM | 3.2 | 87.3 km | 6,800 m | Spain | usgs.gov |
| 6/6/00 | 11:45 AM | 3 | 73.4 km | 0 m | Pyrenees | usgs.gov |
| 1/8/00 | 9:04 PM | 3 | 99.7 km | 2,000 m | Pyrenees | usgs.gov |
| 5/27/99 | 9:59 AM | 3 | 99.8 km | 2,800 m | Pyrenees | usgs.gov |
| 10/6/98 | 11:02 AM | 3.4 | 87.2 km | 10,000 m | Spain | usgs.gov |
| 9/10/98 | 3:41 PM | 3 | 69.7 km | 7,800 m | Spain | usgs.gov |
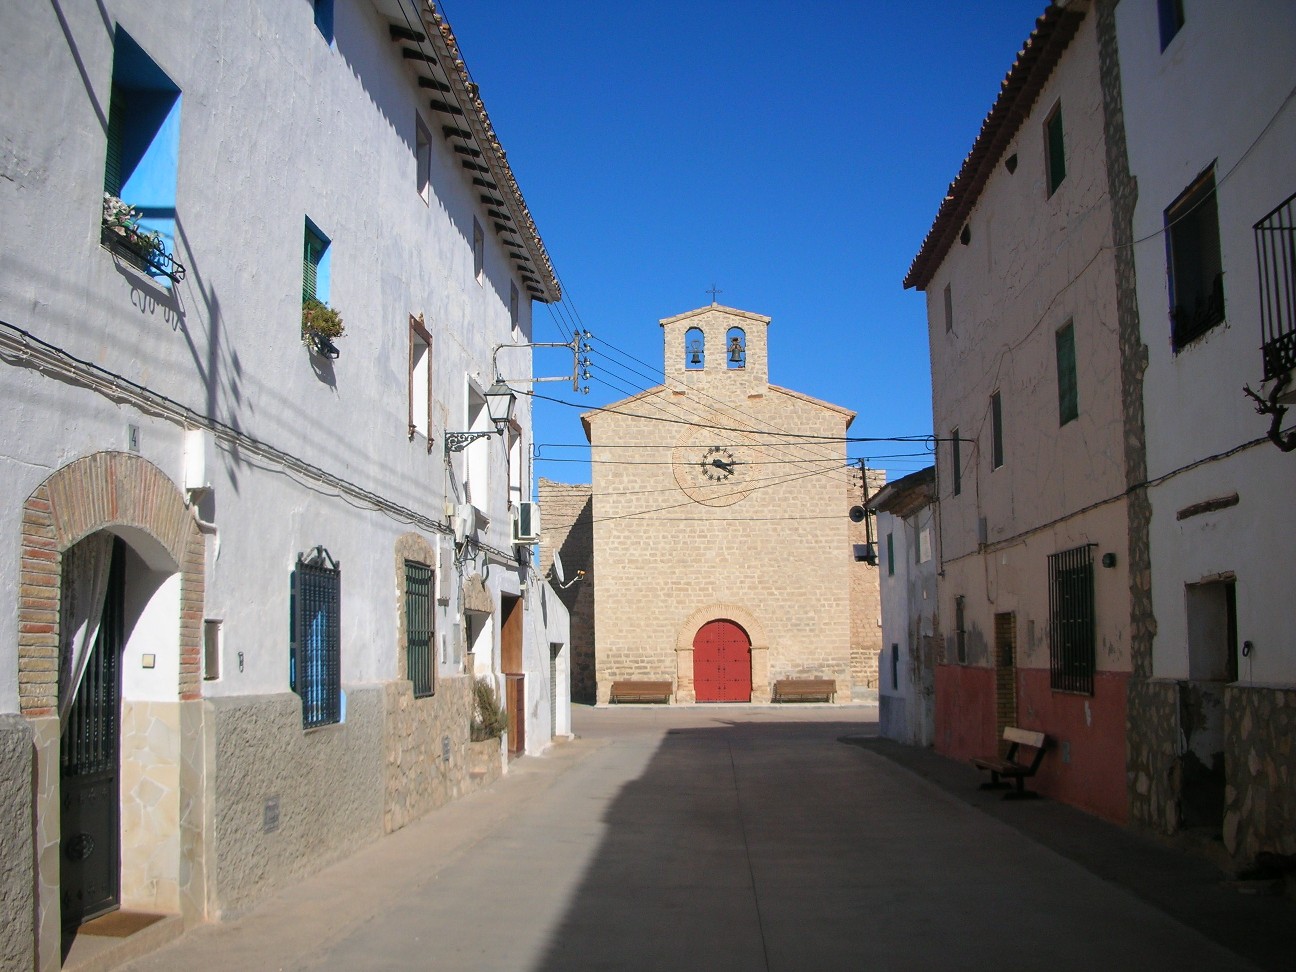
Gelsa
Gelsa is a municipality located in the province of Zaragoza, comarca (county) of Ribera Baja del Ebro, Aragon, Spain. According to the 2004 census (INE), the municipality has a population of 1,216 inhabitants.
Gelsa Wikipedia Page
About Our Data
The data on this page is estimated using a number of publicly available tools and resources. It is provided without warranty, and could contain inaccuracies. Use at your own risk.