Categories in Inca, Spain
Industries
Business Distribution by Industry in Inca, Spain
| Industry Description | Number of Establishments |
|---|---|
| Restaurants | 211 |
| Shopping | 202 |
| Clothing stores | 138 |
| Corporate management | 127 |
| Real estate | 106 |
| Bars, pubs and taverns | 91 |
| Grocery stores and supermarkets | 90 |
| Construction of buildings | 90 |
| Beauty salons | 84 |
| Shoe stores | 84 |
| Car repair | 74 |
| Hairdressers | 73 |
| Lawyers legal | 70 |
| Bakeries | 66 |
| Shopping other | 62 |
| Education | 59 |
| Wholesale of machinery | 55 |
Inca, Spain Facts
| Area | 2.8 km² |
| Population | 24,271 |
| Male Population | 12,321 (50.8%) |
| Female Population | 11,950 (49.2%) |
| Population change (1975 to 2020) | +105.3% |
| Population change (2000 to 2020) | +35.2% |
| Median Age | 36.7 years (Male: 35.9, Female: 37.7) |
| Neighborhoods | Mercat, Playa de Palma, Distrito Centro, Pere Garau, Son Armadams |
| Local Time | |
| Timezone | Central European Summer Time |
| Lat & Lng | 39.72110, 2.91093 |
| Postal Codes | 07300 |
Map of Inca, Spain
Interactive Map
Inca, Spain Population
Years 1975 to 2020
| Data | 1975 | 1990 | 2000 | 2015 | 2020 |
|---|---|---|---|---|---|
| Population | 11,825 | 15,892 | 17,955 | 23,448 | 24,271 |
| Population Density | 4,204.4 / km² | 5,650.5 / km² | 6,384 / km² | 8,337.1 / km² | 8,629.7 / km² |
Inca, Spain Population change from 2000 to 2015
Increase of 30.6% from year 2000 to 2015
| Location | Change since 1975 | Change since 1990 | Change since 2000 |
|---|---|---|---|
| Inca, Spain | +98.3% | +47.5% | +30.6% |
| Spain | +28.4% | +17.7% | +13.2% |
Inca, Spain Median Age
Median Age: 36.7 years
| Location | Median Age | Median Age (Female) | Median Age (Male) |
|---|---|---|---|
| Inca, Spain | 36.7 yrs | 37.7 yrs | 35.9 yrs |
| Spain | 40.8 yrs | 42 yrs | 39.7 yrs |
Inca, Spain Population Density
Population Density: 8,630 / km²
| Location | Population | Area | Density |
|---|---|---|---|
| Inca, Spain | 24,271 | 2.813 km² | 8,630 / km² |
| Spain | 45.3 million | 505,993.5 km² | 89.5 / km² |
Inca, Spain Historical and Projected Population
Estimated Population from 0 to 2100
- JRC (European Commission's Joint Research Centre) work on the GHS built-up grid
- CIESIN (Center for International Earth Science Information Network)
- [Link] Klein Goldewijk, K., Beusen, A., Doelman, J., and Stehfest, E.: Anthropogenic land use estimates for the Holocene – HYDE 3.2, Earth Syst. Sci. Data, 9, 927–953, https://doi.org/10.5194/essd-9-927-2017, 2017.
Neighborhoods in Inca, Spain
Percentage of businesses by neighborhood in Inca, Spain
Area Codes
Percentage Area Codes used by businesses in Inca, Spain
Postal Codes
Percentage of businesses by Postal Codes in Inca, Spain
Price Distribution
Business distribution by price for Inca, Spain
Human Development Index (HDI)
Statistic composite index of life expectancy, education, and per capita income.
Inca, Spain CO2 Emissions
Carbon Dioxide (CO2) Emissions Per Capita in Tonnes Per Year
| Location | CO2 Emissions | CO2 Emissions Per Capita | CO2 Emissions Intensity |
|---|---|---|---|
| Inca, Spain | 179,952 tn | 7.41 tn | 63,983.1 tons/km² |
| Spain | 330,097,501 tn | 7.29 tn | 652.4 tons/km² |
| 2013 CO2 emissions (tonnes/year) | 179,952 tn |
| 2013 CO2 emissions (tonnes/year) per capita | 7.41 tn |
| 2013 CO2 emissions intensity (tonnes/km²/year) | 63,983.1 tons/km² |
Natural Hazards Risk
Relative risk out of 10
| Hazard | Risk Level |
|---|---|
| Flood | Medium (4) |
* Risk, particularly concerning flood or landslide, may not be for the entire area.
- Dilley, M., R.S. Chen, U. Deichmann, A.L. Lerner-Lam, M. Arnold, J. Agwe, P. Buys, O. Kjekstad, B. Lyon, and G. Yetman. 2005. Natural Disaster Hotspots: A Global Risk Analysis. Washington, D.C.: World Bank. https://doi.org/10.1596/0-8213-5930-4.
- Center for Hazards and Risk Research - CHRR - Columbia University, Center for International Earth Science Information Network - CIESIN - Columbia University. 2005. Global Flood Hazard Frequency and Distribution. Palisades, NY: NASA Socioeconomic Data and Applications Center (SEDAC). https://doi.org/10.7927/H4668B3D.
Recent Nearby Earthquakes
Magnitude 3.0 and greater
| Date▼ | Time↕ | Magnitude↕ | Distance↕ | Depth↕ | Location↕ | Link |
|---|---|---|---|---|---|---|
| 1/21/05 | 1:54 AM | 3.1 | 19.1 km | 27,800 m | Balearic Islands, Spain | usgs.gov |
| 11/2/01 | 11:02 PM | 3.8 | 73.9 km | 17,100 m | Balearic Islands, Spain | usgs.gov |
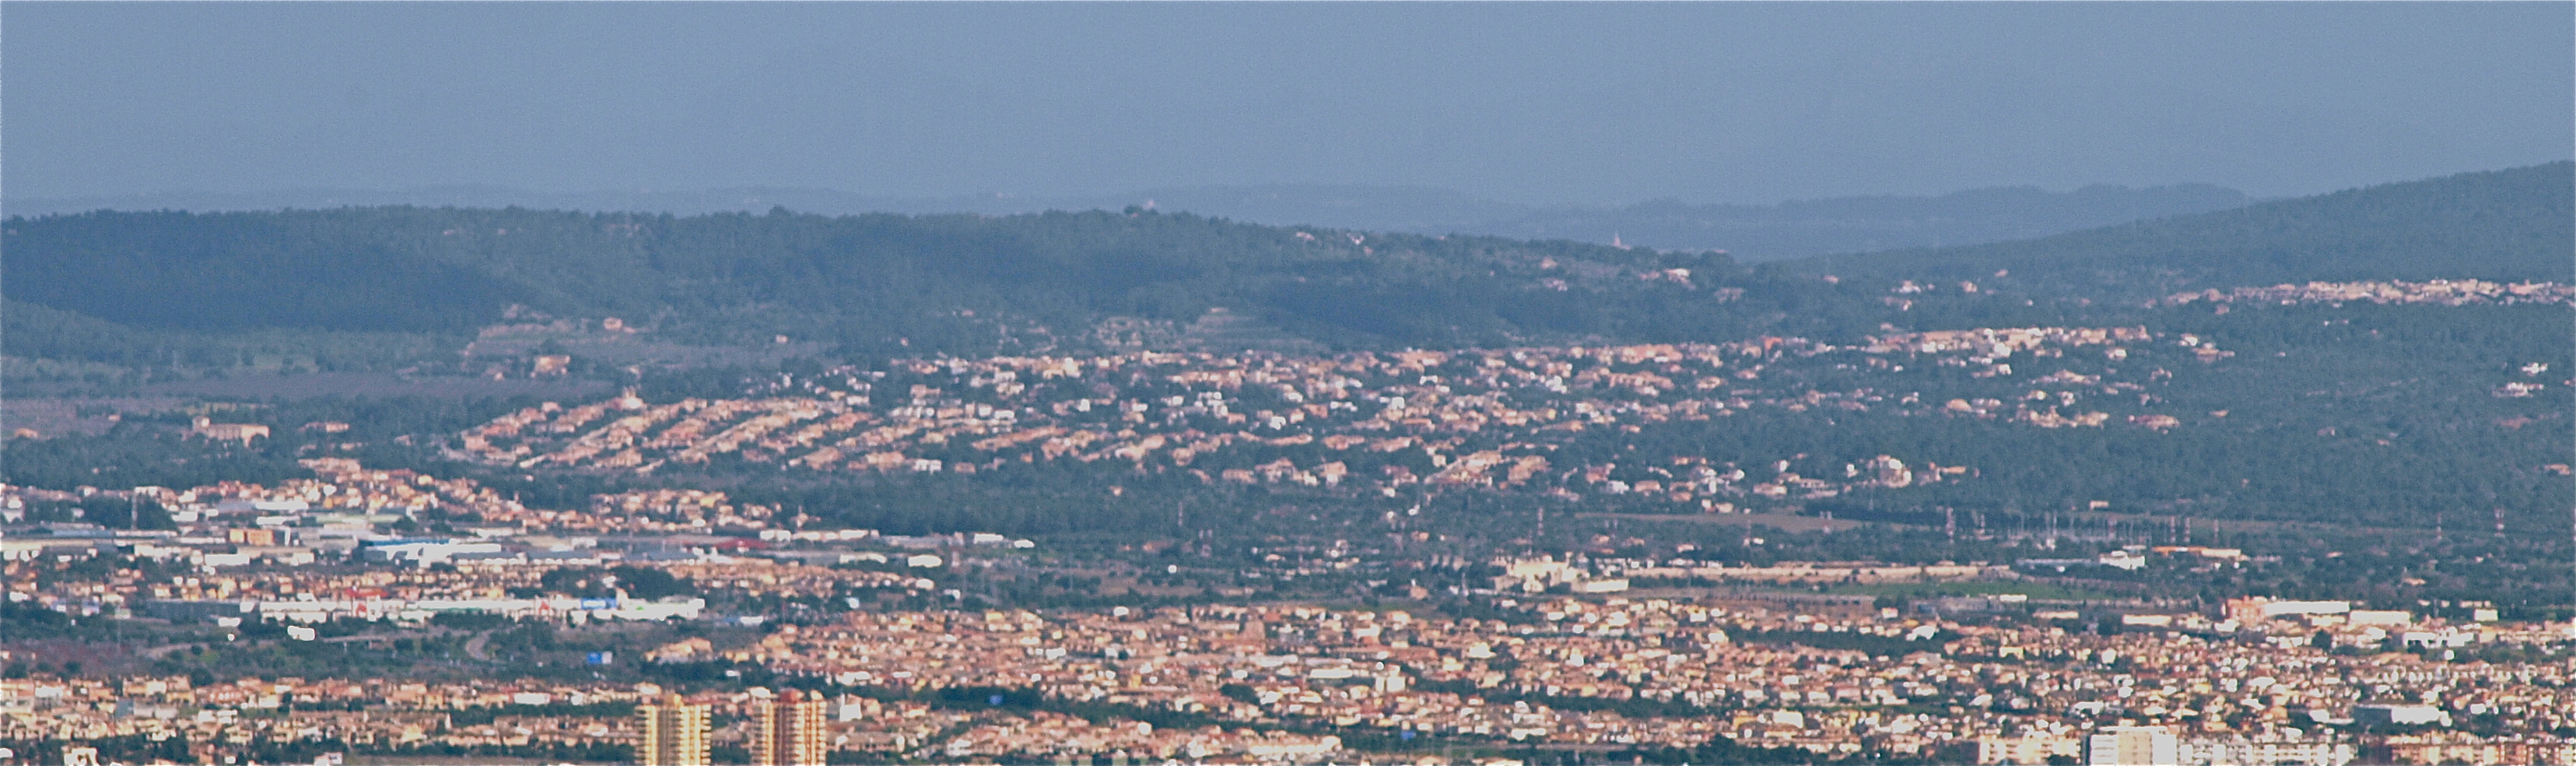
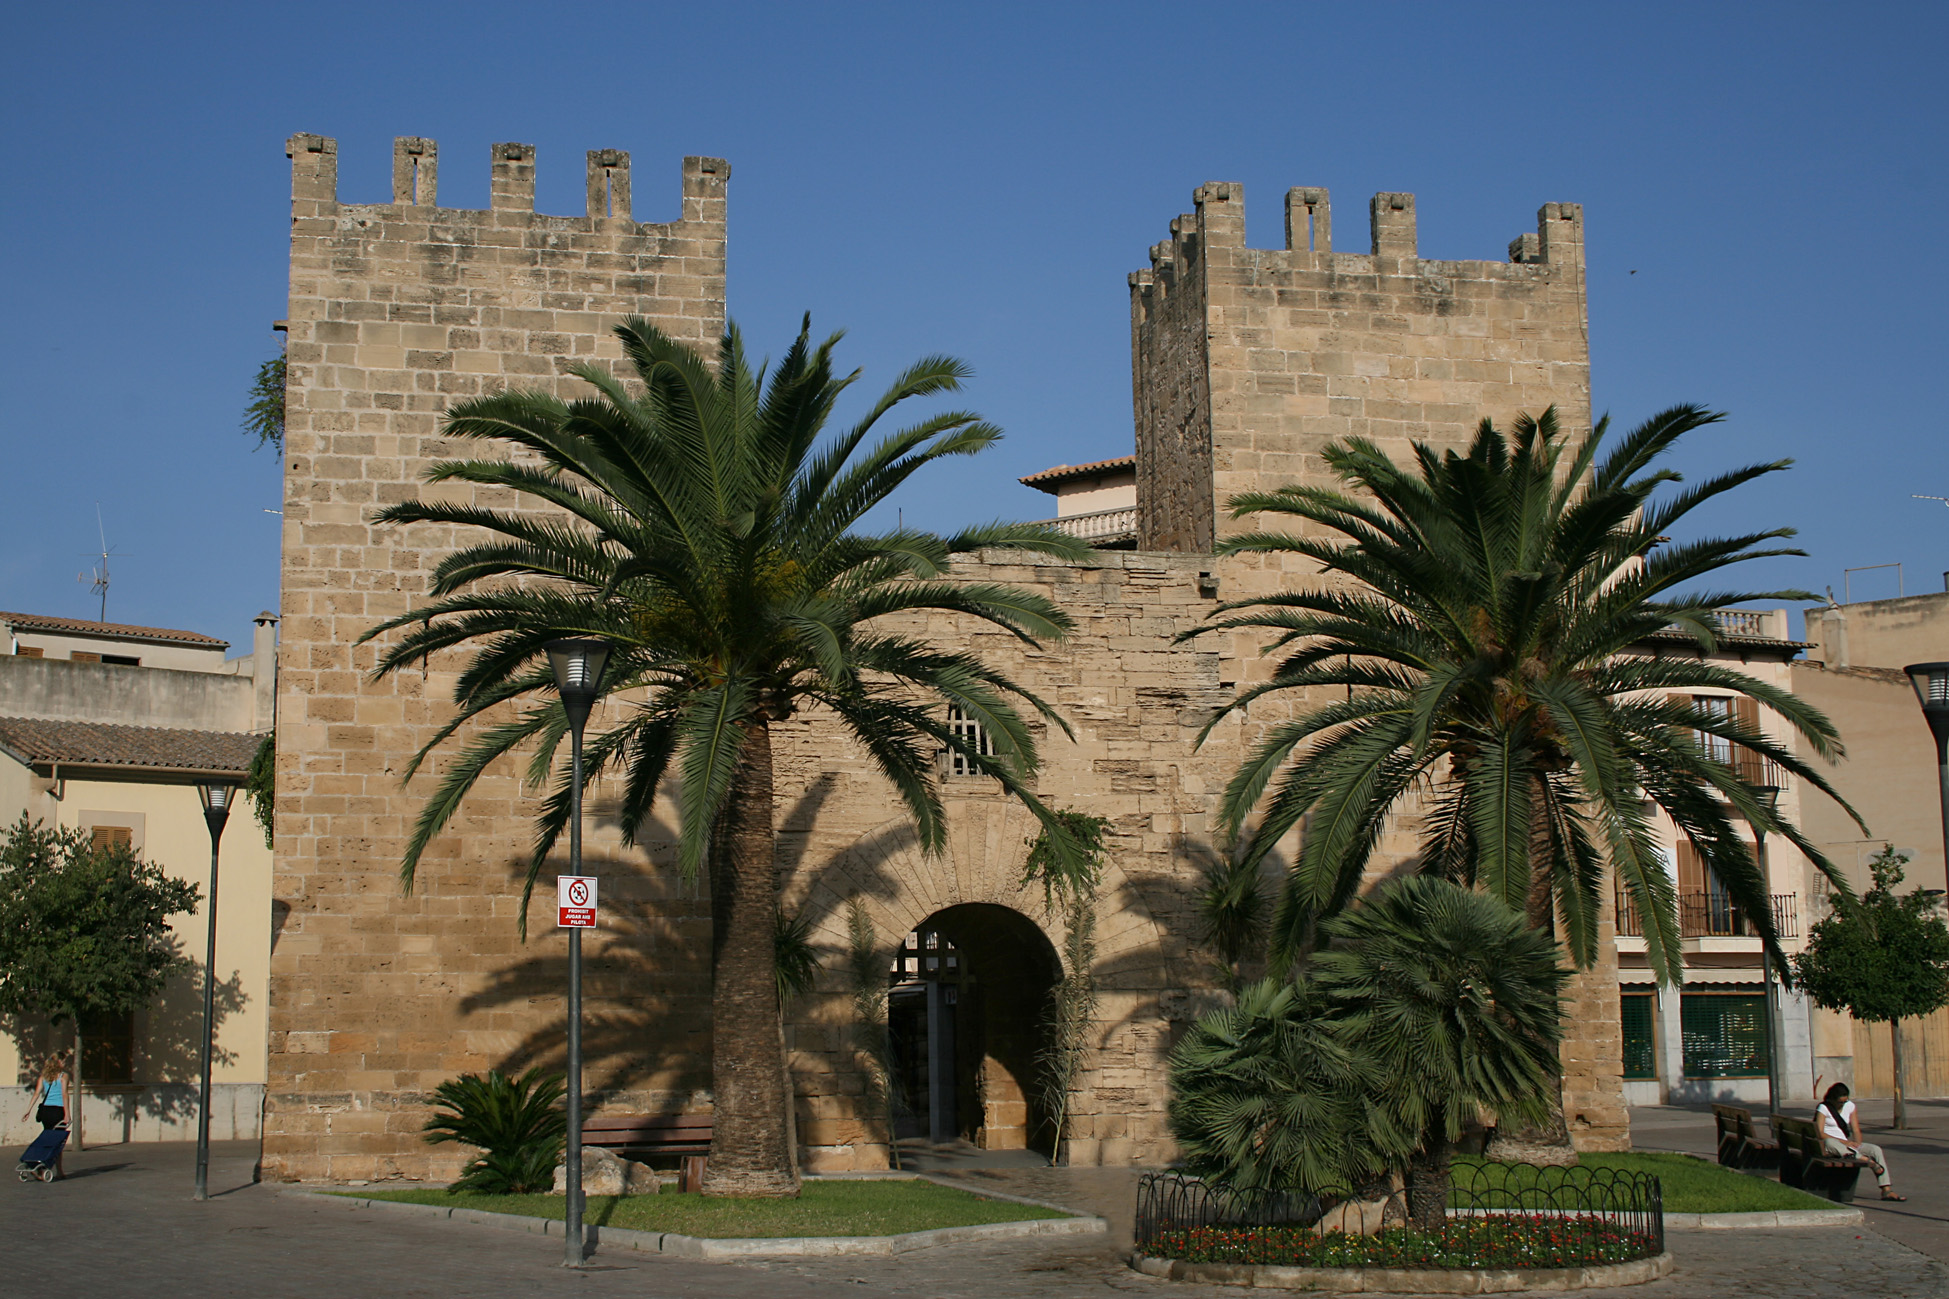
Inca, Spain
Inca (Catalan pronunciation: [ˈiŋkə]) is a town on the Spanish island of Majorca. The population of the municipality is 25,900 (2004) in an area of 58.4 km². is a junction station Majorca rail network with trains to Palma, the island's capital, to S..
Inca, Spain Wikipedia Page

About Our Data
The data on this page is estimated using a number of publicly available tools and resources. It is provided without warranty, and could contain inaccuracies. Use at your own risk.