Jatiel Facts
| Area | 11.9 km² |
| Population | 46 |
| Population change (1975 to 2020) | +0.0% |
| Population change (2000 to 2020) | +2.2% |
| Local Time | |
| Timezone | Central European Summer Time |
| Lat & Lng | 41.22008, -0.38183 |
Map of Jatiel
Interactive Map
Jatiel Population
Years 1975 to 2020
| Data | 1975 | 1990 | 2000 | 2015 | 2020 |
|---|---|---|---|---|---|
| Population | 46 | 47 | 45 | 46 | 46 |
| Population Density | 3.9 / km² | 3.9 / km² | 3.8 / km² | 3.9 / km² | 3.9 / km² |
Sources: JRC (European Commission's Joint Research Centre) work on the GHS built-up grid
Jatiel Population change from 2000 to 2015
Increase of 2.2% from year 2000 to 2015
| Location | Change since 1975 | Change since 1990 | Change since 2000 |
|---|---|---|---|
| Jatiel | +0% | -2.1% | +2.2% |
| Spain | +28.4% | +17.7% | +13.2% |
Sources: JRC (European Commission's Joint Research Centre) work on the GHS built-up grid
Jatiel Population Density
Population Density: 3.9 / km²
| Location | Population | Area | Density |
|---|---|---|---|
| Jatiel | 46 | 11.9 km² | 3.9 / km² |
| Spain | 45.3 million | 505,993.5 km² | 89.5 / km² |
Sources: JRC (European Commission's Joint Research Centre) work on the GHS built-up grid
Jatiel Historical and Projected Population
Estimated Population from 0 to 2100
Sources:
- JRC (European Commission's Joint Research Centre) work on the GHS built-up grid
- CIESIN (Center for International Earth Science Information Network)
- [Link] Klein Goldewijk, K., Beusen, A., Doelman, J., and Stehfest, E.: Anthropogenic land use estimates for the Holocene – HYDE 3.2, Earth Syst. Sci. Data, 9, 927–953, https://doi.org/10.5194/essd-9-927-2017, 2017.
Human Development Index (HDI)
Statistic composite index of life expectancy, education, and per capita income.
Source: [Link] Kummu, M., Taka, M. &Guillaume, J. Gridded global datasets for Gross Domestic Product and Human Development Index over 1990–2015. Sci Data 5, 180004 (2018) doi:10.1038/sdata.2018.4
Jatiel CO2 Emissions
Carbon Dioxide (CO2) Emissions Per Capita in Tonnes Per Year
| Location | CO2 Emissions | CO2 Emissions Per Capita | CO2 Emissions Intensity |
|---|---|---|---|
| Jatiel | 337 tn | 7.32 tn | 28.2 tons/km² |
| Spain | 330,097,501 tn | 7.29 tn | 652.4 tons/km² |
Sources: [Link] Moran, D., Kanemoto K; Jiborn, M., Wood, R., Többen, J., and Seto, K.C. (2018) Carbon footprints of 13,000 cities. Environmental Research Letters DOI: 10.1088/1748-9326/aac72a
Jatiel CO2 Emissions
| 2013 CO2 emissions (tonnes/year) | 337 tn |
| 2013 CO2 emissions (tonnes/year) per capita | 7.32 tn |
| 2013 CO2 emissions intensity (tonnes/km²/year) | 28.2 tons/km² |
Recent Nearby Earthquakes
Magnitude 3.0 and greater
| Date▼ | Time↕ | Magnitude↕ | Distance↕ | Depth↕ | Location↕ | Link |
|---|---|---|---|---|---|---|
| 4/8/11 | 3:07 PM | 3.8 | 59.2 km | 11,000 m | Spain | usgs.gov |
| 12/29/08 | 12:24 PM | 3 | 95.1 km | 2,000 m | Spain | usgs.gov |
| 10/21/05 | 3:34 PM | 3.6 | 74.2 km | 10,000 m | Spain | usgs.gov |
| 7/7/03 | 6:36 PM | 3.2 | 65.6 km | 6,100 m | Spain | usgs.gov |
| 2/6/02 | 12:57 PM | 3.2 | 67.2 km | 6,800 m | Spain | usgs.gov |
| 10/25/00 | 4:19 AM | 3.3 | 79.5 km | 10,300 m | Spain | usgs.gov |
| 6/6/00 | 11:45 AM | 3 | 93 km | 0 m | Pyrenees | usgs.gov |
| 10/6/98 | 11:02 AM | 3.4 | 96.4 km | 10,000 m | Spain | usgs.gov |
| 9/10/98 | 3:41 PM | 3 | 49.7 km | 7,800 m | Spain | usgs.gov |
| 9/24/89 | 8:16 PM | 3.2 | 66.5 km | 10,000 m | Spain | usgs.gov |
Source: U.S. Geological Survey (USGS)
Jatiel
Jatiel is a municipality located in the Bajo Martín comarca, province of Teruel, Aragon, Spain. According to the 2010 census the municipality has a population of 52 inhabitants. Its postal code is 44592. is an agricultural town, reputed for the qual..
Jatiel Wikipedia Page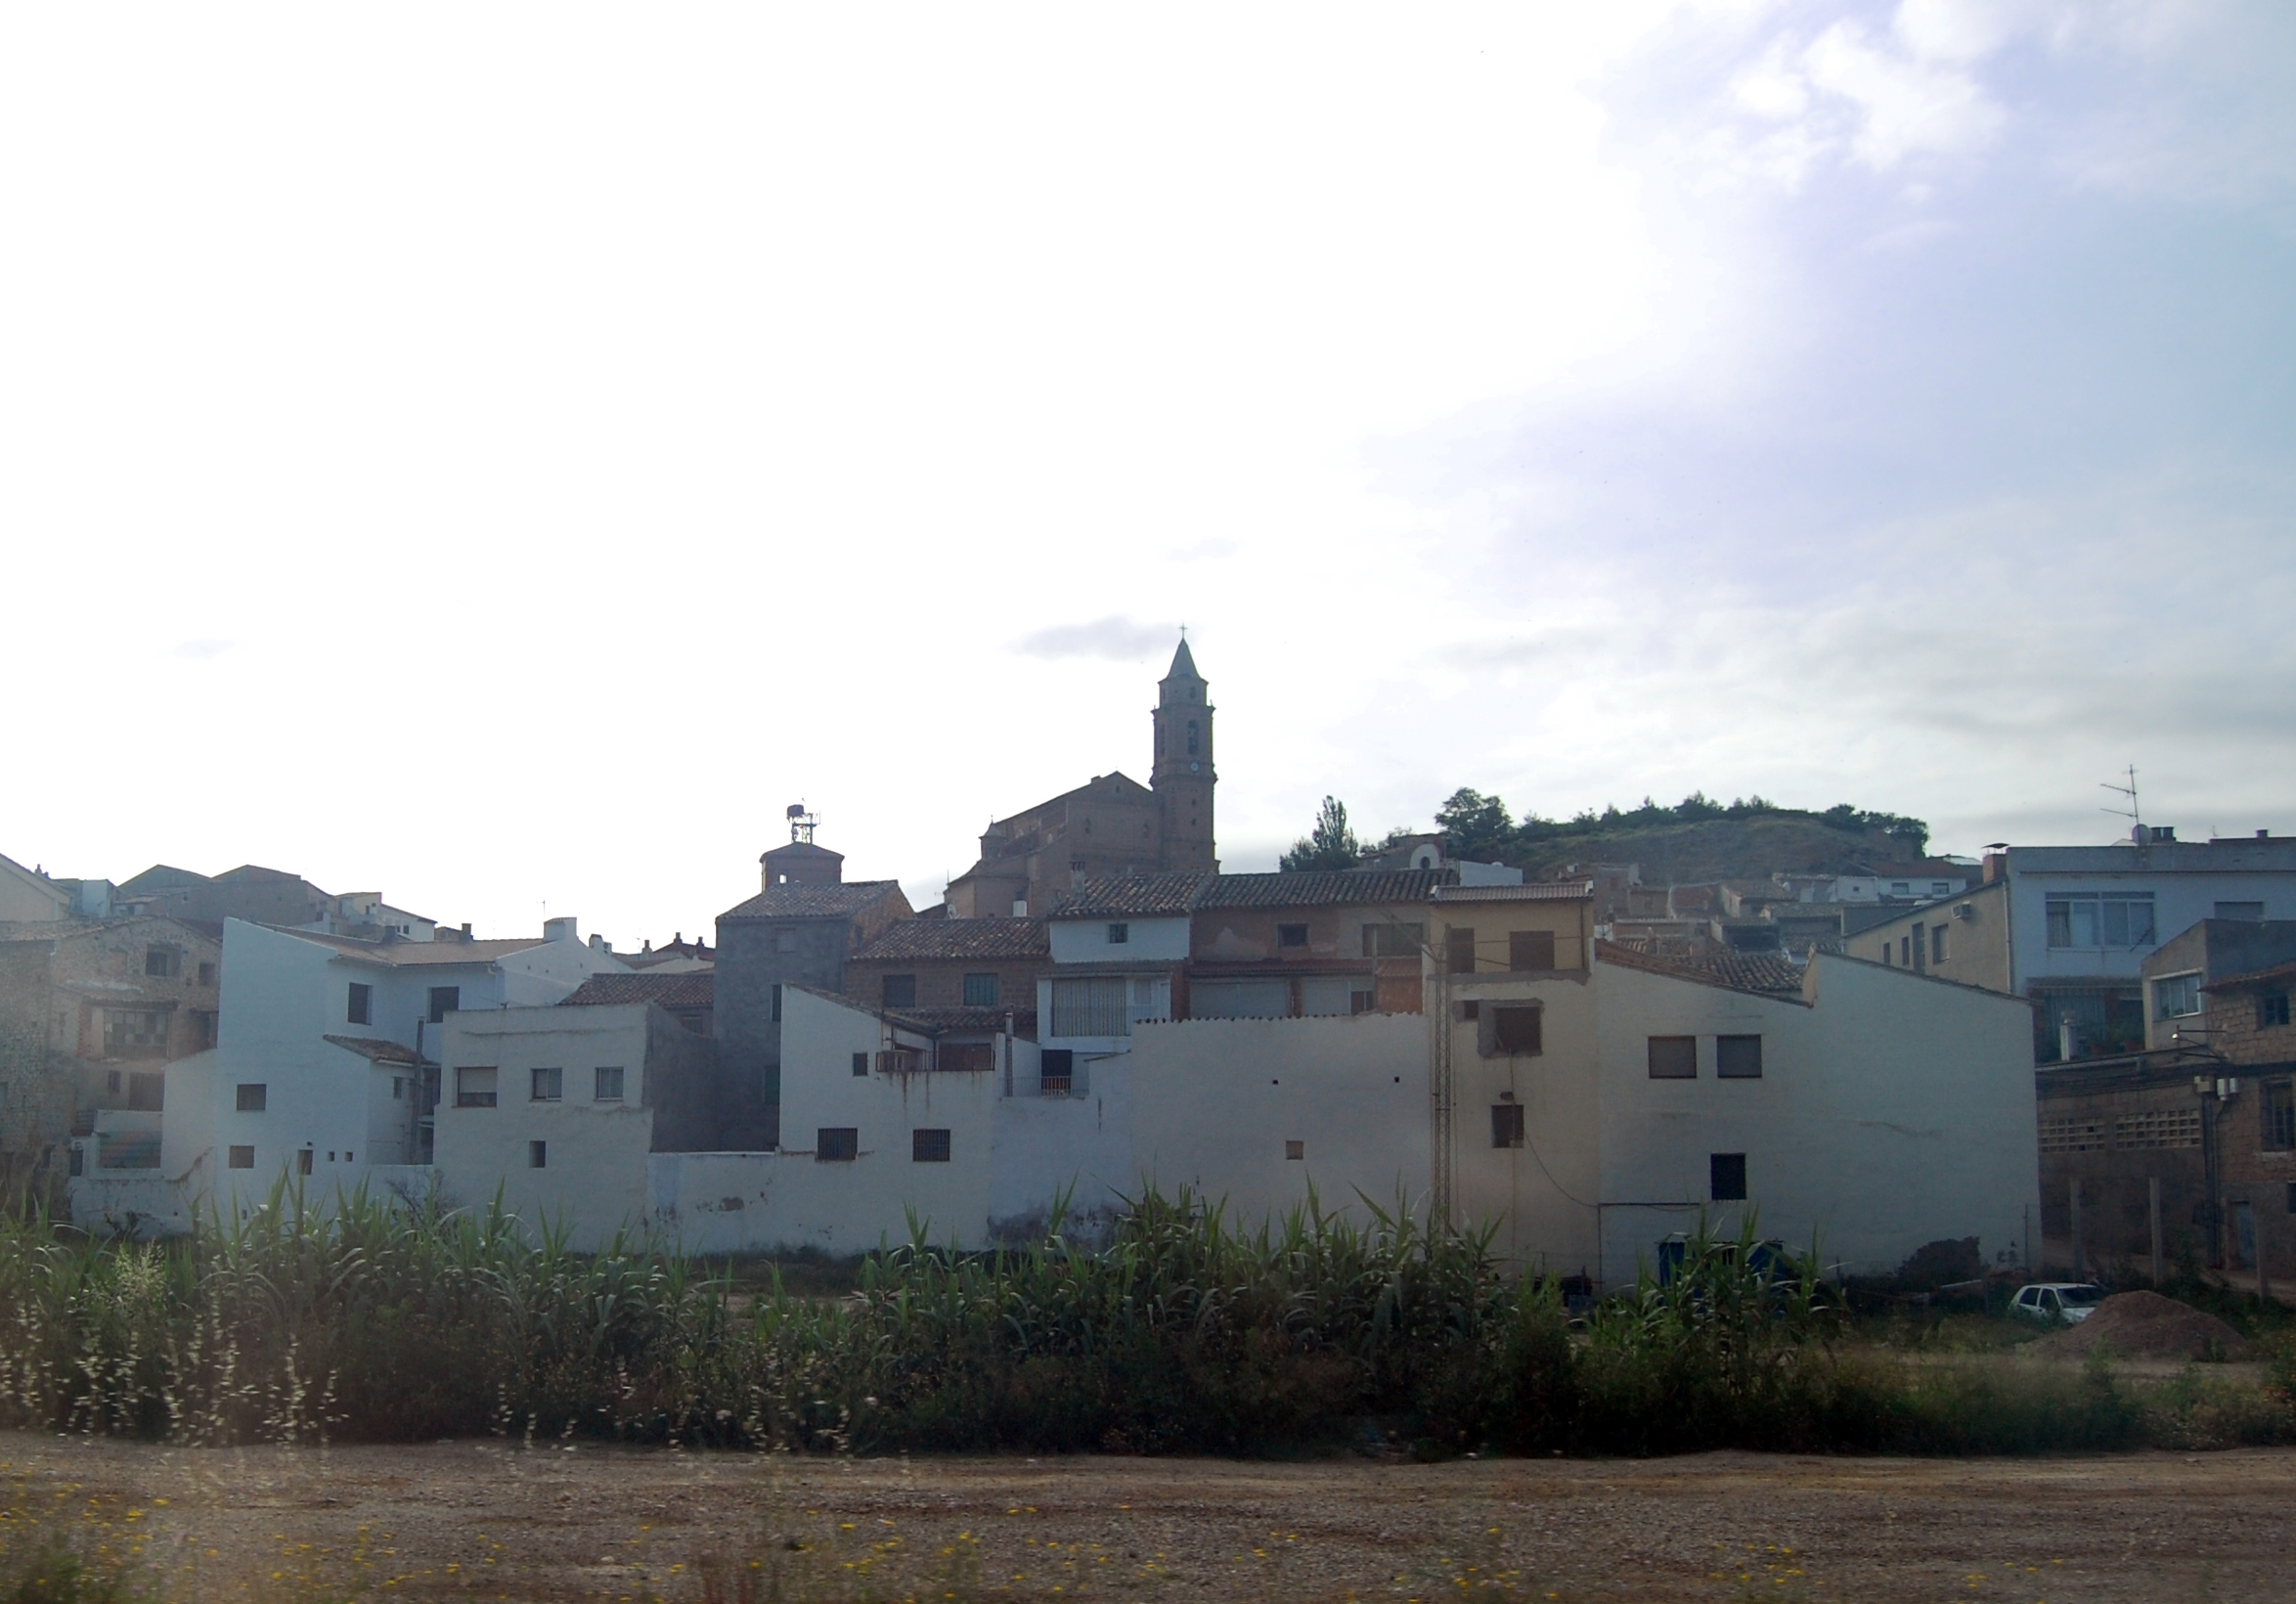

About Our Data
The data on this page is estimated using a number of publicly available tools and resources. It is provided without warranty, and could contain inaccuracies. Use at your own risk.