Jaulín Facts
| Area | 49.3 km² |
| Population | 284 |
| Male Population | 152 (53.5%) |
| Female Population | 132 (46.5%) |
| Population change (1975 to 2020) | +28.5% |
| Population change (2000 to 2020) | +13.6% |
| Median Age | 49.8 years (Male: 48.3, Female: 52.9) |
| Local Time | |
| Timezone | Central European Summer Time |
| Lat & Lng | 41.45198, -0.99256 |
| Postal Codes | 50141 |
Map of Jaulín
Interactive Map
Jaulín Population
Years 1975 to 2020
| Data | 1975 | 1990 | 2000 | 2015 | 2020 |
|---|---|---|---|---|---|
| Population | 221 | 244 | 250 | 282 | 284 |
| Population Density | 4.5 / km² | 5 / km² | 5.1 / km² | 5.7 / km² | 5.8 / km² |
Sources: JRC (European Commission's Joint Research Centre) work on the GHS built-up grid
Jaulín Population change from 2000 to 2015
Increase of 12.8% from year 2000 to 2015
| Location | Change since 1975 | Change since 1990 | Change since 2000 |
|---|---|---|---|
| Jaulín | +27.6% | +15.6% | +12.8% |
| Spain | +28.4% | +17.7% | +13.2% |
Sources: JRC (European Commission's Joint Research Centre) work on the GHS built-up grid
Jaulín Median Age
Median Age: 49.8 years
| Location | Median Age | Median Age (Female) | Median Age (Male) |
|---|---|---|---|
| Jaulín | 49.8 yrs | 52.9 yrs | 48.3 yrs |
| Spain | 40.8 yrs | 42 yrs | 39.7 yrs |
Sources: CIESIN (Center for International Earth Science Information Network)
Jaulín Population Density
Population Density: 5.8 / km²
| Location | Population | Area | Density |
|---|---|---|---|
| Jaulín | 284 | 49.3 km² | 5.8 / km² |
| Spain | 45.3 million | 505,993.5 km² | 89.5 / km² |
Sources: JRC (European Commission's Joint Research Centre) work on the GHS built-up grid
Jaulín Historical and Projected Population
Estimated Population from 0 to 2100
Sources:
- JRC (European Commission's Joint Research Centre) work on the GHS built-up grid
- CIESIN (Center for International Earth Science Information Network)
- [Link] Klein Goldewijk, K., Beusen, A., Doelman, J., and Stehfest, E.: Anthropogenic land use estimates for the Holocene – HYDE 3.2, Earth Syst. Sci. Data, 9, 927–953, https://doi.org/10.5194/essd-9-927-2017, 2017.
Human Development Index (HDI)
Statistic composite index of life expectancy, education, and per capita income.
Source: [Link] Kummu, M., Taka, M. &Guillaume, J. Gridded global datasets for Gross Domestic Product and Human Development Index over 1990–2015. Sci Data 5, 180004 (2018) doi:10.1038/sdata.2018.4
Jaulín CO2 Emissions
Carbon Dioxide (CO2) Emissions Per Capita in Tonnes Per Year
| Location | CO2 Emissions | CO2 Emissions Per Capita | CO2 Emissions Intensity |
|---|---|---|---|
| Jaulín | 2,118 tn | 7.46 tn | 43 tons/km² |
| Spain | 330,097,501 tn | 7.29 tn | 652.4 tons/km² |
Sources: [Link] Moran, D., Kanemoto K; Jiborn, M., Wood, R., Többen, J., and Seto, K.C. (2018) Carbon footprints of 13,000 cities. Environmental Research Letters DOI: 10.1088/1748-9326/aac72a
Jaulín CO2 Emissions
| 2013 CO2 emissions (tonnes/year) | 2,118 tn |
| 2013 CO2 emissions (tonnes/year) per capita | 7.46 tn |
| 2013 CO2 emissions intensity (tonnes/km²/year) | 43 tons/km² |
Recent Nearby Earthquakes
Magnitude 3.0 and greater
| Date▼ | Time↕ | Magnitude↕ | Distance↕ | Depth↕ | Location↕ | Link |
|---|---|---|---|---|---|---|
| 4/8/11 | 3:07 PM | 3.8 | 31.6 km | 11,000 m | Spain | usgs.gov |
| 3/29/07 | 5:18 PM | 3.2 | 88.5 km | 10,600 m | Spain | usgs.gov |
| 9/1/05 | 12:15 PM | 3 | 90.2 km | 10,000 m | Pyrenees | usgs.gov |
| 11/25/04 | 2:16 PM | 3 | 94.3 km | 5,000 m | Spain | usgs.gov |
| 4/13/04 | 12:05 PM | 3 | 88 km | 5,000 m | Pyrenees | usgs.gov |
| 3/6/04 | 2:28 PM | 3.1 | 87.6 km | 0 m | Spain | usgs.gov |
| 3/4/04 | 10:54 PM | 3.1 | 91.5 km | 6,500 m | Spain | usgs.gov |
| 3/3/04 | 10:23 PM | 3.4 | 94.1 km | 10,000 m | Pyrenees | usgs.gov |
| 2/12/04 | 12:40 PM | 3.2 | 89.4 km | 5,000 m | Pyrenees | usgs.gov |
| 2/4/04 | 12:46 AM | 3.6 | 89.1 km | 4,200 m | Spain | usgs.gov |
Source: U.S. Geological Survey (USGS)
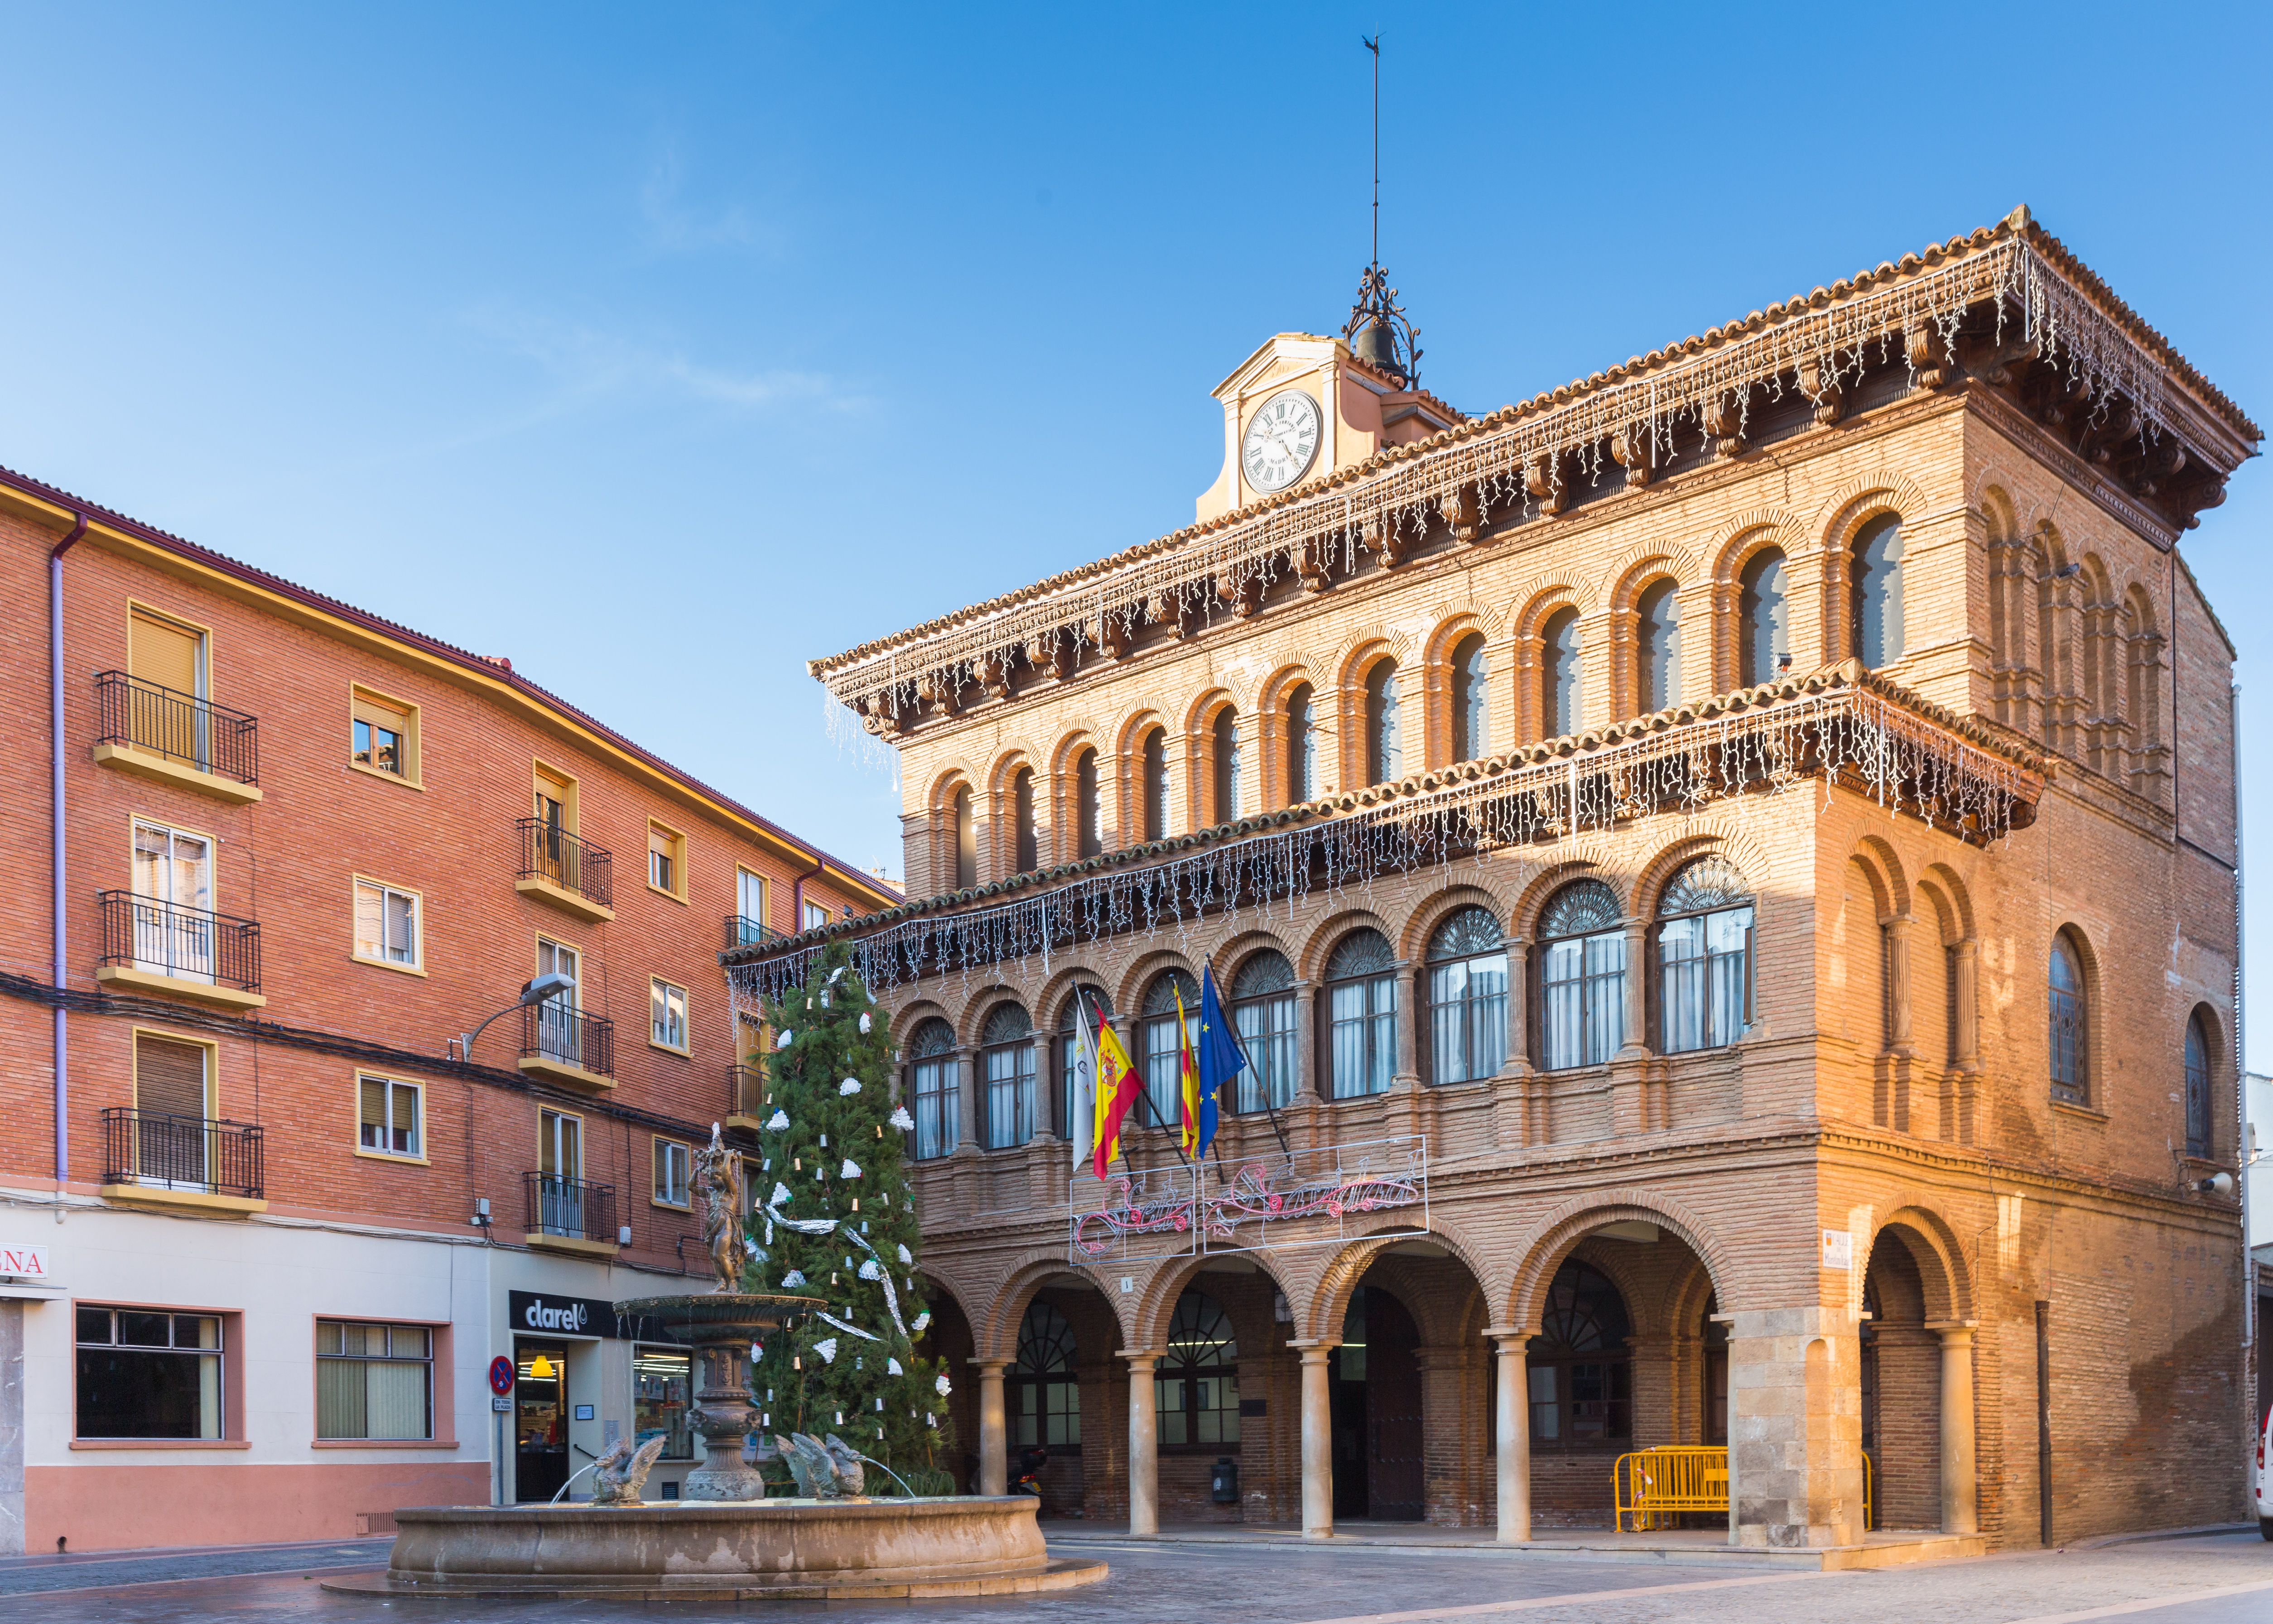
Jaulín
Jaulín is a municipality located in the province of Zaragoza, Aragon, Spain. According to the 2004 census (INE), the municipality has a population of 307 inhabitants.
Jaulín Wikipedia Page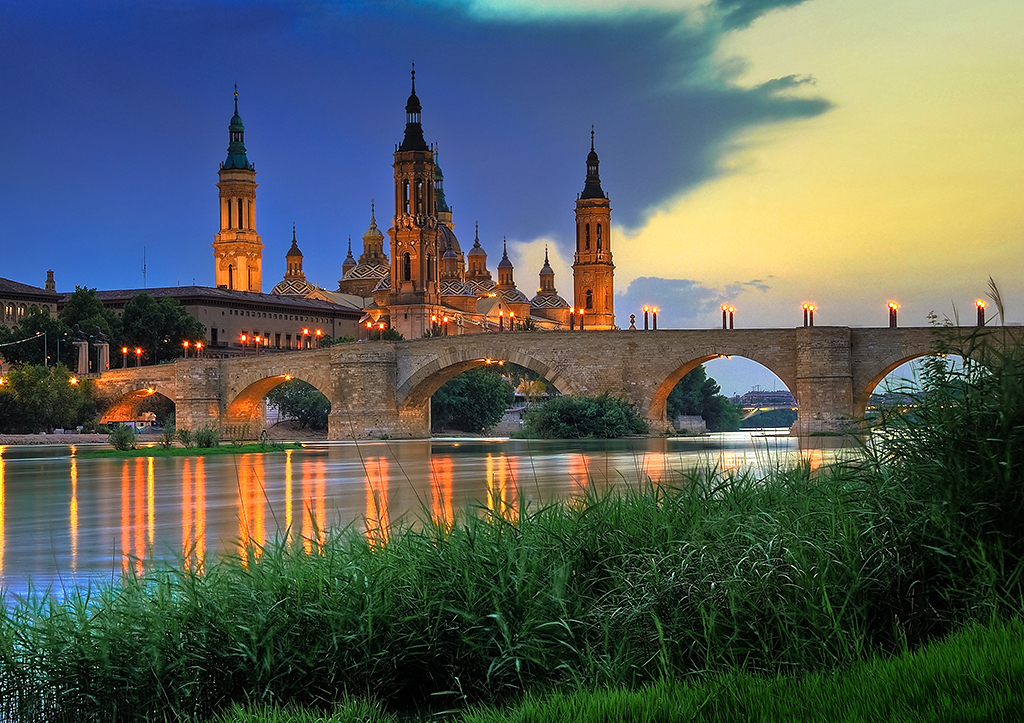
About Our Data
The data on this page is estimated using a number of publicly available tools and resources. It is provided without warranty, and could contain inaccuracies. Use at your own risk.