Categories in Lanaja
Industries
Business Distribution by Industry in Lanaja
| Industry Description | Number of Establishments |
|---|---|
| Restaurants | 8 |
Lanaja Facts
| Area | 0.6 km² |
| Population | 575 |
| Male Population | 306 (53.1%) |
| Female Population | 269 (46.9%) |
| Population change (1975 to 2020) | -46.1% |
| Population change (2000 to 2020) | -17.4% |
| Median Age | 52.2 years (Male: 50.5, Female: 55) |
| Local Time | |
| Timezone | Central European Summer Time |
| Lat & Lng | 41.77063, -0.33095 |
| Postal Codes | 22213, 22250 |
Map of Lanaja
Interactive Map
Lanaja Population
Years 1975 to 2020
| Data | 1975 | 1990 | 2000 | 2015 | 2020 |
|---|---|---|---|---|---|
| Population | 1,067 | 887 | 696 | 572 | 575 |
| Population Density | 1,707.2 / km² | 1,419.2 / km² | 1,113.6 / km² | 915.2 / km² | 920 / km² |
Lanaja Population change from 2000 to 2015
Decrease of 17.8% from year 2000 to 2015
| Location | Change since 1975 | Change since 1990 | Change since 2000 |
|---|---|---|---|
| Lanaja | -46.4% | -35.5% | -17.8% |
| Spain | +28.4% | +17.7% | +13.2% |
Lanaja Median Age
Median Age: 52.2 years
| Location | Median Age | Median Age (Female) | Median Age (Male) |
|---|---|---|---|
| Lanaja | 52.2 yrs | 55 yrs | 50.5 yrs |
| Spain | 40.8 yrs | 42 yrs | 39.7 yrs |
Lanaja Population Density
Population Density: 920 / km²
| Location | Population | Area | Density |
|---|---|---|---|
| Lanaja | 575 | 0.625 km² | 920 / km² |
| Spain | 45.3 million | 505,993.5 km² | 89.5 / km² |
Lanaja Historical and Projected Population
Estimated Population from 0 to 2100
- JRC (European Commission's Joint Research Centre) work on the GHS built-up grid
- CIESIN (Center for International Earth Science Information Network)
- [Link] Klein Goldewijk, K., Beusen, A., Doelman, J., and Stehfest, E.: Anthropogenic land use estimates for the Holocene – HYDE 3.2, Earth Syst. Sci. Data, 9, 927–953, https://doi.org/10.5194/essd-9-927-2017, 2017.
Human Development Index (HDI)
Statistic composite index of life expectancy, education, and per capita income.
Lanaja CO2 Emissions
Carbon Dioxide (CO2) Emissions Per Capita in Tonnes Per Year
| Location | CO2 Emissions | CO2 Emissions Per Capita | CO2 Emissions Intensity |
|---|---|---|---|
| Lanaja | 4,375 tn | 7.61 tn | 7,000.6 tons/km² |
| Spain | 330,097,501 tn | 7.29 tn | 652.4 tons/km² |
| 2013 CO2 emissions (tonnes/year) | 4,375 tn |
| 2013 CO2 emissions (tonnes/year) per capita | 7.61 tn |
| 2013 CO2 emissions intensity (tonnes/km²/year) | 7,000.6 tons/km² |
Recent Nearby Earthquakes
Magnitude 3.0 and greater
| Date▼ | Time↕ | Magnitude↕ | Distance↕ | Depth↕ | Location↕ | Link |
|---|---|---|---|---|---|---|
| 4/8/11 | 3:07 PM | 3.8 | 91.3 km | 11,000 m | Spain | usgs.gov |
| 12/29/08 | 12:24 PM | 3 | 49.9 km | 2,000 m | Spain | usgs.gov |
| 7/5/02 | 4:26 PM | 3.1 | 98.7 km | 1,500 m | Pyrenees | usgs.gov |
| 11/28/00 | 5:25 PM | 3 | 61.6 km | 2,000 m | Pyrenees | usgs.gov |
| 6/6/00 | 11:45 AM | 3 | 31.8 km | 0 m | Pyrenees | usgs.gov |
| 1/8/00 | 9:04 PM | 3 | 58.2 km | 2,000 m | Pyrenees | usgs.gov |
| 9/30/99 | 9:37 AM | 3 | 68 km | 5,800 m | Pyrenees | usgs.gov |
| 5/27/99 | 9:59 AM | 3 | 63.2 km | 2,800 m | Pyrenees | usgs.gov |
| 11/11/98 | 12:07 PM | 3.1 | 70.8 km | 2,000 m | Pyrenees | usgs.gov |
| 10/6/98 | 11:02 AM | 3.4 | 60.4 km | 10,000 m | Spain | usgs.gov |
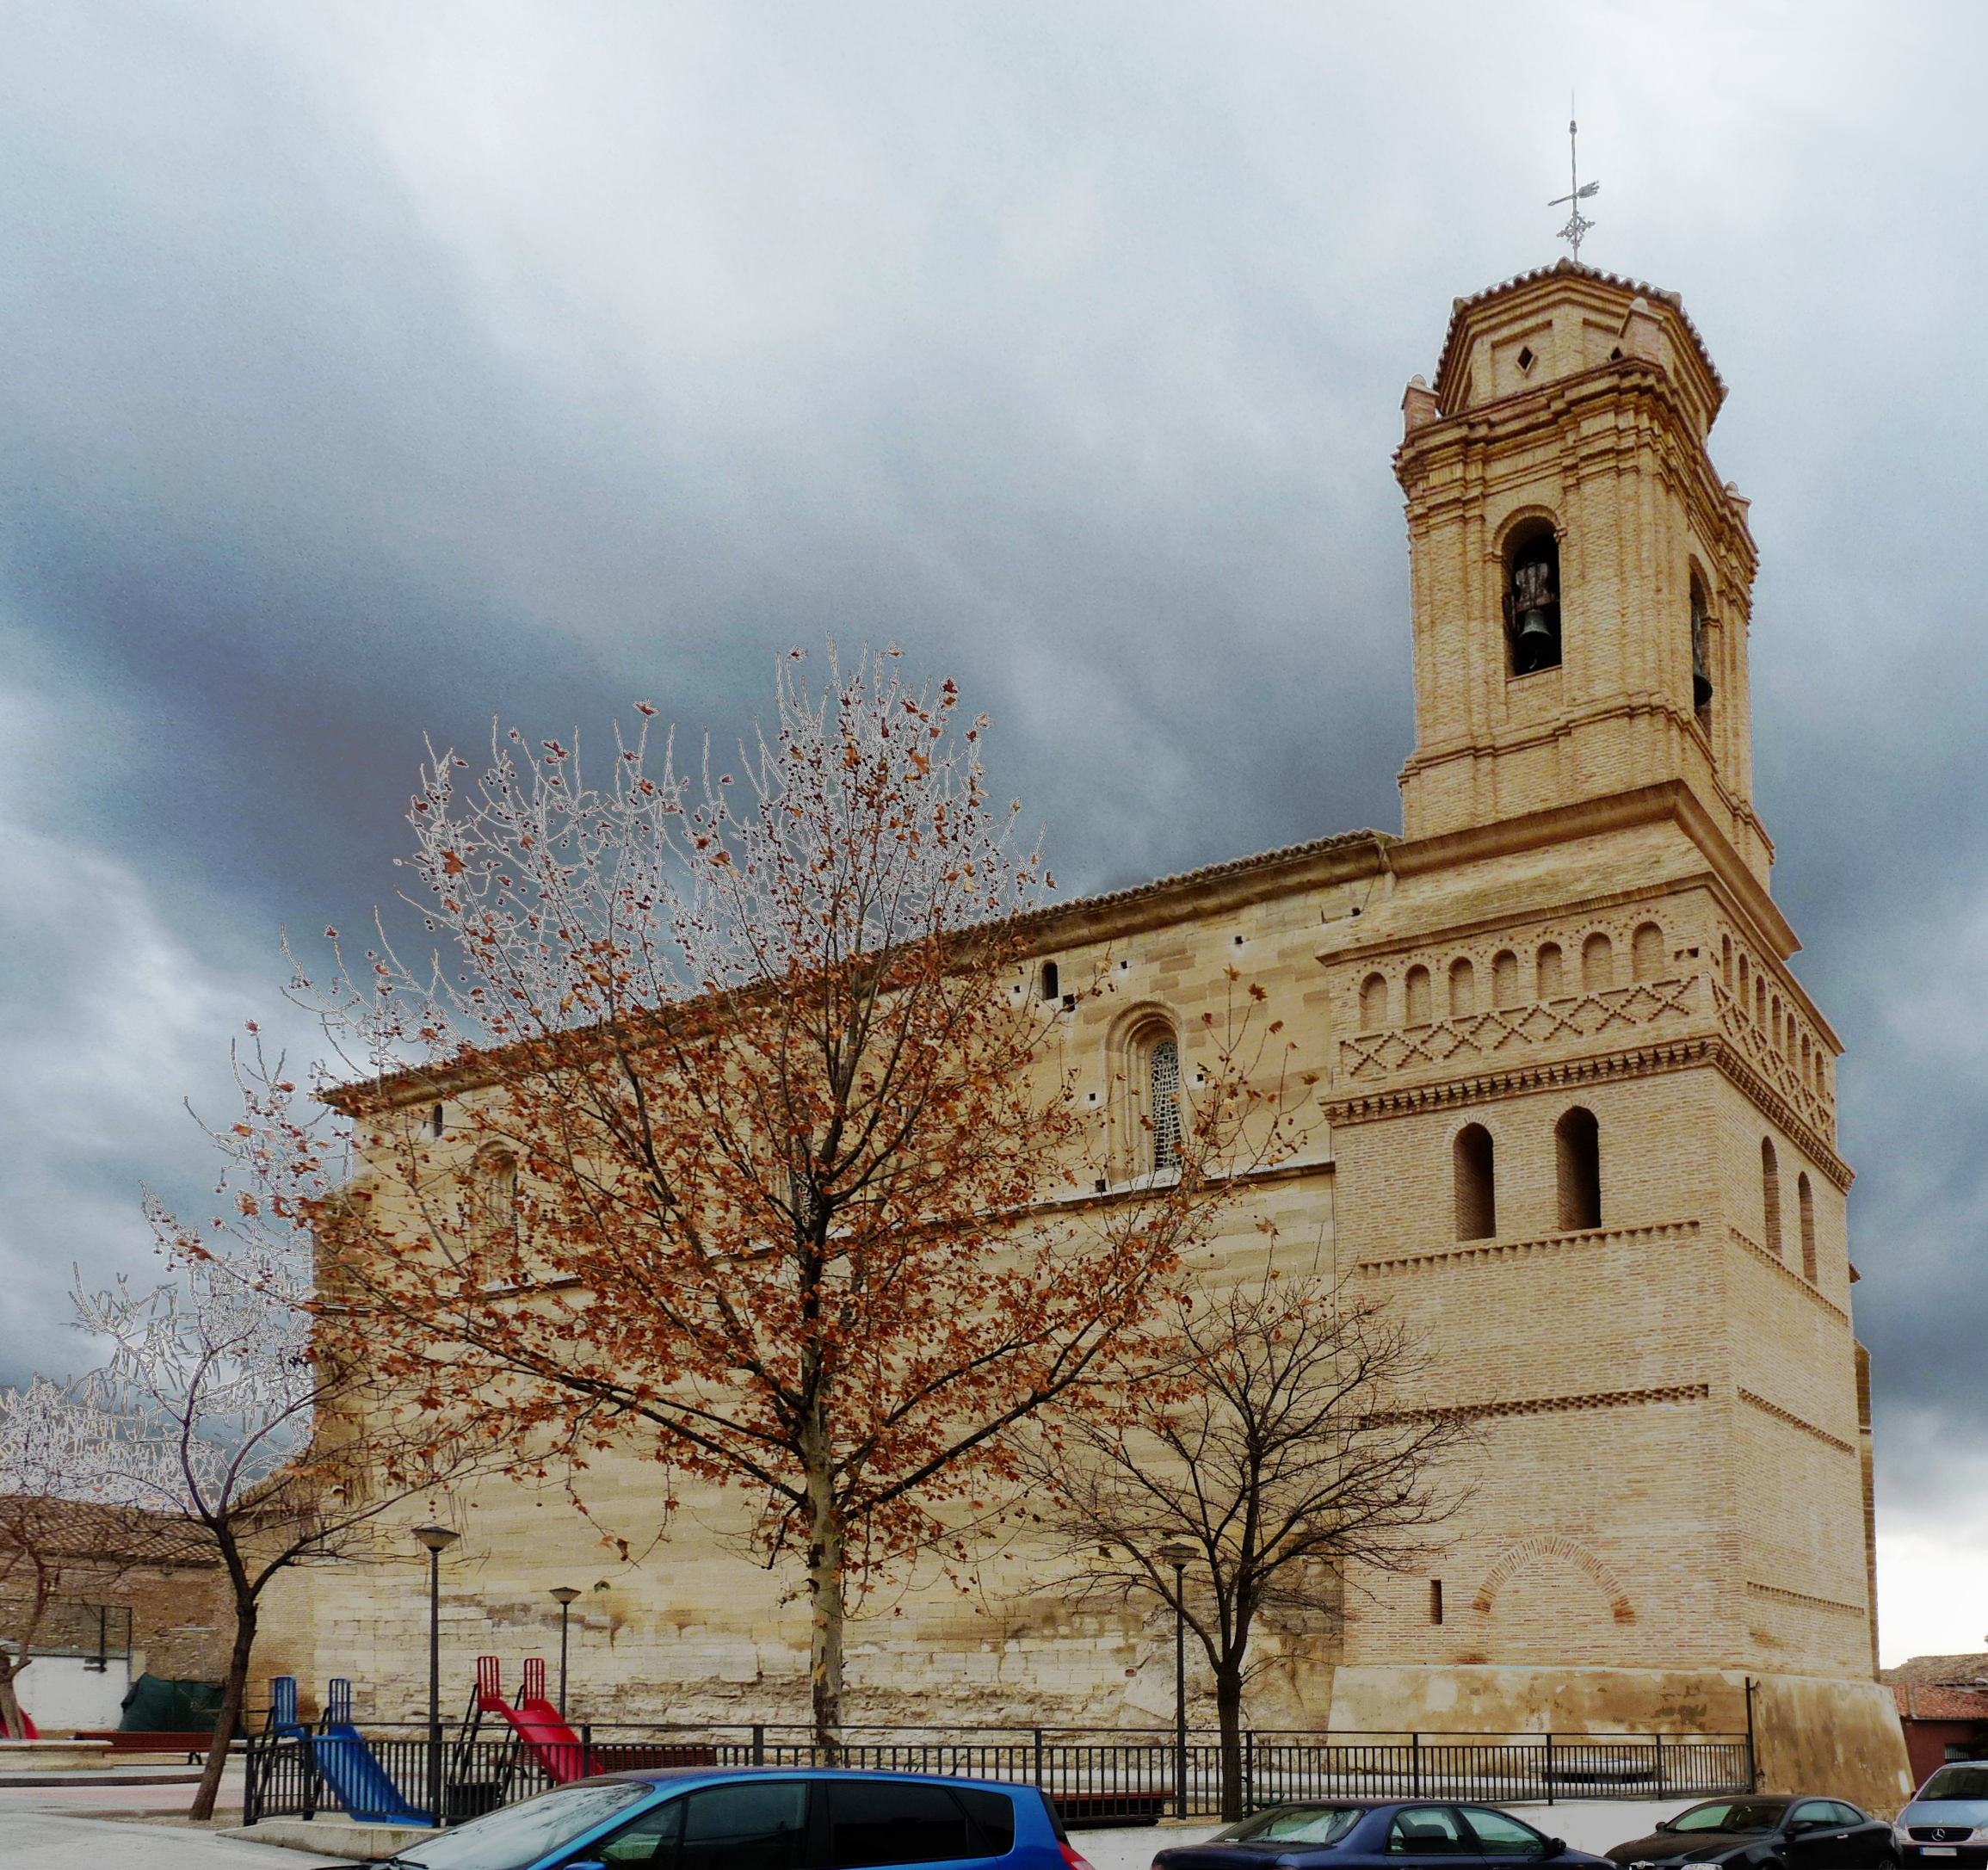
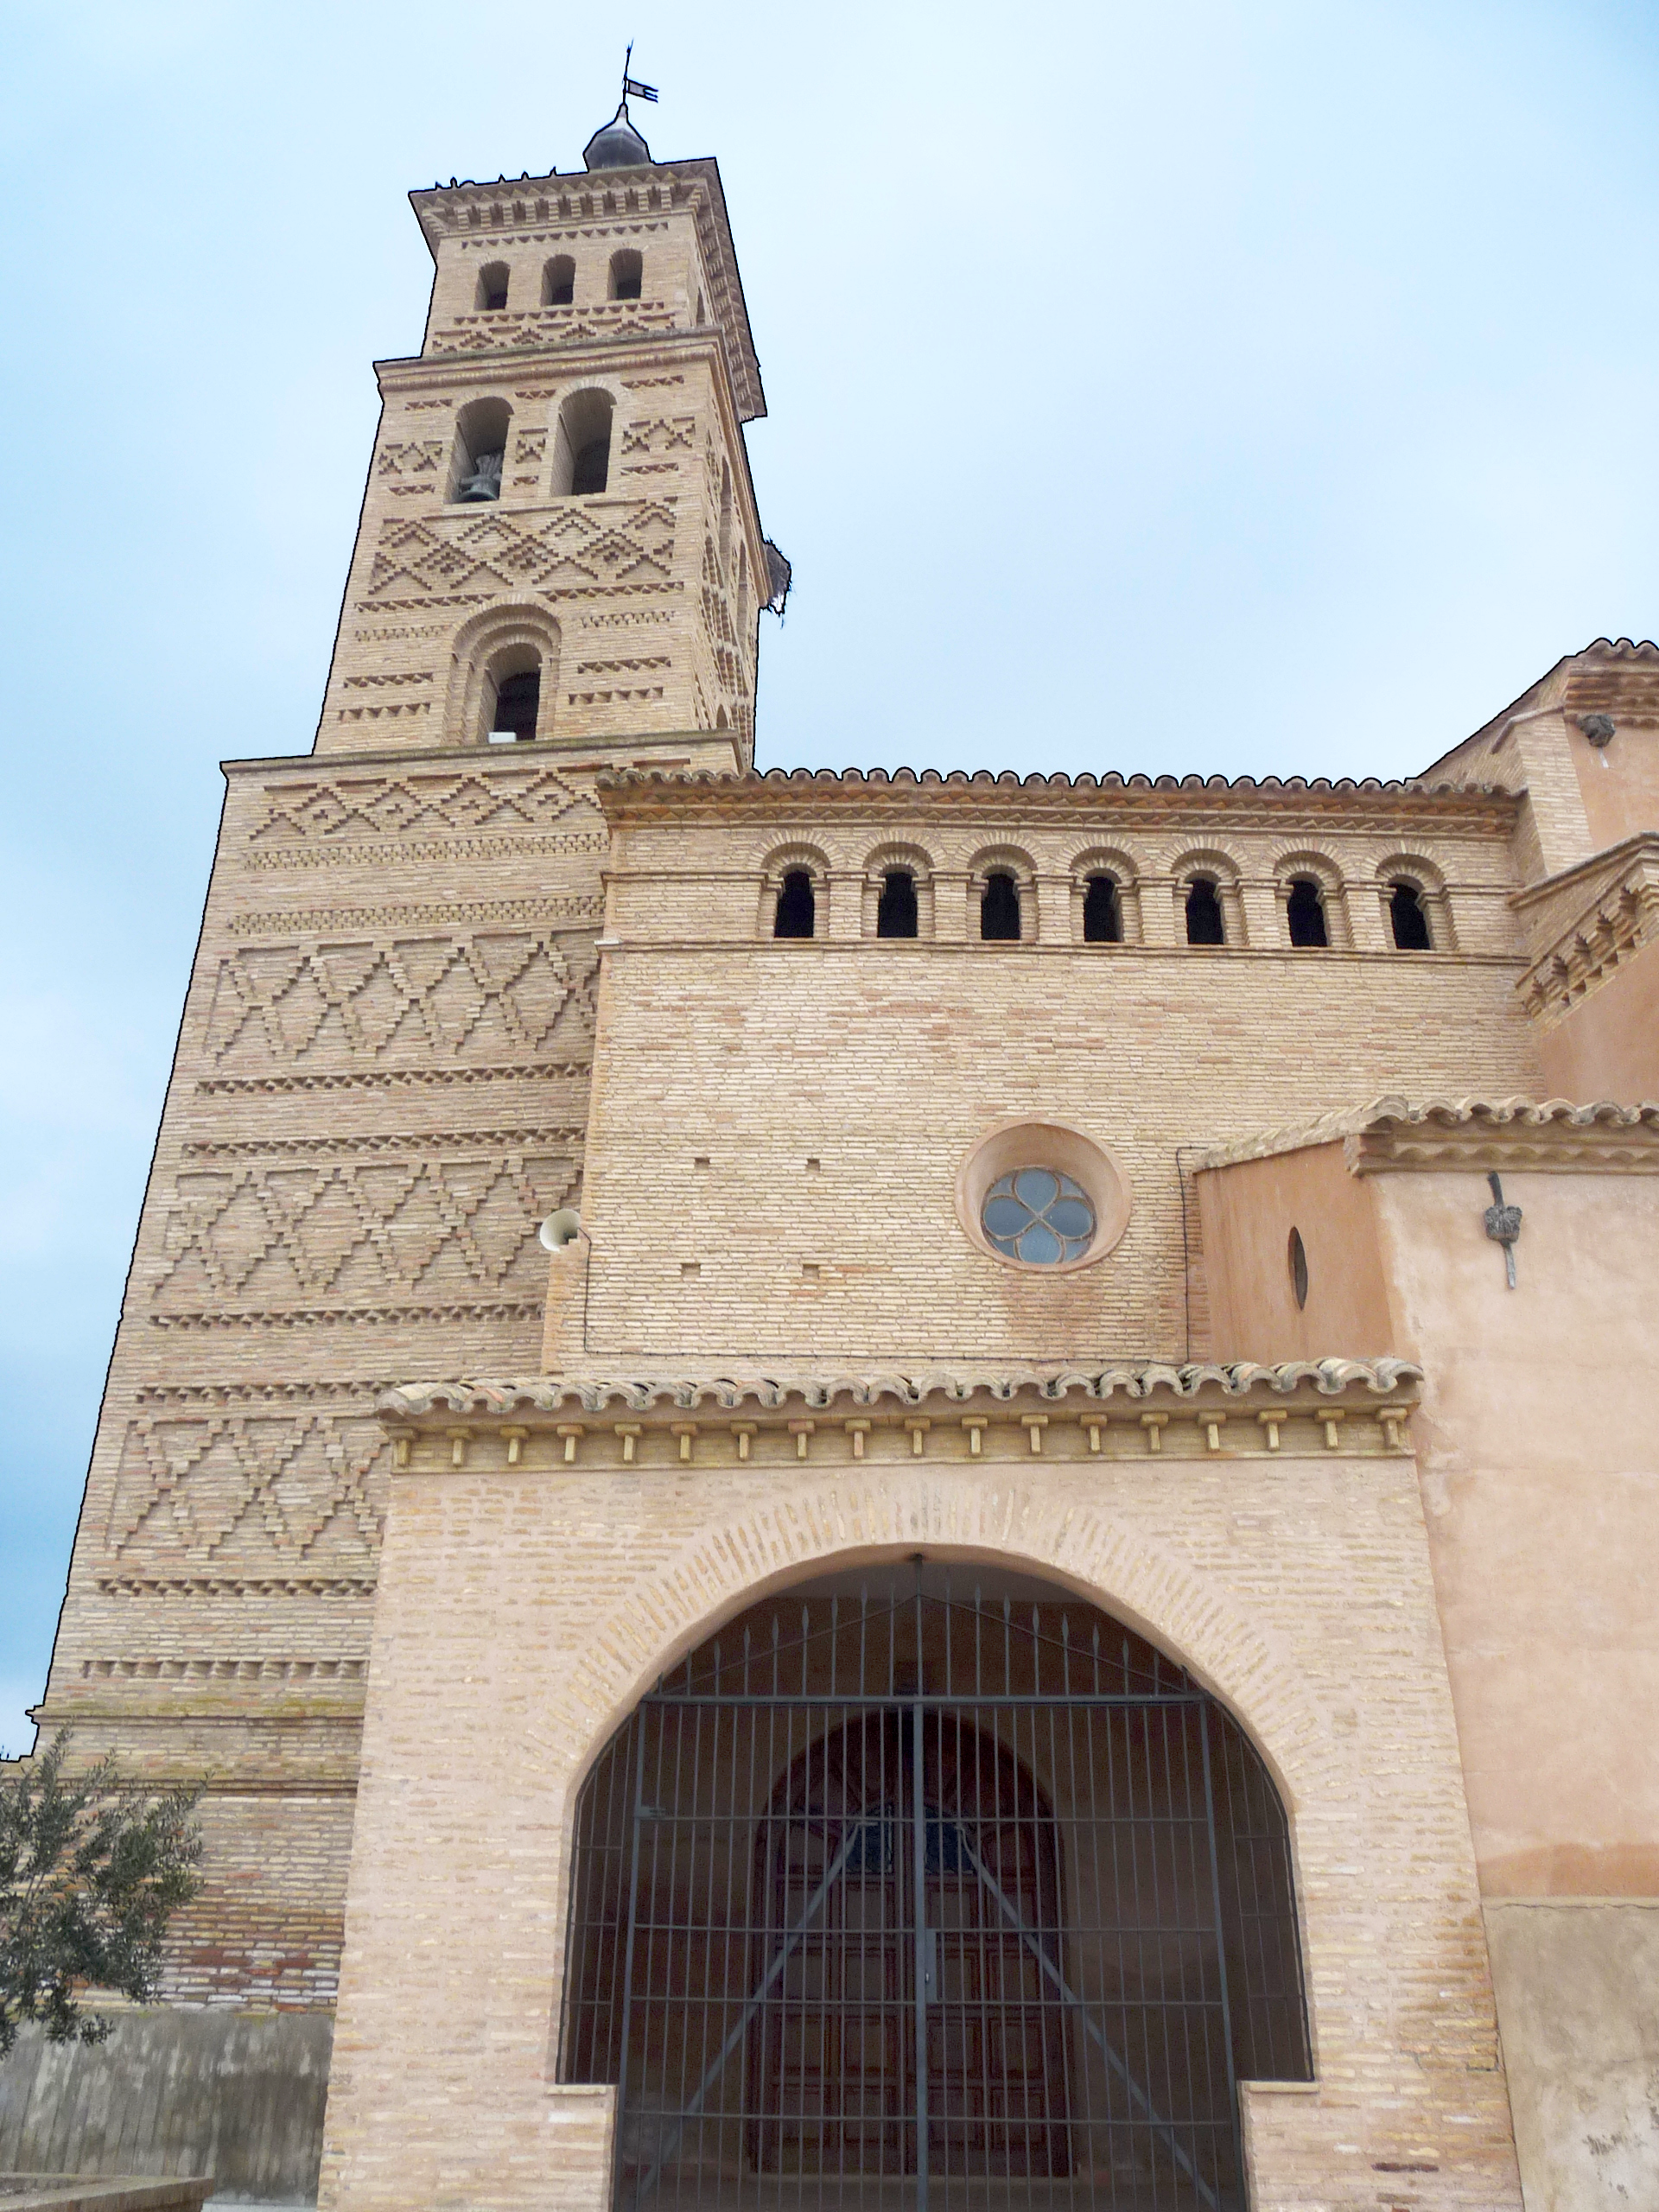
Lanaja
Lanaja is a municipality located in the province of Huesca, Aragon, Spain. According to the 2011 census (INE), the municipality has a population of 1,381 inhabitants. The village has approximately 1,100 inhabitants; the neighbouring villages of Canta..
Lanaja Wikipedia Page
About Our Data
The data on this page is estimated using a number of publicly available tools and resources. It is provided without warranty, and could contain inaccuracies. Use at your own risk.