Categories in Panticosa
Industries
Business Distribution by Industry in Panticosa
| Industry Description | Number of Establishments |
|---|---|
| Other accommodation | 28 |
| Restaurants | 21 |
| Real estate | 19 |
| Sports other | 16 |
| Travel agencies | 16 |
| Bars, pubs and taverns | 12 |
| Hotels and motels | 11 |
| Zoos and aquariums | 9 |
| Shopping | 8 |
| Sporting goods | 7 |
| Bottled water and beverages | 7 |
| Unreachable | 5 |
Panticosa Facts
| Area | 0.3 km² |
| Population | 160 |
| Male Population | 82 (51.3%) |
| Female Population | 78 (48.7%) |
| Population change (1975 to 2020) | -39.4% |
| Population change (2000 to 2020) | -36.3% |
| Median Age | 43.3 years (Male: 43.5, Female: 43) |
| Local Time | |
| Timezone | Central European Summer Time |
| Lat & Lng | 42.72381, -0.28170 |
| Postal Codes | 22650, 22661 |
Map of Panticosa
Interactive Map
Panticosa Population
Years 1975 to 2020
| Data | 1975 | 1990 | 2000 | 2015 | 2020 |
|---|---|---|---|---|---|
| Population | 264 | 324 | 251 | 163 | 160 |
| Population Density | 844.8 / km² | 1,036.8 / km² | 803.2 / km² | 521.6 / km² | 512 / km² |
Panticosa Population change from 2000 to 2015
Decrease of 35.1% from year 2000 to 2015
| Location | Change since 1975 | Change since 1990 | Change since 2000 |
|---|---|---|---|
| Panticosa | -38.3% | -49.7% | -35.1% |
| Spain | +28.4% | +17.7% | +13.2% |
Panticosa Median Age
Median Age: 43.3 years
| Location | Median Age | Median Age (Female) | Median Age (Male) |
|---|---|---|---|
| Panticosa | 43.3 yrs | 43 yrs | 43.5 yrs |
| Spain | 40.8 yrs | 42 yrs | 39.7 yrs |
Panticosa Population Density
Population Density: 512 / km²
| Location | Population | Area | Density |
|---|---|---|---|
| Panticosa | 160 | 0.313 km² | 512 / km² |
| Spain | 45.3 million | 505,993.5 km² | 89.5 / km² |
Panticosa Historical and Projected Population
Estimated Population from 0 to 2100
- JRC (European Commission's Joint Research Centre) work on the GHS built-up grid
- CIESIN (Center for International Earth Science Information Network)
- [Link] Klein Goldewijk, K., Beusen, A., Doelman, J., and Stehfest, E.: Anthropogenic land use estimates for the Holocene – HYDE 3.2, Earth Syst. Sci. Data, 9, 927–953, https://doi.org/10.5194/essd-9-927-2017, 2017.
Area Codes
Percentage Area Codes used by businesses in Panticosa
Postal Codes
Percentage of businesses by Postal Codes in Panticosa
Price Distribution
Business distribution by price for Panticosa
Human Development Index (HDI)
Statistic composite index of life expectancy, education, and per capita income.
Panticosa CO2 Emissions
Carbon Dioxide (CO2) Emissions Per Capita in Tonnes Per Year
| Location | CO2 Emissions | CO2 Emissions Per Capita | CO2 Emissions Intensity |
|---|---|---|---|
| Panticosa | 1,217 tn | 7.61 tn | 3,896 tons/km² |
| Spain | 330,097,501 tn | 7.29 tn | 652.4 tons/km² |
| 2013 CO2 emissions (tonnes/year) | 1,217 tn |
| 2013 CO2 emissions (tonnes/year) per capita | 7.61 tn |
| 2013 CO2 emissions intensity (tonnes/km²/year) | 3,896 tons/km² |
Natural Hazards Risk
Relative risk out of 10
| Hazard | Risk Level |
|---|---|
| Earthquake | Medium (4) |
| Landslide | Medium (6) |
* Risk, particularly concerning flood or landslide, may not be for the entire area.
- Dilley, M., R.S. Chen, U. Deichmann, A.L. Lerner-Lam, M. Arnold, J. Agwe, P. Buys, O. Kjekstad, B. Lyon, and G. Yetman. 2005. Natural Disaster Hotspots: A Global Risk Analysis. Washington, D.C.: World Bank. https://doi.org/10.1596/0-8213-5930-4.
- Center for Hazards and Risk Research - CHRR - Columbia University, Center for International Earth Science Information Network - CIESIN - Columbia University, and Norwegian Geotechnical Institute - NGI. 2005. Global Landslide Hazard Distribution. Palisades, NY: NASA Socioeconomic Data and Applications Center (SEDAC). https://doi.org/10.7927/H4P848VZ.
- Center for Hazards and Risk Research - CHRR - Columbia University, Center for International Earth Science Information Network - CIESIN - Columbia University. 2005. Global Earthquake Hazard Distribution - Peak Ground Acceleration. Palisades, NY: NASA Socioeconomic Data and Applications Center (SEDAC). https://doi.org/10.7927/H4BZ63ZS.
Recent Nearby Earthquakes
Magnitude 3.0 and greater
| Date▼ | Time↕ | Magnitude↕ | Distance↕ | Depth↕ | Location↕ | Link |
|---|---|---|---|---|---|---|
| 4/29/14 | 7:03 AM | 4.1 | 37.3 km | 11,100 m | 5km ENE of Pierrefitte-Nestalas, France | usgs.gov |
| 1/5/13 | 11:26 PM | 4.1 | 38.7 km | 2,000 m | Pyrenees | usgs.gov |
| 2/9/09 | 8:38 AM | 4.2 | 44.1 km | 3,000 m | Pyrenees | usgs.gov |
| 9/18/08 | 12:55 PM | 4 | 30 km | 5,000 m | Pyrenees | usgs.gov |
| 3/18/08 | 8:05 PM | 3 | 33.5 km | 5,000 m | Pyrenees | usgs.gov |
| 10/3/07 | 9:00 PM | 3 | 39.4 km | 0 m | Pyrenees | usgs.gov |
| 12/15/06 | 6:34 PM | 3.1 | 37.6 km | 12,000 m | Pyrenees | usgs.gov |
| 11/20/06 | 4:01 AM | 3.2 | 38.7 km | 8,000 m | Pyrenees | usgs.gov |
| 11/19/06 | 1:16 PM | 3.5 | 38.2 km | 10,000 m | Pyrenees | usgs.gov |
| 11/19/06 | 5:10 AM | 3 | 38.8 km | 9,000 m | Pyrenees | usgs.gov |
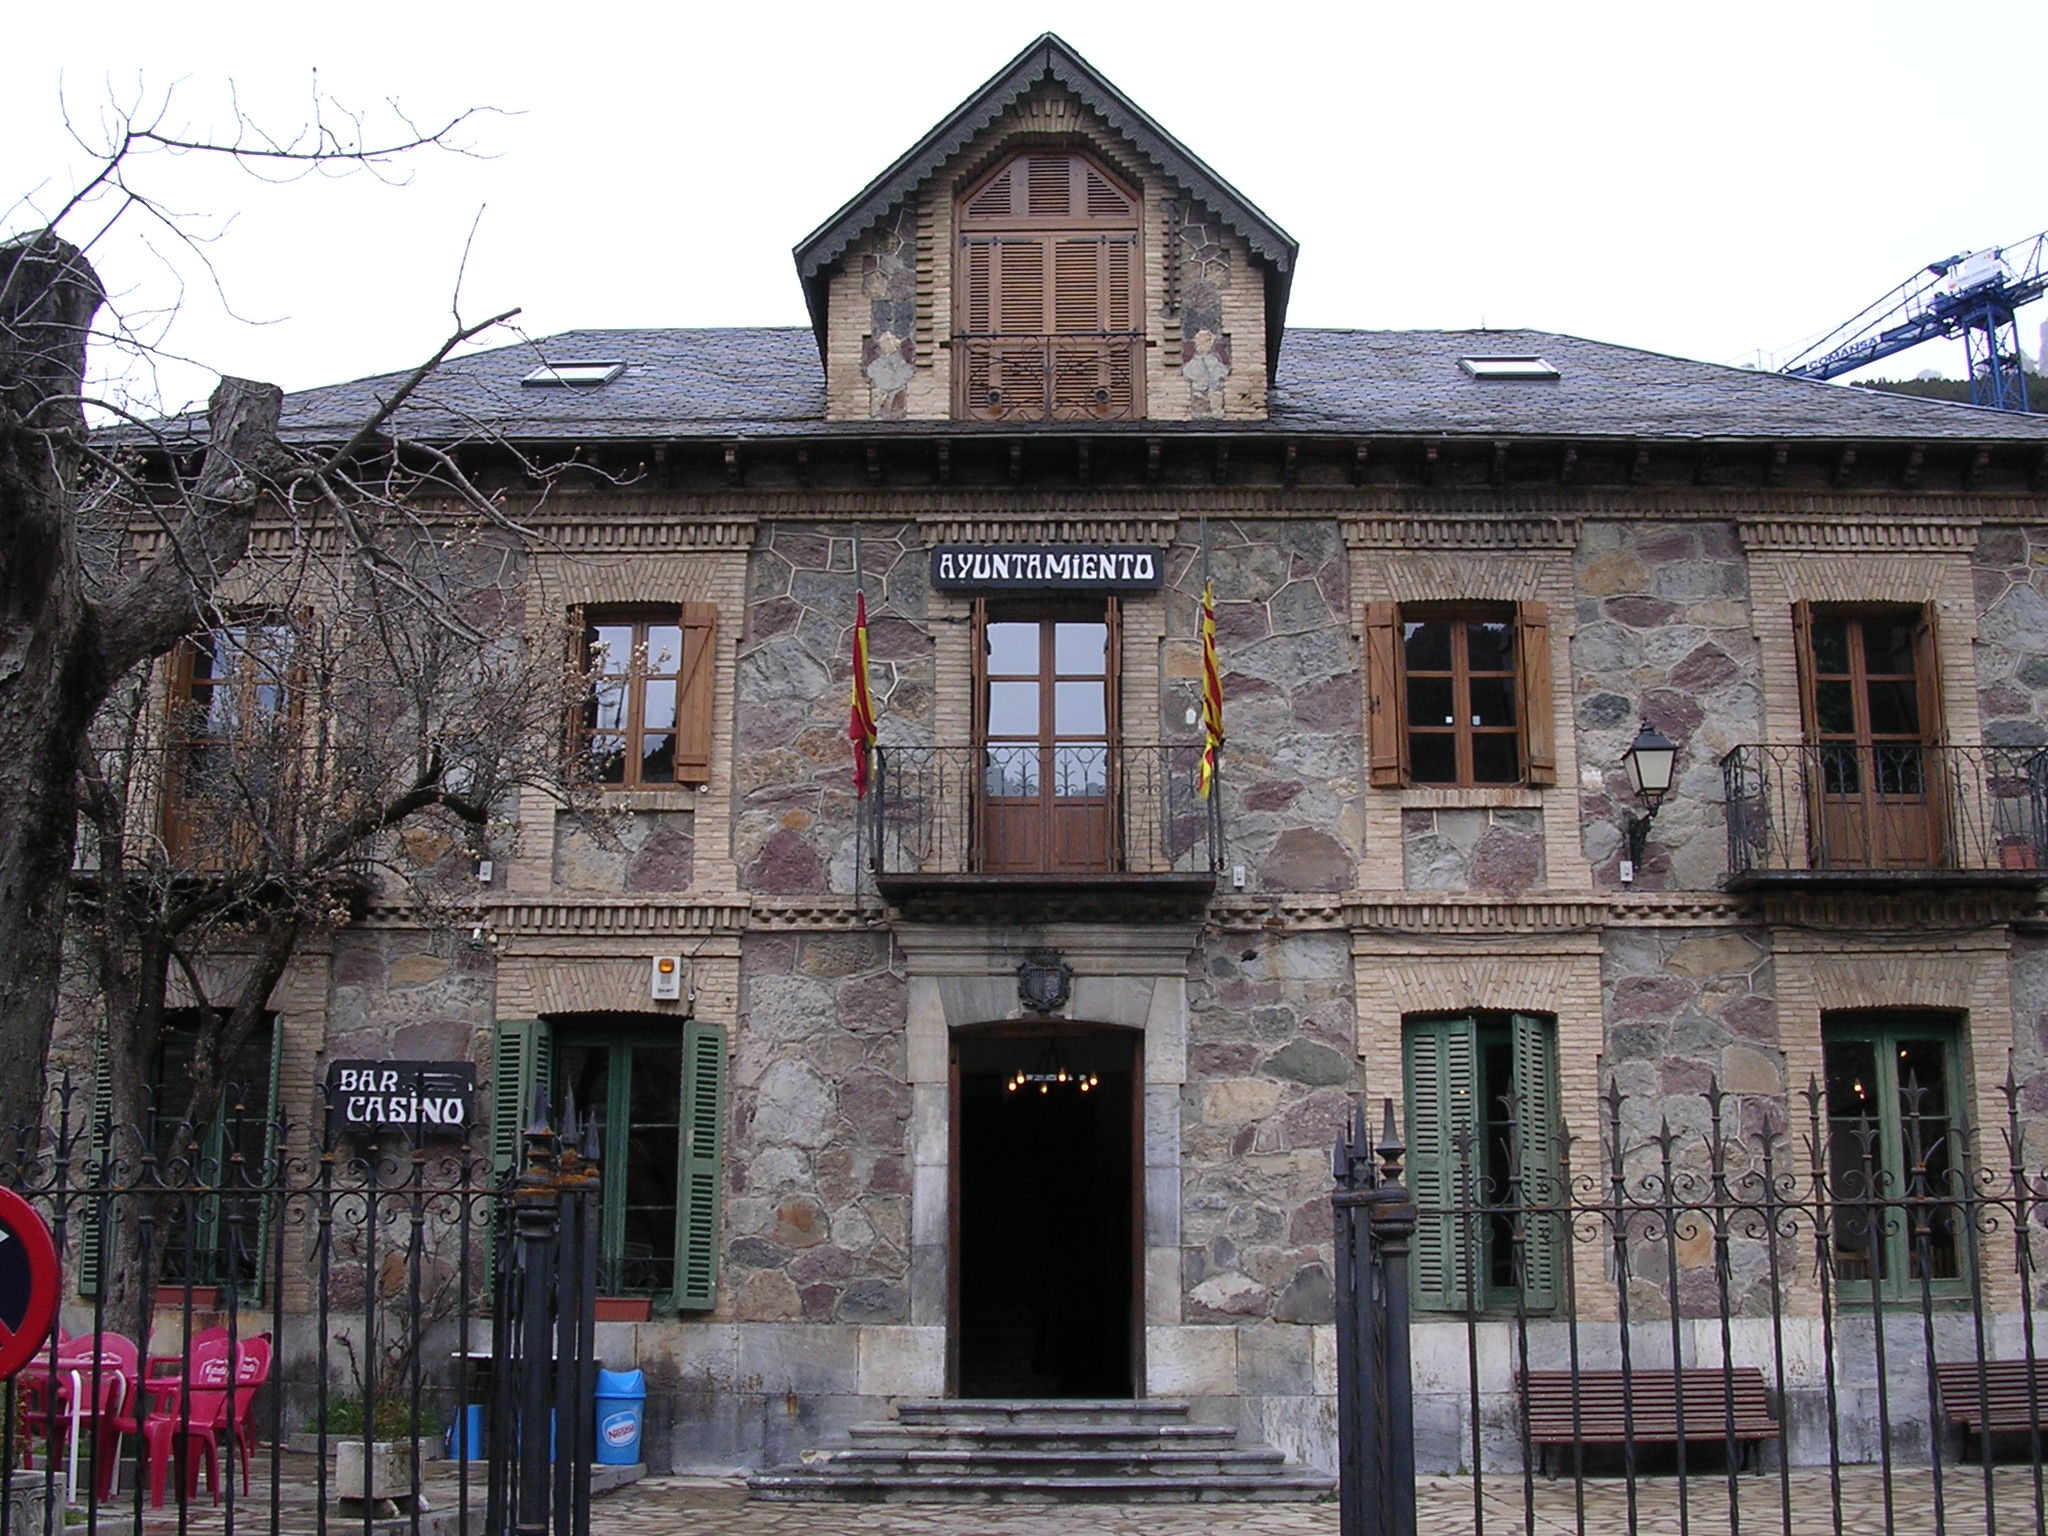
Panticosa
Panticosa is a municipality located in the province of Huesca, Aragon, Spain. the late 19th century and early 20th century, it was a successful spa town, famous for its pure mountain waters, that supposedly cured from liver diseases and herpes. Its ..
Panticosa Wikipedia Page


About Our Data
The data on this page is estimated using a number of publicly available tools and resources. It is provided without warranty, and could contain inaccuracies. Use at your own risk.