Categories in Tarragona
Industries
Business Distribution by Industry in Tarragona
| Industry Description | Number of Establishments | Average Age of Business |
|---|---|---|
| Restaurants | 1,747 | 25 years |
| Shopping | 1,067 | 33 years |
| Real estate | 1,055 | 20 years |
| Corporate management | 986 | 27 years |
| Lawyers legal | 692 | — |
| Bars, pubs and taverns | 689 | — |
| Beauty salons | 549 | — |
| Construction of buildings | 525 | — |
| Grocery stores and supermarkets | 507 | — |
| Clothing stores | 437 | — |
| Car repair | 423 | — |
Tarragona Facts
| Area | 16.7 km² |
| Population | 71,331 |
| Male Population | 35,148 (49.3%) |
| Female Population | 36,183 (50.7%) |
| Population change (1975 to 2020) | +106.4% |
| Population change (2000 to 2020) | +33.9% |
| Median Age | 39.1 years (Male: 38.2, Female: 40.2) |
| Area Codes | 877, 977 |
| Neighborhoods | Torreforta, Sant Pere i Sant Pau, Camp Clar, Riu Clar, La Móra |
| Local Time | |
| Timezone | Central European Summer Time |
| Lat & Lng | 41.11667, 1.25000 |
| Postal Codes | 43001, 43002, 43003, 43004, 43005, More |
Map of Tarragona
Interactive Map
Tarragona Population
Years 1975 to 2020
| Data | 1975 | 1990 | 2000 | 2015 | 2020 |
|---|---|---|---|---|---|
| Population | 34,559 | 46,158 | 53,271 | 70,168 | 71,331 |
| Population Density | 2,071 / km² | 2,766 / km² | 3,192.3 / km² | 4,204.8 / km² | 4,274.5 / km² |
Tarragona Population change from 2000 to 2015
Increase of 31.7% from year 2000 to 2015
| Location | Change since 1975 | Change since 1990 | Change since 2000 |
|---|---|---|---|
| Tarragona | +103% | +52% | +31.7% |
| Spain | +28.4% | +17.7% | +13.2% |
Tarragona Median Age
Median Age: 39.1 years
| Location | Median Age | Median Age (Female) | Median Age (Male) |
|---|---|---|---|
| Tarragona | 39.1 yrs | 40.2 yrs | 38.2 yrs |
| Spain | 40.8 yrs | 42 yrs | 39.7 yrs |
Tarragona Population Density
Population Density: 4,275 / km²
| Location | Population | Area | Density |
|---|---|---|---|
| Tarragona | 71,331 | 16.7 km² | 4,275 / km² |
| Spain | 45.3 million | 505,993.5 km² | 89.5 / km² |
Tarragona Historical and Projected Population
Estimated Population from 1720 to 2100
- JRC (European Commission's Joint Research Centre) work on the GHS built-up grid
- CIESIN (Center for International Earth Science Information Network)
- [Link] Klein Goldewijk, K., Beusen, A., Doelman, J., and Stehfest, E.: Anthropogenic land use estimates for the Holocene – HYDE 3.2, Earth Syst. Sci. Data, 9, 927–953, https://doi.org/10.5194/essd-9-927-2017, 2017.
Neighborhoods in Tarragona
Percentage of businesses by neighborhood in Tarragona
Area Codes
Percentage Area Codes used by businesses in Tarragona
Postal Codes
Percentage of businesses by Postal Codes in Tarragona
Price Distribution
Business distribution by price for Tarragona
Human Development Index (HDI)
Statistic composite index of life expectancy, education, and per capita income.
Tarragona CO2 Emissions
Carbon Dioxide (CO2) Emissions Per Capita in Tonnes Per Year
| Location | CO2 Emissions | CO2 Emissions Per Capita | CO2 Emissions Intensity |
|---|---|---|---|
| Tarragona | 446,899 tn | 6.27 tn | 26,780.5 tons/km² |
| Spain | 330,097,501 tn | 7.29 tn | 652.4 tons/km² |
| 2013 CO2 emissions (tonnes/year) | 446,899 tn |
| 2013 CO2 emissions (tonnes/year) per capita | 6.27 tn |
| 2013 CO2 emissions intensity (tonnes/km²/year) | 26,780.5 tons/km² |
Natural Hazards Risk
Relative risk out of 10
| Hazard | Risk Level |
|---|---|
| Flood | Medium (7) |
| Earthquake | Low (3) |
* Risk, particularly concerning flood or landslide, may not be for the entire area.
- Dilley, M., R.S. Chen, U. Deichmann, A.L. Lerner-Lam, M. Arnold, J. Agwe, P. Buys, O. Kjekstad, B. Lyon, and G. Yetman. 2005. Natural Disaster Hotspots: A Global Risk Analysis. Washington, D.C.: World Bank. https://doi.org/10.1596/0-8213-5930-4.
- Center for Hazards and Risk Research - CHRR - Columbia University, Center for International Earth Science Information Network - CIESIN - Columbia University. 2005. Global Flood Hazard Frequency and Distribution. Palisades, NY: NASA Socioeconomic Data and Applications Center (SEDAC). https://doi.org/10.7927/H4668B3D.
- Center for Hazards and Risk Research - CHRR - Columbia University, Center for International Earth Science Information Network - CIESIN - Columbia University. 2005. Global Earthquake Hazard Distribution - Peak Ground Acceleration. Palisades, NY: NASA Socioeconomic Data and Applications Center (SEDAC). https://doi.org/10.7927/H4BZ63ZS.
Recent Nearby Earthquakes
Magnitude 3.0 and greater
| Date▼ | Time↕ | Magnitude↕ | Distance↕ | Depth↕ | Location↕ | Link |
|---|---|---|---|---|---|---|
| 10/4/13 | 8:49 AM | 3.7 | 95.8 km | 6,000 m | 28km ESE of Vinaros, Spain | usgs.gov |
| 10/2/13 | 11:29 PM | 4 | 95 km | 0 m | 29km ESE of Vinaros, Spain | usgs.gov |
| 10/2/13 | 11:06 PM | 4.3 | 94.1 km | 0 m | 30km ESE of Vinaros, Spain | usgs.gov |
| 10/1/13 | 3:32 AM | 4.1 | 95.8 km | 0 m | 30km ESE of Vinaros, Spain | usgs.gov |
| 10/11/07 | 7:19 AM | 3.3 | 67.3 km | 0 m | Spain | usgs.gov |
| 8/9/07 | 2:28 AM | 3.4 | 63.1 km | 0 m | Spain | usgs.gov |
| 8/8/07 | 4:45 PM | 4.1 | 64.9 km | 1,200 m | Spain | usgs.gov |
| 8/6/07 | 12:32 PM | 3.2 | 43.5 km | 0 m | Spain | usgs.gov |
| 8/22/04 | 10:12 AM | 3.6 | 35.7 km | 7,600 m | Balearic Islands, Spain | usgs.gov |
| 7/7/03 | 6:36 PM | 3.2 | 96.8 km | 6,100 m | Spain | usgs.gov |
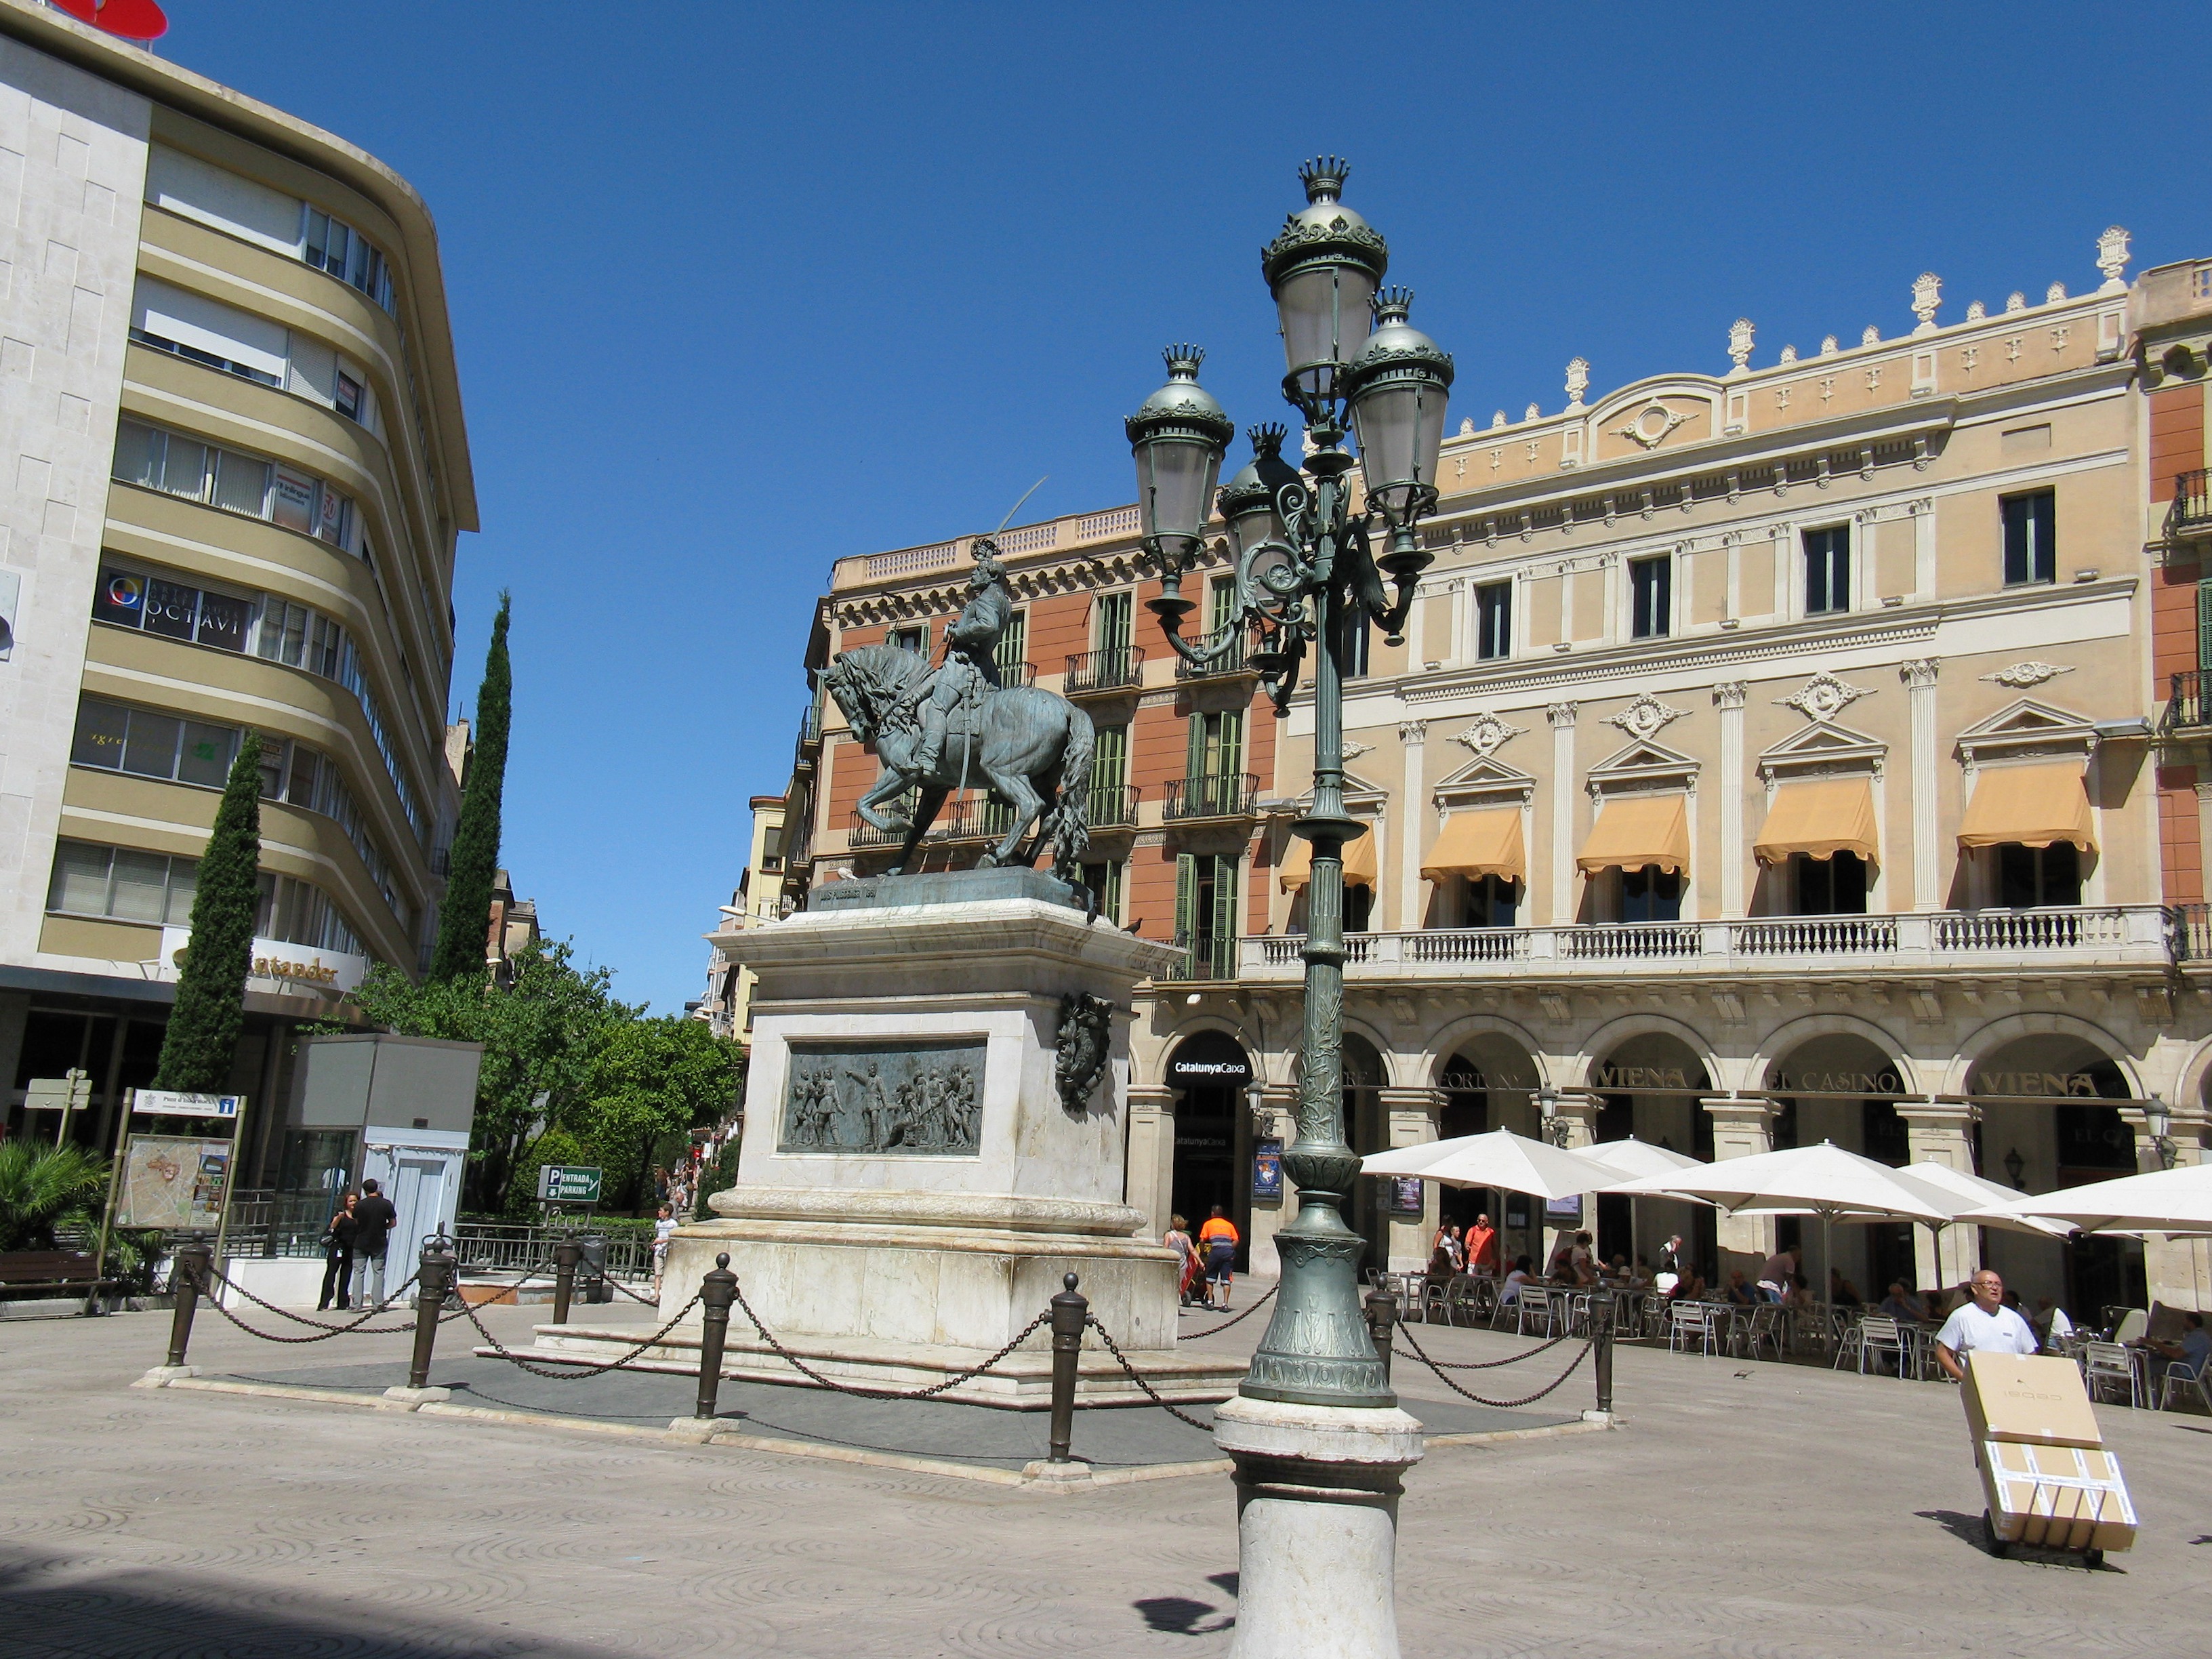
Tarraco
Tarraco is the ancient name of the current city of Tarragona (Catalonia, Spain). It was the oldest Roman settlement on the Iberian Peninsula, founded during the Second Punic War by Scipio Calvus, and became capital of the Roman province of Hispania C..
Tarraco Wikipedia Page

About Our Data
The data on this page is estimated using a number of publicly available tools and resources. It is provided without warranty, and could contain inaccuracies. Use at your own risk.