Categories in Wukro
Industries
Business Distribution by Industry in Wukro
| Industry Description | Number of Establishments |
|---|---|
| Other accommodation | 12 |
| Restaurants | 6 |
Wukro Facts
| Area | 4.1 km² |
| Population | 69,616 |
| Male Population | 32,404 (46.5%) |
| Female Population | 37,212 (53.5%) |
| Population change (1975 to 2020) | +121.4% |
| Population change (2000 to 2020) | +41.7% |
| Median Age | 19.1 years (Male: 18.3, Female: 19.7) |
| Area Codes | 34, 34443 |
| Local Time | |
| Timezone | East Africa Time |
| Lat & Lng | 13.79525, 39.60303 |
Map of Wukro
Interactive Map
Wukro Population
Years 1975 to 2020
| Data | 1975 | 1990 | 2000 | 2015 | 2020 |
|---|---|---|---|---|---|
| Population | 31,450 | 25,278 | 49,125 | 62,665 | 69,616 |
| Population Density | 7,741.5 / km² | 6,222.3 / km² | 12,092.3 / km² | 15,425.2 / km² | 17,136.2 / km² |
Wukro Population change from 2000 to 2015
Increase of 27.6% from year 2000 to 2015
| Location | Change since 1975 | Change since 1990 | Change since 2000 |
|---|---|---|---|
| Wukro | +99.3% | +147.9% | +27.6% |
| Tigray Province | +188.6% | +98% | +45.6% |
| Ethiopia | +204.4% | +106.5% | +49.5% |
Wukro Median Age
Median Age: 19.1 years
| Location | Median Age | Median Age (Female) | Median Age (Male) |
|---|---|---|---|
| Wukro | 19.1 yrs | 19.7 yrs | 18.3 yrs |
| Tigray Province | 17.8 yrs | 18.4 yrs | 17.2 yrs |
| Ethiopia | 17.1 yrs | 17.4 yrs | 16.8 yrs |
Wukro Population Density
Population Density: 17,136 / km²
| Location | Population | Area | Density |
|---|---|---|---|
| Wukro | 69,616 | 4.063 km² | 17,136 / km² |
| Tigray Province | 5.7 million | 50,223.8 km² | 114 / km² |
| Ethiopia | 99.1 million | 1,128,902.4 km² | 87.8 / km² |
Wukro Historical and Projected Population
Estimated Population from 1810 to 2100
- JRC (European Commission's Joint Research Centre) work on the GHS built-up grid
- CIESIN (Center for International Earth Science Information Network)
- [Link] Klein Goldewijk, K., Beusen, A., Doelman, J., and Stehfest, E.: Anthropogenic land use estimates for the Holocene – HYDE 3.2, Earth Syst. Sci. Data, 9, 927–953, https://doi.org/10.5194/essd-9-927-2017, 2017.
Human Development Index (HDI)
Statistic composite index of life expectancy, education, and per capita income.
Wukro CO2 Emissions
Carbon Dioxide (CO2) Emissions Per Capita in Tonnes Per Year
| Location | CO2 Emissions | CO2 Emissions Per Capita | CO2 Emissions Intensity |
|---|---|---|---|
| Wukro | 2,419 tn | 0.03 tn | 595.5 tons/km² |
| Tigray Province | 204,460 tn | 0.04 tn | 4.1 tons/km² |
| Ethiopia | 3,092,124 tn | 0.03 tn | 2.7 tons/km² |
| 2013 CO2 emissions (tonnes/year) | 2,419 tn |
| 2013 CO2 emissions (tonnes/year) per capita | 0.03 tn |
| 2013 CO2 emissions intensity (tonnes/km²/year) | 595.5 tons/km² |
Natural Hazards Risk
Relative risk out of 10
| Hazard | Risk Level |
|---|---|
| Drought | Medium (7) |
| Earthquake | Medium (4) |
* Risk, particularly concerning flood or landslide, may not be for the entire area.
- Dilley, M., R.S. Chen, U. Deichmann, A.L. Lerner-Lam, M. Arnold, J. Agwe, P. Buys, O. Kjekstad, B. Lyon, and G. Yetman. 2005. Natural Disaster Hotspots: A Global Risk Analysis. Washington, D.C.: World Bank. https://doi.org/10.1596/0-8213-5930-4.
- Center for Hazards and Risk Research - CHRR - Columbia University, Center for International Earth Science Information Network - CIESIN - Columbia University, and International Research Institute for Climate and Society - IRI - Columbia University. 2005. Global Drought Hazard Frequency and Distribution. Palisades, NY: NASA Socioeconomic Data and Applications Center (SEDAC). https://doi.org/10.7927/H4VX0DFT.
- Center for Hazards and Risk Research - CHRR - Columbia University, Center for International Earth Science Information Network - CIESIN - Columbia University. 2005. Global Earthquake Hazard Distribution - Peak Ground Acceleration. Palisades, NY: NASA Socioeconomic Data and Applications Center (SEDAC). https://doi.org/10.7927/H4BZ63ZS.
Recent Nearby Earthquakes
Magnitude 3.0 and greater
| Date▼ | Time↕ | Magnitude↕ | Distance↕ | Depth↕ | Location↕ | Link |
|---|---|---|---|---|---|---|
| 3/24/18 | 10:27 AM | 5.2 | 61.8 km | 10,000 m | 58km E of Mek'ele, Ethiopia | usgs.gov |
| 8/22/14 | 8:42 AM | 4.3 | 85 km | 10,000 m | 52km ENE of Adigrat, Ethiopia | usgs.gov |
| 3/30/14 | 3:53 AM | 4.6 | 77.1 km | 16,480 m | 36km NE of Adigrat, Ethiopia | usgs.gov |
| 1/9/10 | 8:34 PM | 4.4 | 76.5 km | 10,000 m | Eritrea - Ethiopia region | usgs.gov |
| 11/6/07 | 11:44 PM | 4.4 | 43.1 km | 10,000 m | Ethiopia | usgs.gov |
| 11/4/07 | 9:06 PM | 4.5 | 57.5 km | 10,000 m | Ethiopia | usgs.gov |
| 10/19/06 | 2:14 PM | 4.1 | 38.2 km | 10,000 m | Ethiopia | usgs.gov |
| 4/10/06 | 1:36 PM | 4.9 | 88.9 km | 10,000 m | Eritrea-Ethiopia border region | usgs.gov |
| 10/22/04 | 12:00 PM | 5.5 | 85.4 km | 10,000 m | Eritrea - Ethiopia region | usgs.gov |
| 6/11/04 | 12:39 AM | 4.5 | 82.1 km | 10,000 m | Ethiopia | usgs.gov |
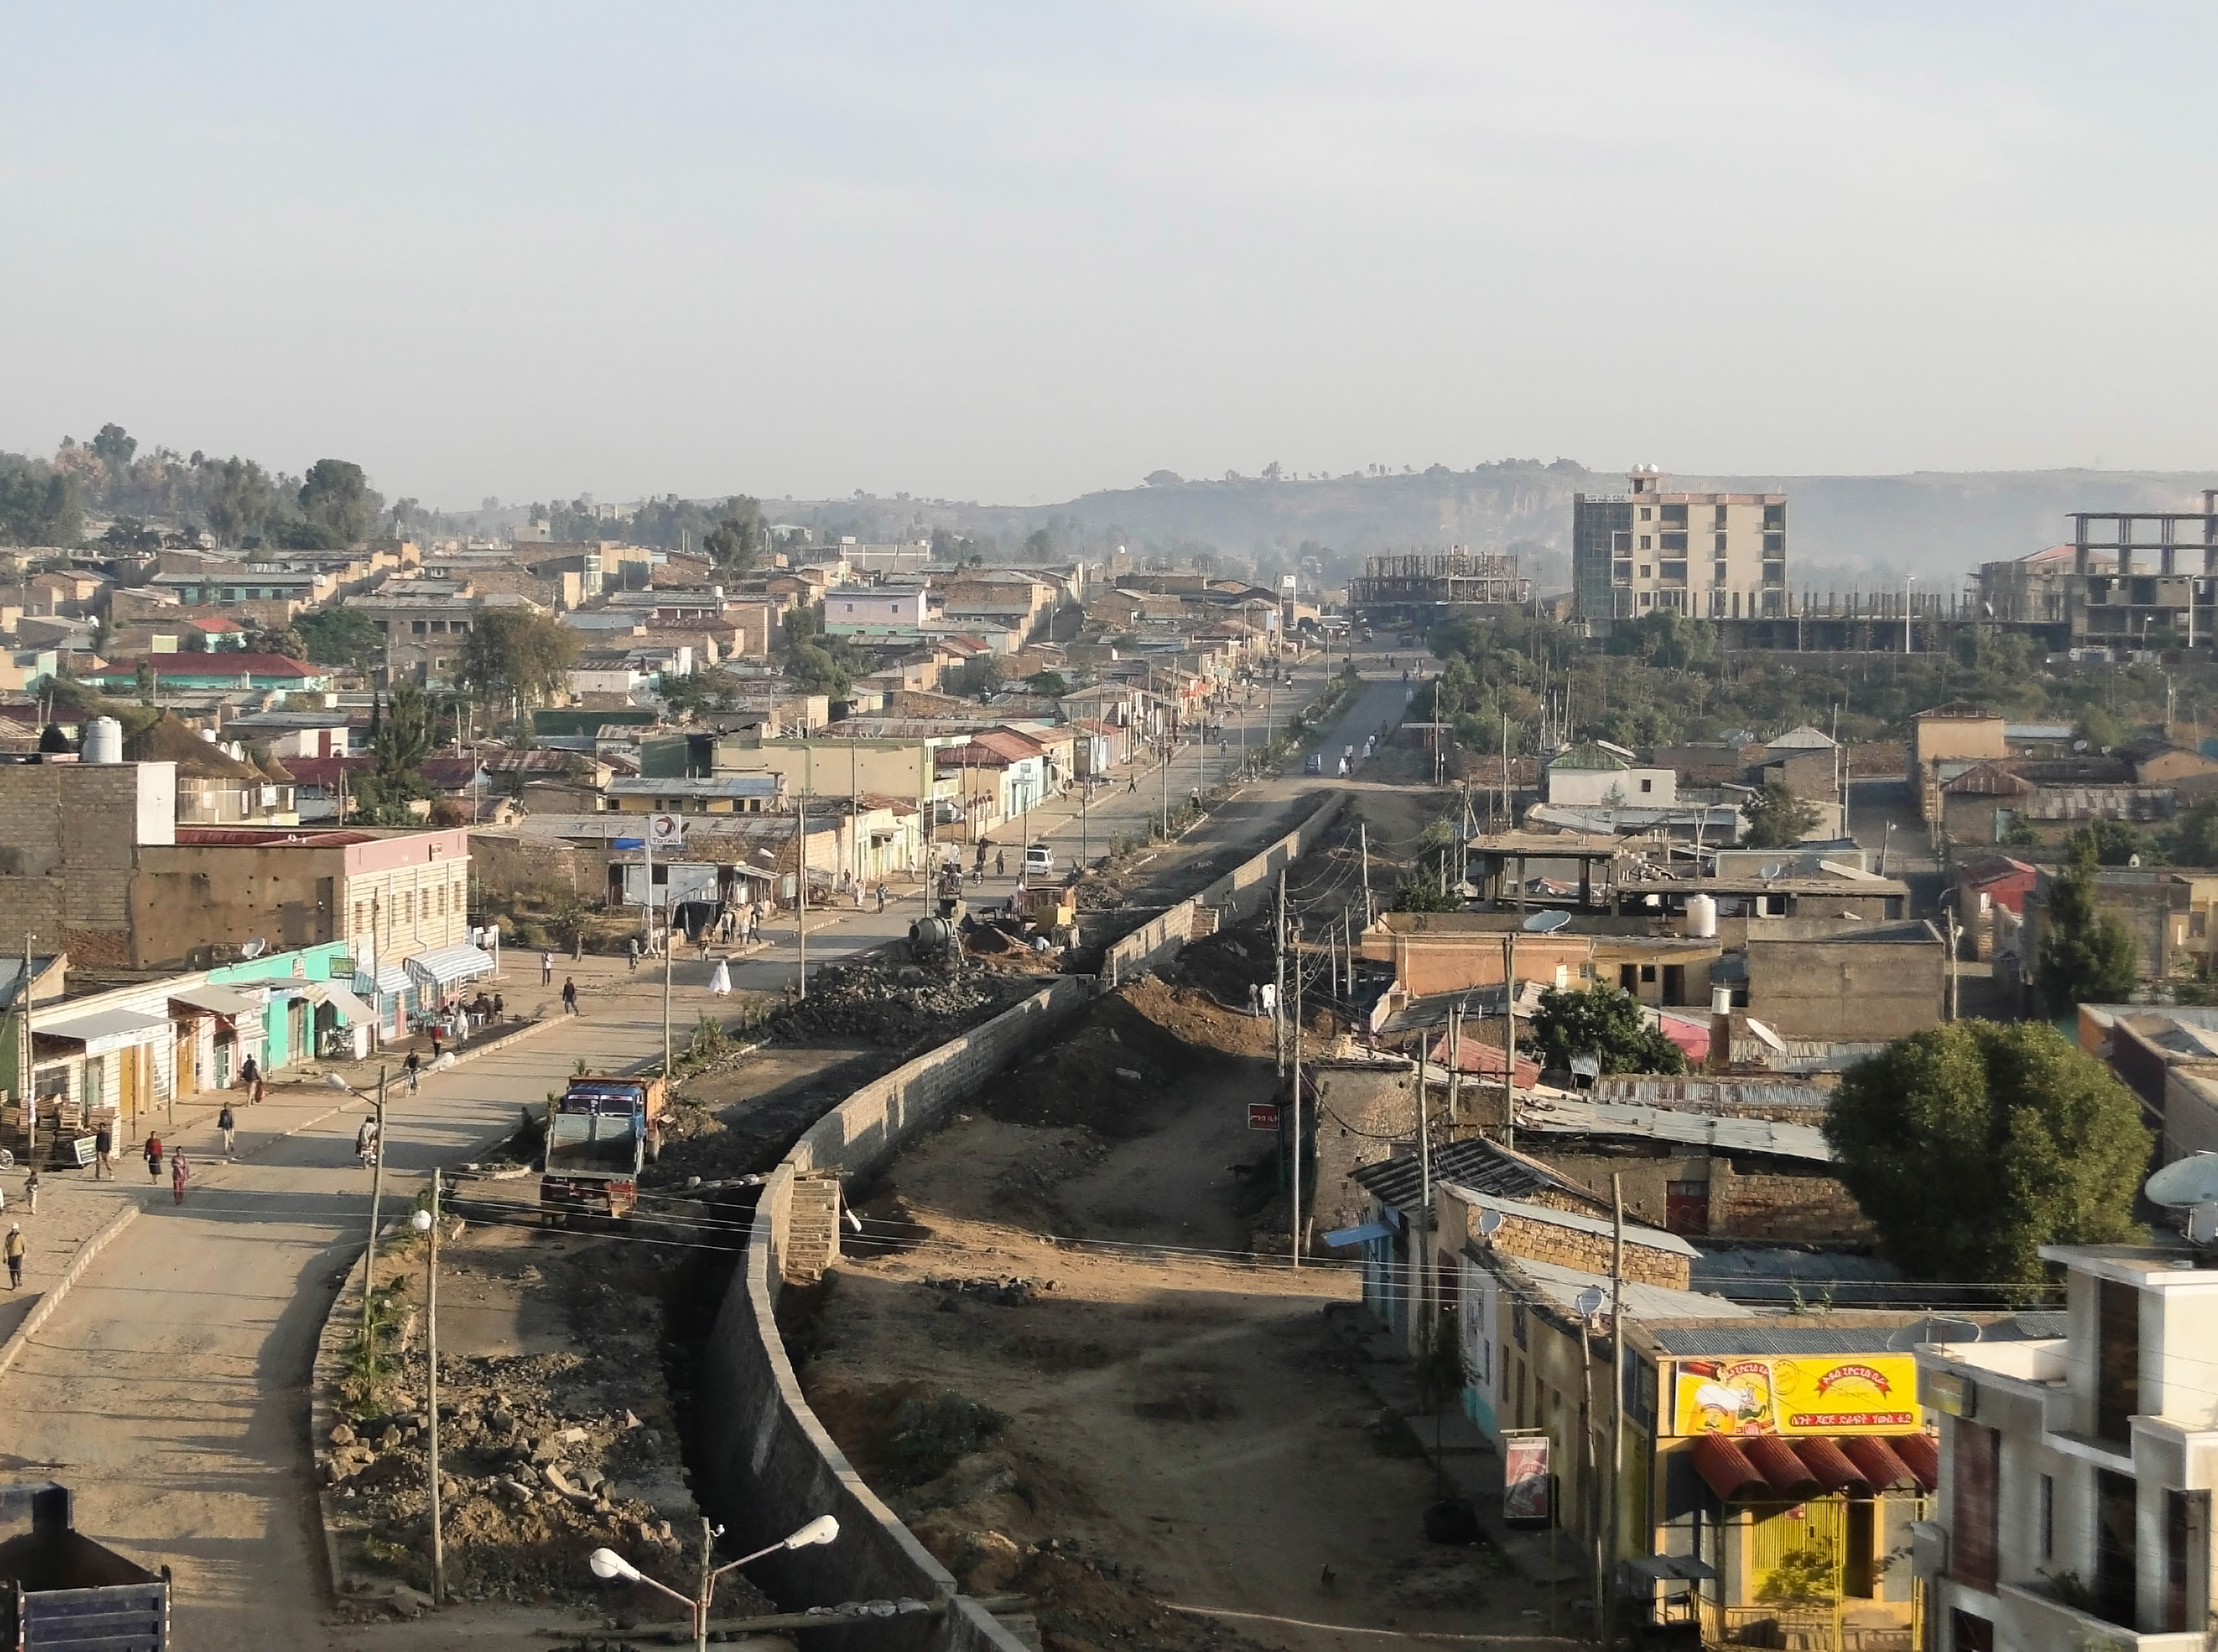
Wukro
Wukro (Ge'ez: ውቕሮ) (also known as Wukro Kilte Awulaelo; Ge'ez: ውቕሮ ክልተ ኣውላዕሎ) (also transliterated Wuqro; formerly known as Dongolo (Ge'ez: ዶንጎሎ) is a town and separate woreda in northern Ethiopia. It's located in the Misraqawi (Eastern) zone of the ..
Wukro Wikipedia Page


About Our Data
The data on this page is estimated using a number of publicly available tools and resources. It is provided without warranty, and could contain inaccuracies. Use at your own risk.