Categories in Nurmes
Industries
Business Distribution by Industry in Nurmes
| Industry Description | Number of Establishments | Average Age of Business |
|---|---|---|
| Forestry and logging | 81 | — |
| Buses and trains | 56 | — |
| Wholesale of construction supplies | 45 | 26 years |
| Car repair | 32 | 22 years |
| Corporate management | 31 | 27 years |
| Beauty salons | 27 | — |
| Real estate | 25 | — |
| Shopping | 25 | 39 years |
| Hardware store | 23 | — |
| Public administration | 23 | — |
| Restaurants | 22 | — |
| Agricultural wholesale | 22 | — |
| Health and medical | 21 | — |
Nurmes Facts
| Area | 1846.8 km² |
| Population | 8,225 |
| Male Population | 4,126 (50.2%) |
| Female Population | 4,099 (49.8%) |
| Population change (1975 to 2020) | -18.5% |
| Population change (2000 to 2020) | -8.4% |
| Median Age | 52.7 years (Male: 50.9, Female: 54.5) |
| Local Time | |
| Timezone | Eastern European Summer Time |
| Lat & Lng | 63.54205, 29.13965 |
| Postal Codes | 75500, 75501, 75530, 75531, 75650, More |
Map of Nurmes
Interactive Map
Nurmes Population
Years 1975 to 2020
| Data | 1975 | 1990 | 2000 | 2015 | 2020 |
|---|---|---|---|---|---|
| Population | 10,086 | 9,487 | 8,983 | 8,162 | 8,225 |
| Population Density | 5.5 / km² | 5.1 / km² | 4.9 / km² | 4.4 / km² | 4.5 / km² |
Nurmes Population change from 2000 to 2015
Decrease of 9.1% from year 2000 to 2015
| Location | Change since 1975 | Change since 1990 | Change since 2000 |
|---|---|---|---|
| Nurmes | -19.1% | -14% | -9.1% |
| North Karelia | -9.3% | -5.1% | -2.6% |
| Finland | +16.3% | +10.2% | +6.2% |
Nurmes Median Age
Median Age: 52.7 years
| Location | Median Age | Median Age (Female) | Median Age (Male) |
|---|---|---|---|
| Nurmes | 52.7 yrs | 54.5 yrs | 50.9 yrs |
| North Karelia | 46.5 yrs | 47.9 yrs | 45.2 yrs |
| Finland | 42.3 yrs | 44 yrs | 40.7 yrs |
Nurmes Population Density
Population Density: 4.5 / km²
| Location | Population | Area | Density |
|---|---|---|---|
| Nurmes | 8,225 | 1,846.8 km² | 4.5 / km² |
| North Karelia | 165,287 | 21,583.5 km² | 7.7 / km² |
| Finland | 5.3 million | 334,788.7 km² | 15.9 / km² |
Nurmes Historical and Projected Population
Estimated Population from 1100 to 2100
- JRC (European Commission's Joint Research Centre) work on the GHS built-up grid
- CIESIN (Center for International Earth Science Information Network)
- [Link] Klein Goldewijk, K., Beusen, A., Doelman, J., and Stehfest, E.: Anthropogenic land use estimates for the Holocene – HYDE 3.2, Earth Syst. Sci. Data, 9, 927–953, https://doi.org/10.5194/essd-9-927-2017, 2017.
Area Codes
Percentage Area Codes used by businesses in Nurmes
Postal Codes
Percentage of businesses by Postal Codes in Nurmes
Price Distribution
Business distribution by price for Nurmes
Human Development Index (HDI)
Statistic composite index of life expectancy, education, and per capita income.
Nurmes CO2 Emissions
Carbon Dioxide (CO2) Emissions Per Capita in Tonnes Per Year
| Location | CO2 Emissions | CO2 Emissions Per Capita | CO2 Emissions Intensity |
|---|---|---|---|
| Nurmes | 78,132 tn | 9.5 tn | 42.3 tons/km² |
| North Karelia | 1,571,414 tn | 9.51 tn | 72.8 tons/km² |
| Finland | 54,177,521 tn | 10.19 tn | 161.8 tons/km² |
| 2013 CO2 emissions (tonnes/year) | 78,132 tn |
| 2013 CO2 emissions (tonnes/year) per capita | 9.5 tn |
| 2013 CO2 emissions intensity (tonnes/km²/year) | 42.3 tons/km² |
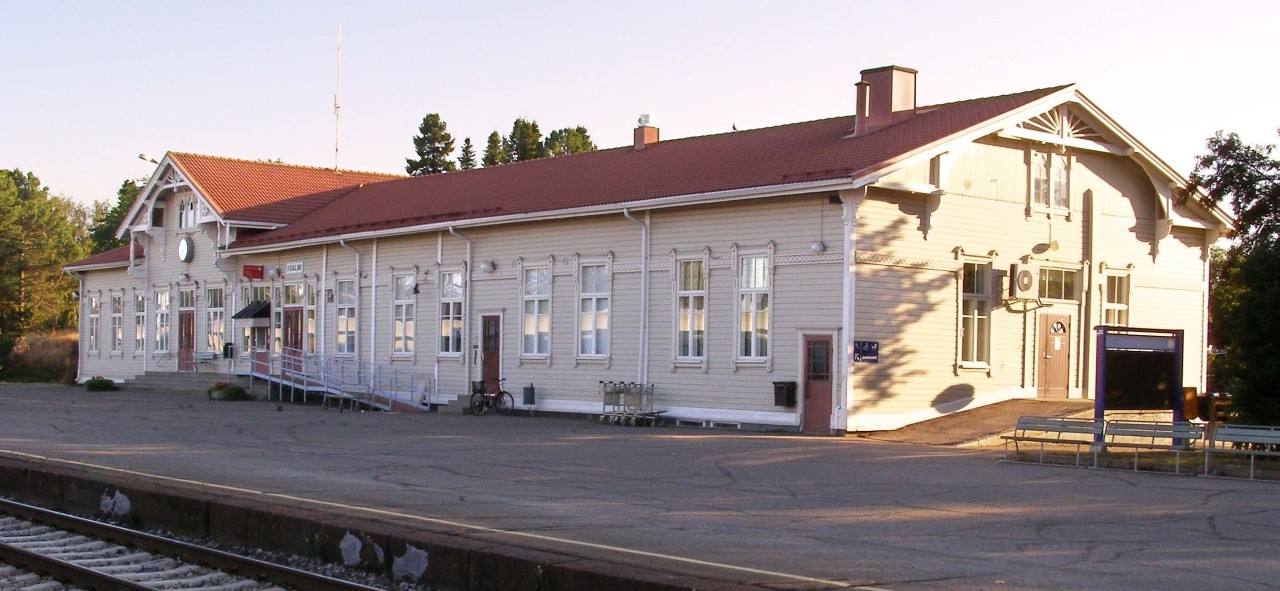
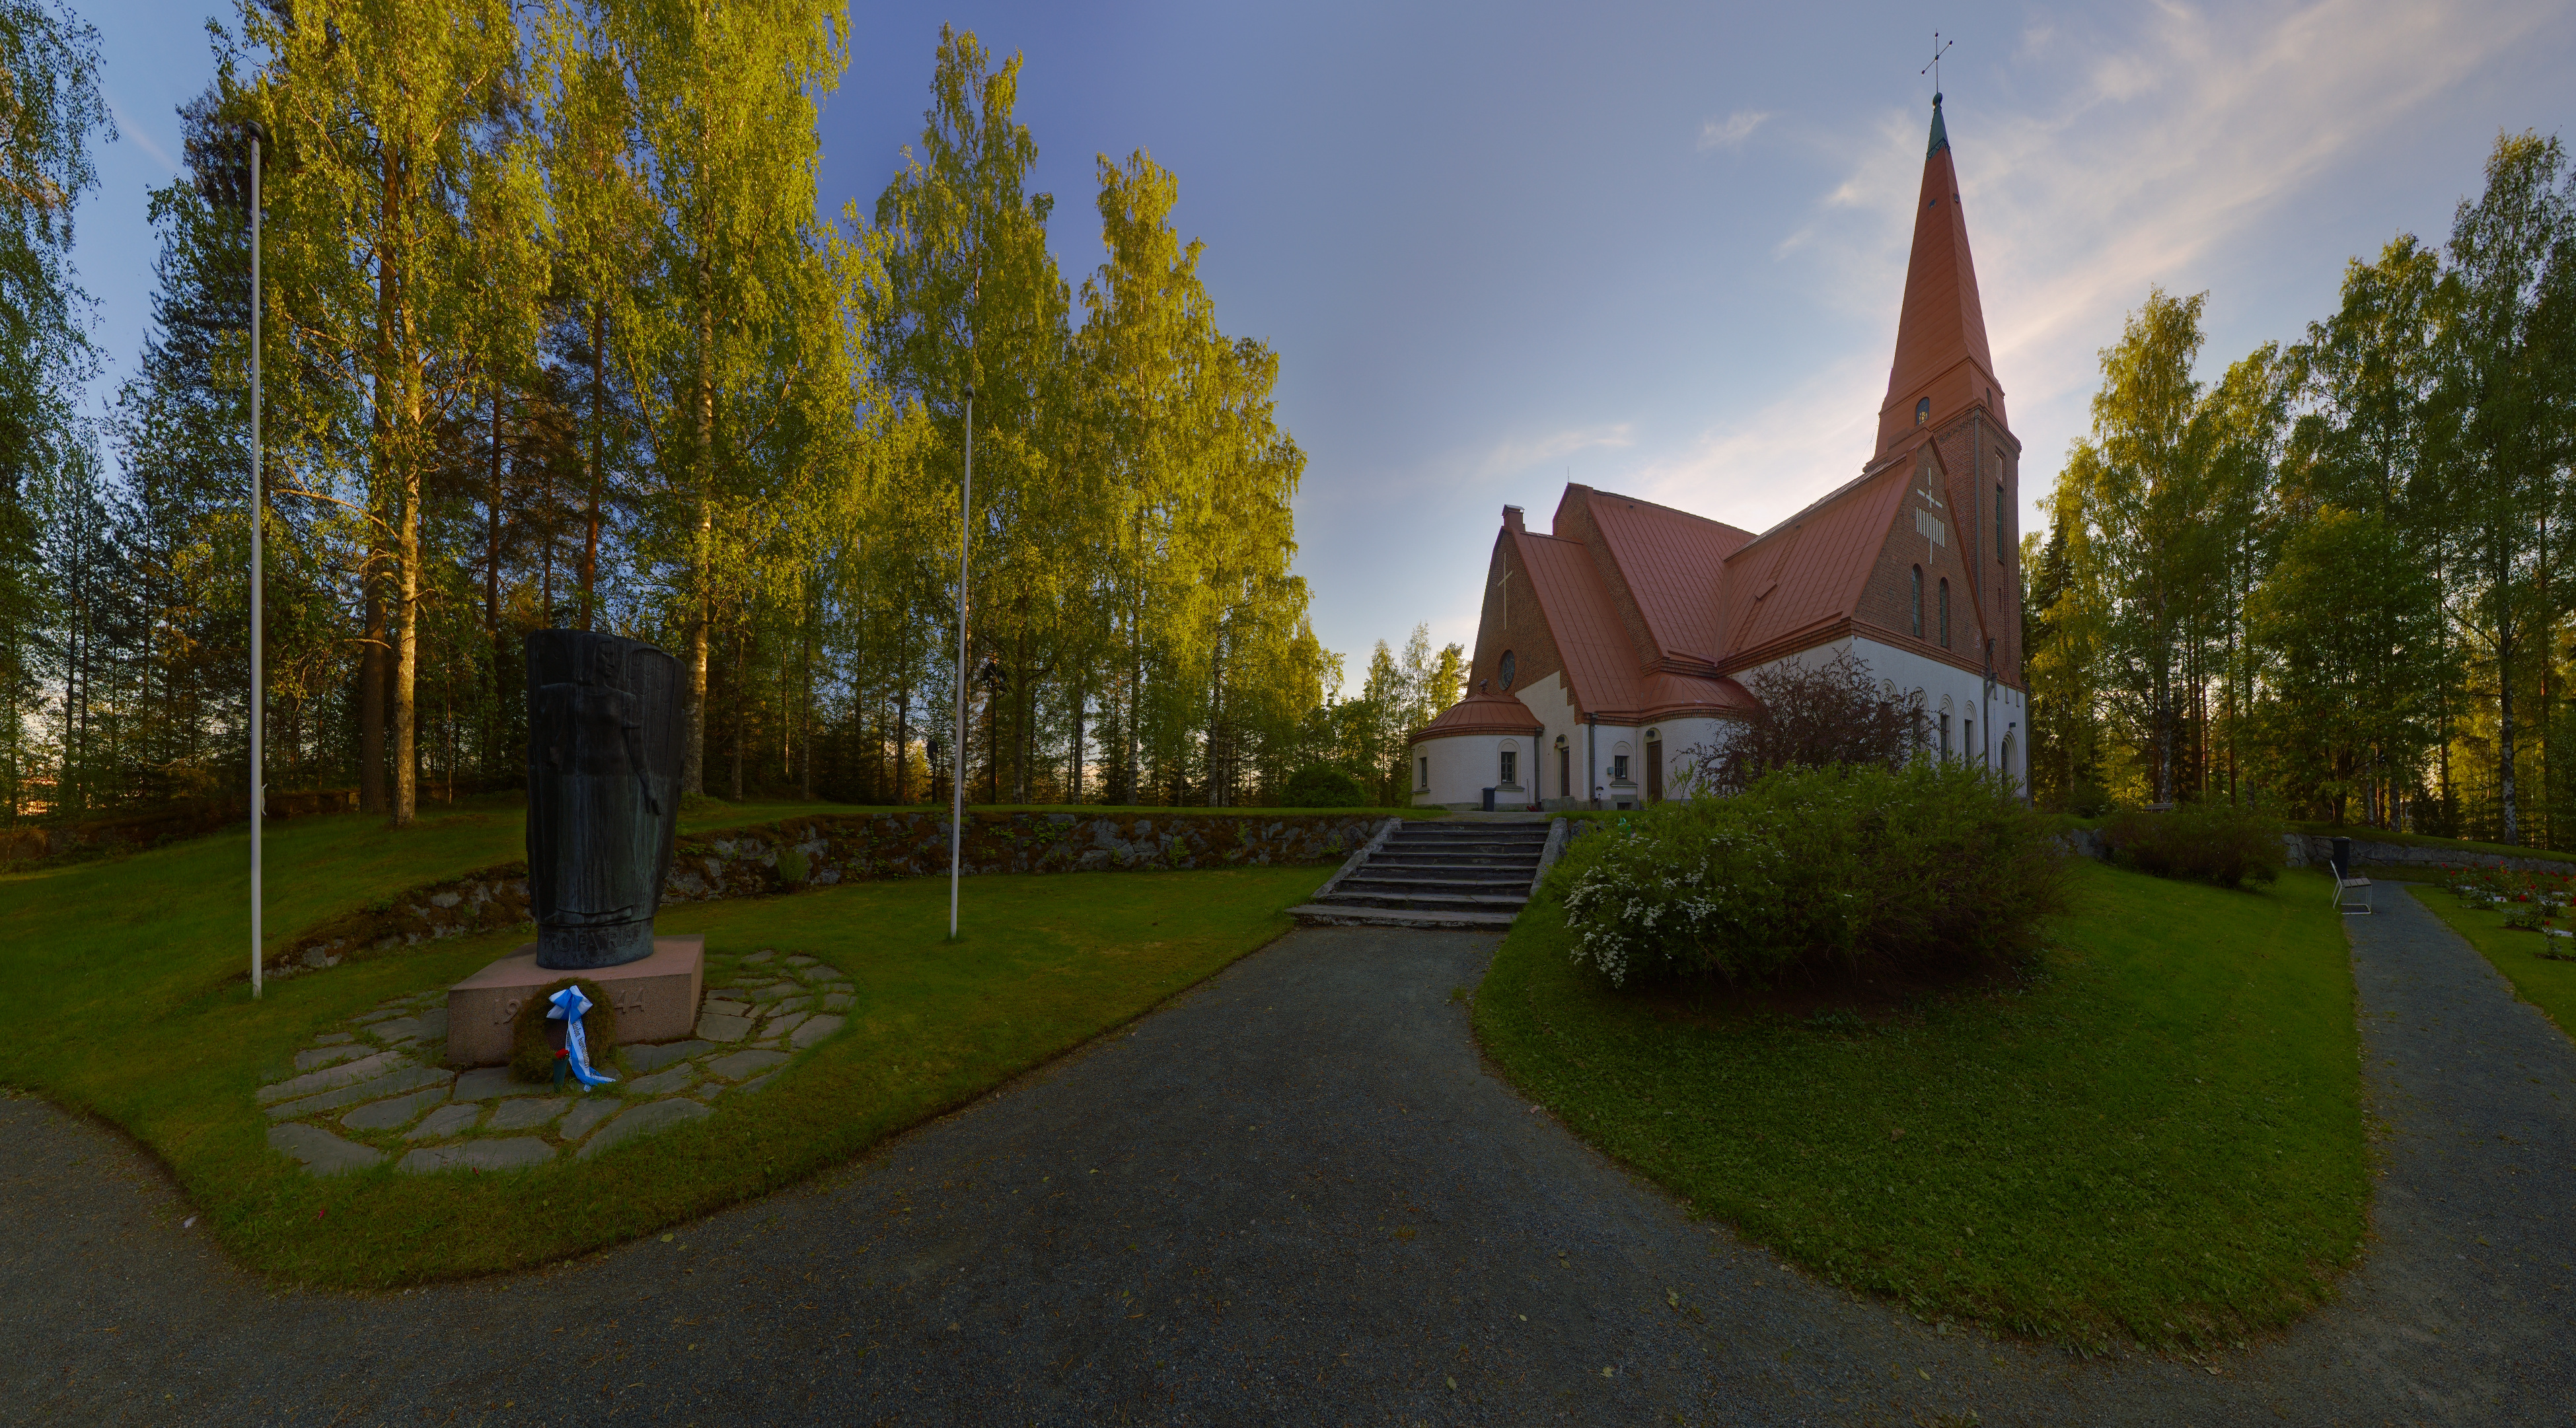
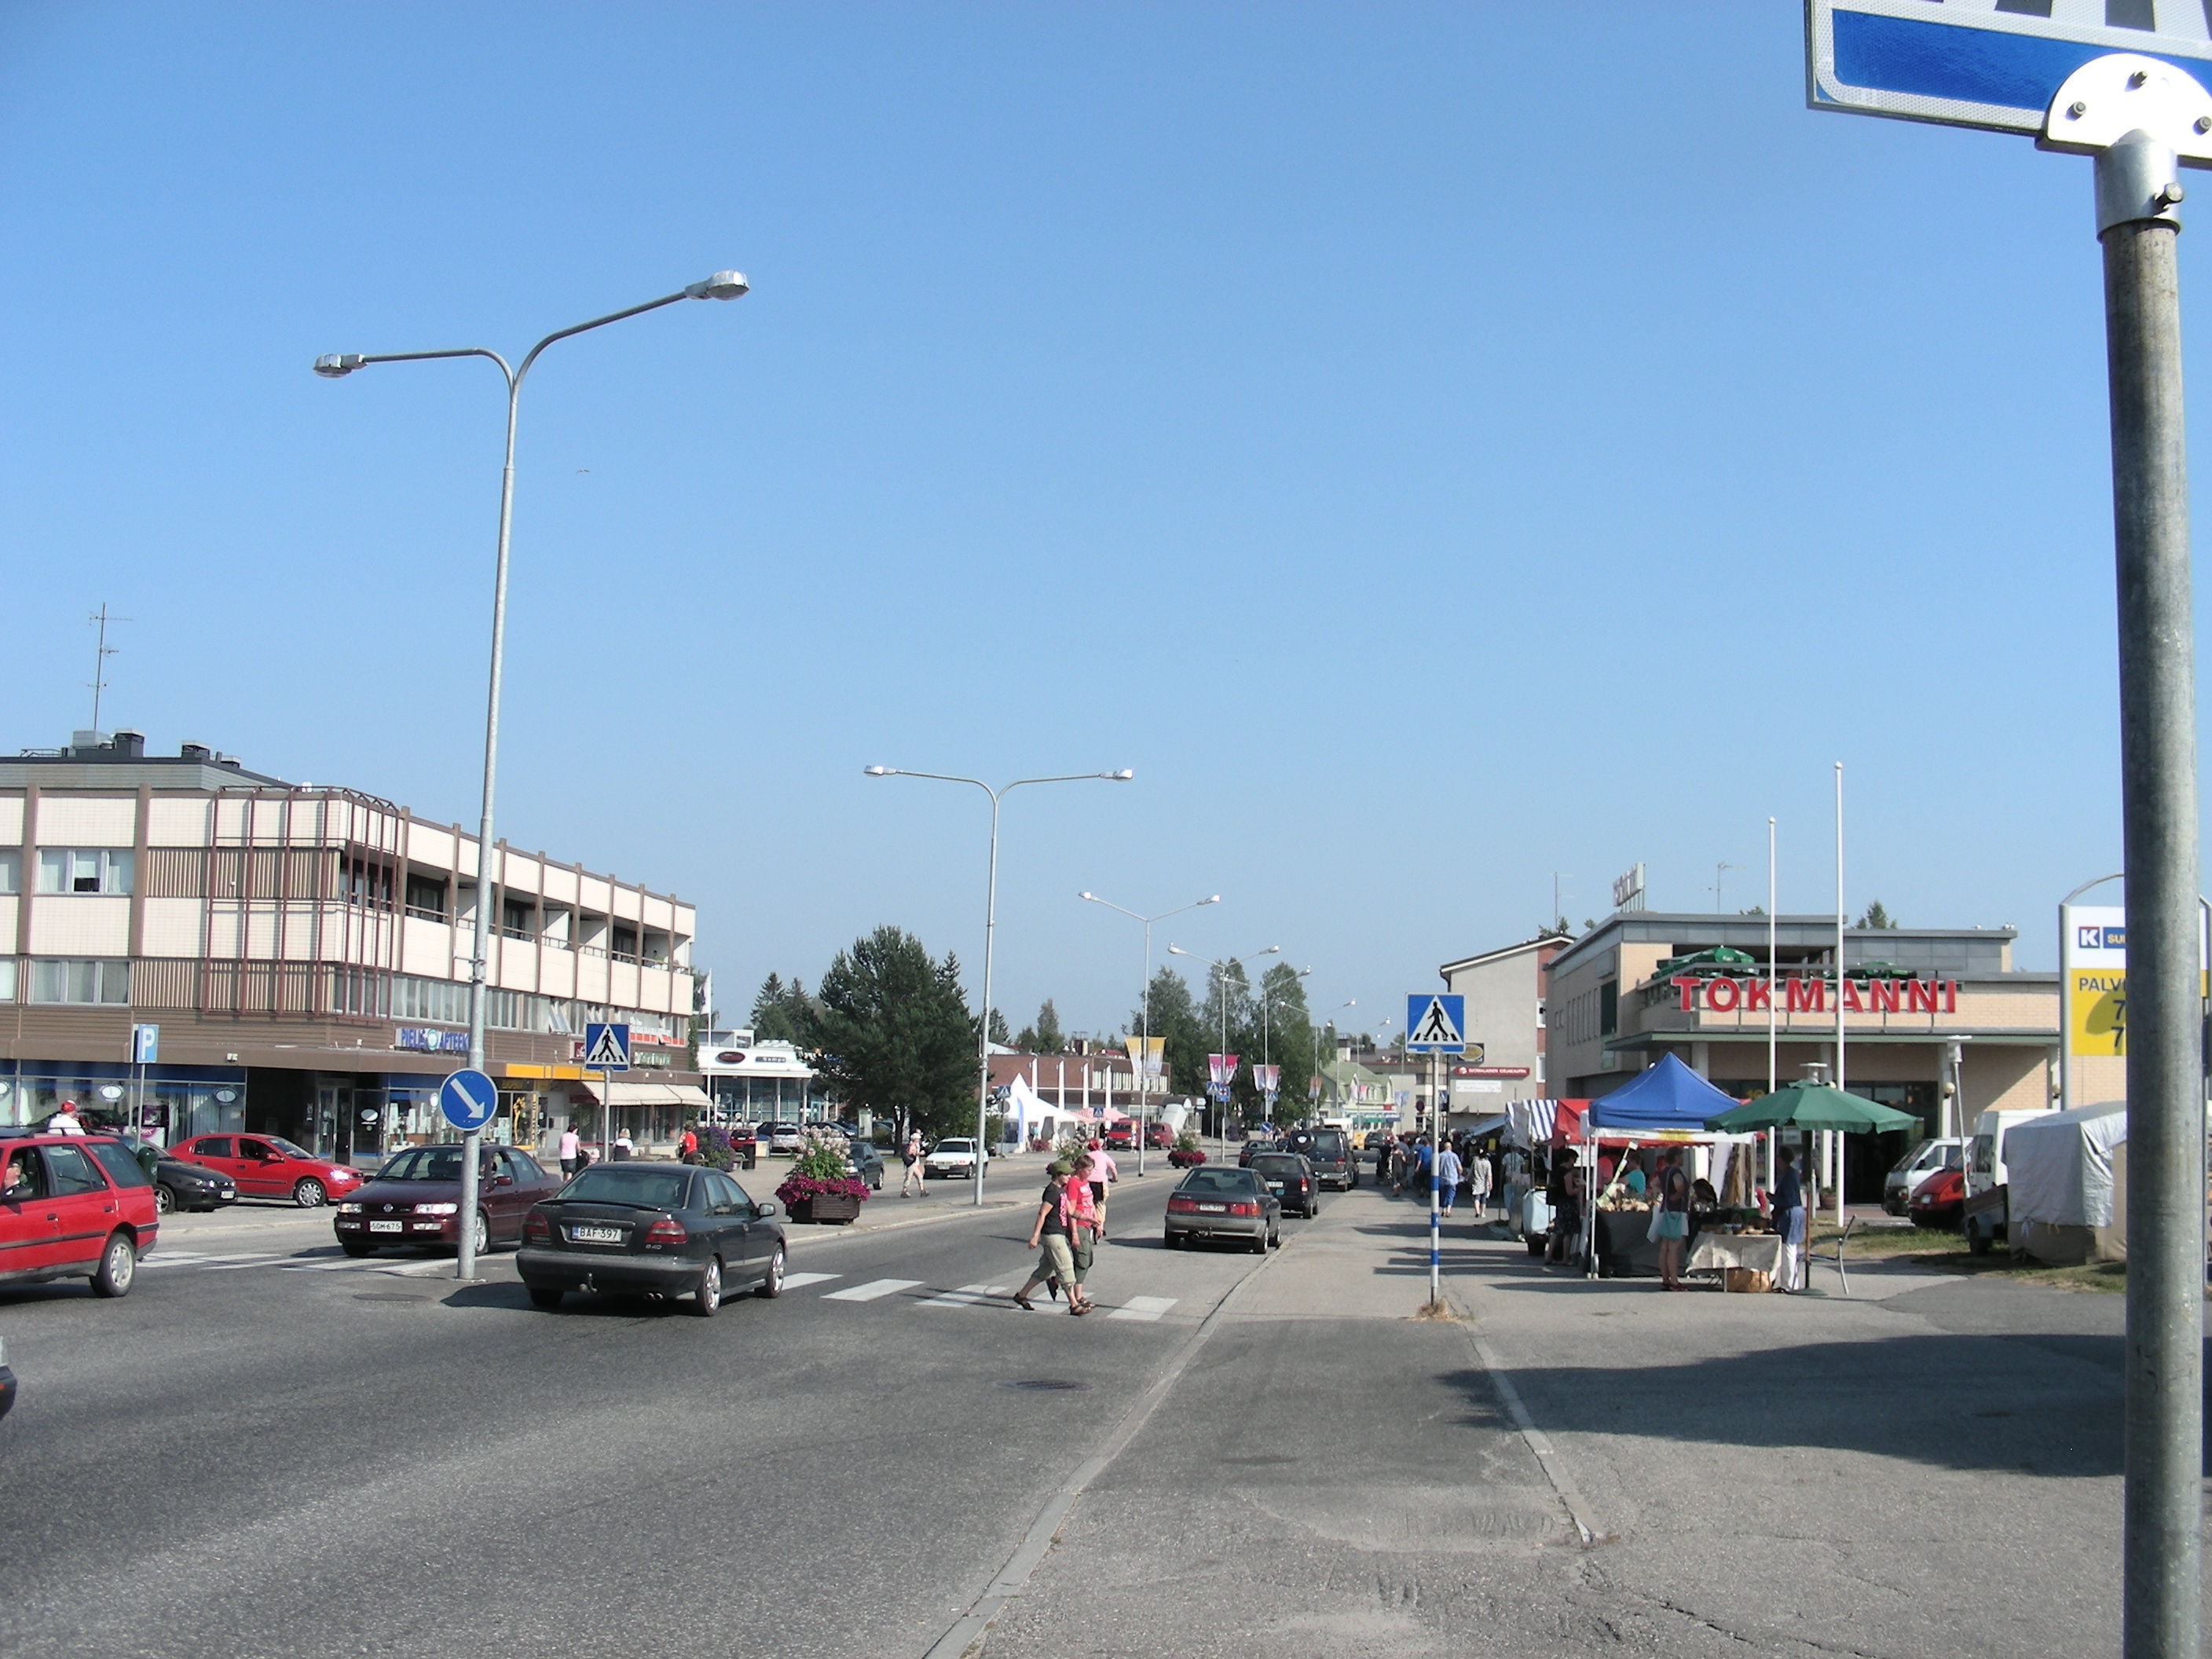
Nurmes
Nurmes is a town and municipality of Finland. was located in the former province of Eastern Finland until 2010 and is now in the North Karelia region. The town has a population of 8,046 (30 June 2015) and covers an area of 1,854.79 square kilometres..
Nurmes Wikipedia Page
About Our Data
The data on this page is estimated using a number of publicly available tools and resources. It is provided without warranty, and could contain inaccuracies. Use at your own risk.