Categories in Salla
Industries
Business Distribution by Industry in Salla
| Industry Description | Number of Establishments | Average Age of Business |
|---|---|---|
| Forestry and logging | 72 | — |
| Other accommodation | 19 | — |
| Real estate | 17 | — |
| Wholesale of construction supplies | 15 | 25 years |
| Restaurants | 13 | — |
| Travel and transportation | 13 | — |
| Buses and trains | 13 | — |
| Health and medical | 11 | — |
Map of Salla
Interactive Map
Salla Population
Years 1975 to 2020
| Data | 1975 | 1990 | 2000 | 2015 | 2020 |
|---|---|---|---|---|---|
| Population | 5,776 | 3,851 | 3,019 | 2,009 | 2,009 |
| Population Density | 1,777.2 / km² | 1,184.9 / km² | 928.9 / km² | 618.2 / km² | 618.2 / km² |
Salla Population change from 2000 to 2015
Decrease of 33.5% from year 2000 to 2015
| Location | Change since 1975 | Change since 1990 | Change since 2000 |
|---|---|---|---|
| Salla | -65.2% | -47.8% | -33.5% |
| Lapland (Finland) | -13.4% | -8.4% | -4.9% |
| Finland | +16.3% | +10.2% | +6.2% |
Salla Population Density
Population Density: 618 / km²
| Location | Population | Area | Density |
|---|---|---|---|
| Salla | 2,009 | 3.25 km² | 618 / km² |
| Lapland (Finland) | 183,341 | 100,364.5 km² | 1.8 / km² |
| Finland | 5.3 million | 334,788.7 km² | 15.9 / km² |
Salla Historical and Projected Population
Estimated Population from 1200 to 2100
- JRC (European Commission's Joint Research Centre) work on the GHS built-up grid
- CIESIN (Center for International Earth Science Information Network)
- [Link] Klein Goldewijk, K., Beusen, A., Doelman, J., and Stehfest, E.: Anthropogenic land use estimates for the Holocene – HYDE 3.2, Earth Syst. Sci. Data, 9, 927–953, https://doi.org/10.5194/essd-9-927-2017, 2017.
Area Codes
Percentage Area Codes used by businesses in Salla
Price Distribution
Business distribution by price for Salla
Human Development Index (HDI)
Statistic composite index of life expectancy, education, and per capita income.
Salla CO2 Emissions
Carbon Dioxide (CO2) Emissions Per Capita in Tonnes Per Year
| Location | CO2 Emissions | CO2 Emissions Per Capita | CO2 Emissions Intensity |
|---|---|---|---|
| Salla | 19,419 tn | 9.67 tn | 5,975 tons/km² |
| Lapland (Finland) | 1,756,212 tn | 9.58 tn | 17.5 tons/km² |
| Finland | 54,177,521 tn | 10.19 tn | 161.8 tons/km² |
| 2013 CO2 emissions (tonnes/year) | 19,419 tn |
| 2013 CO2 emissions (tonnes/year) per capita | 9.67 tn |
| 2013 CO2 emissions intensity (tonnes/km²/year) | 5,975 tons/km² |
Recent Nearby Earthquakes
Magnitude 3.0 and greater
| Date▼ | Time↕ | Magnitude↕ | Distance↕ | Depth↕ | Location↕ | Link |
|---|---|---|---|---|---|---|
| 2/1/92 | 11:46 AM | 3 | 81.8 km | 10,000 m | northwestern Russia | usgs.gov |
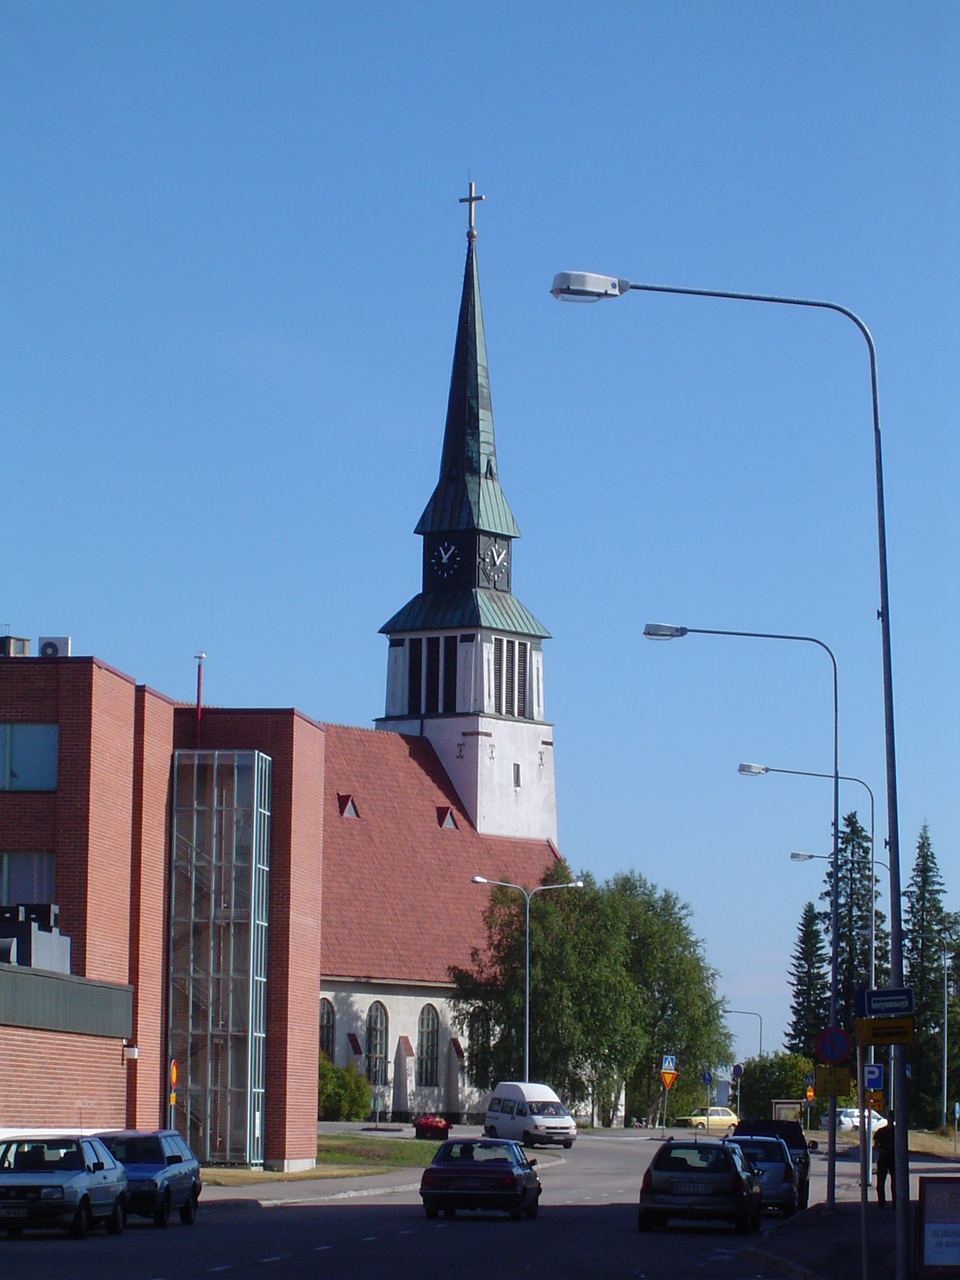
Salla
Salla (Kuolajärvi until 1936) is a municipality of Finland, located in Lapland. The municipality has a population of 3,758 (30 June 2015) and covers an area of 5,872.21 square kilometres (2,267.27 sq mi) of which 142.73 km2 (55.11 sq mi) is water. Th..
Salla Wikipedia Page

About Our Data
The data on this page is estimated using a number of publicly available tools and resources. It is provided without warranty, and could contain inaccuracies. Use at your own risk.