Categories in Belfort
Industries
Business Distribution by Industry in Belfort
| Industry Description | Number of Establishments | Average Age of Business |
|---|---|---|
| Restaurants | 327 | 19 years |
| Shopping | 233 | 21 years |
| Corporate management | 231 | 22 years |
| Health and medical | 186 | 33 years |
| Real estate | 153 | 25 years |
| Beauty salons | 126 | 13 years |
| Public administration | 111 | 45 years |
| Clothing stores | 110 | 18 years |
| Lawyers legal | 105 | 27 years |
| Education | 105 | 41 years |
| Hairdressers | 100 | 22 years |
| Other membership organizations | 91 | 45 years |
| Car repair | 80 | 17 years |
| Shopping other | 78 | 24 years |
| All food and beverage | 76 | 17 years |
Belfort Facts
| Area | 17.1 km² |
| Population | 48,470 |
| Male Population | 24,527 (50.6%) |
| Female Population | 23,943 (49.4%) |
| Population change (1975 to 2020) | -3.4% |
| Population change (2000 to 2020) | +0.2% |
| Median Age | 35 years (Male: 32.6, Female: 38.3) |
| Neighborhoods | Place de la Réunion, Rebberg, Bretagne, Fonderie |
| Local Time | |
| Timezone | Central European Summer Time |
| Lat & Lng | 47.63333, 6.86667 |
| Postal Codes | 90000, 90001 CEDEX, 90002 CEDEX, 90003 CEDEX, 90004 CEDEX, More |
Map of Belfort
Interactive Map
Belfort Population
Years 1975 to 2020
| Data | 1975 | 1990 | 2000 | 2015 | 2020 |
|---|---|---|---|---|---|
| Population | 50,154 | 49,320 | 48,366 | 46,902 | 48,470 |
| Population Density | 2,939.4 / km² | 2,890.5 / km² | 2,834.6 / km² | 2,748.8 / km² | 2,840.7 / km² |
Belfort Population change from 2000 to 2015
Decrease of 3% from year 2000 to 2015
| Location | Change since 1975 | Change since 1990 | Change since 2000 |
|---|---|---|---|
| Belfort | -6.5% | -4.9% | -3% |
| France | +22.7% | +13.8% | +8.8% |
Belfort Median Age
Median Age: 35 years
| Location | Median Age | Median Age (Female) | Median Age (Male) |
|---|---|---|---|
| Belfort | 35 yrs | 38.3 yrs | 32.6 yrs |
| France | 39.6 yrs | 41 yrs | 38.1 yrs |
Belfort Population Density
Population Density: 2,841 / km²
| Location | Population | Area | Density |
|---|---|---|---|
| Belfort | 48,470 | 17.1 km² | 2,841 / km² |
| France | 65.9 million | 638,022.5 km² | 103 / km² |
Belfort Historical and Projected Population
Estimated Population from 0 to 2100
- JRC (European Commission's Joint Research Centre) work on the GHS built-up grid
- CIESIN (Center for International Earth Science Information Network)
- [Link] Klein Goldewijk, K., Beusen, A., Doelman, J., and Stehfest, E.: Anthropogenic land use estimates for the Holocene – HYDE 3.2, Earth Syst. Sci. Data, 9, 927–953, https://doi.org/10.5194/essd-9-927-2017, 2017.
Area Codes
Percentage Area Codes used by businesses in Belfort
Price Distribution
Business distribution by price for Belfort
Human Development Index (HDI)
Statistic composite index of life expectancy, education, and per capita income.
Belfort CO2 Emissions
Carbon Dioxide (CO2) Emissions Per Capita in Tonnes Per Year
| Location | CO2 Emissions | CO2 Emissions Per Capita | CO2 Emissions Intensity |
|---|---|---|---|
| Belfort | 382,287 tn | 7.89 tn | 22,405.1 tons/km² |
| France | 485,797,691 tn | 7.38 tn | 761.4 tons/km² |
| 2013 CO2 emissions (tonnes/year) | 382,287 tn |
| 2013 CO2 emissions (tonnes/year) per capita | 7.89 tn |
| 2013 CO2 emissions intensity (tonnes/km²/year) | 22,405.1 tons/km² |
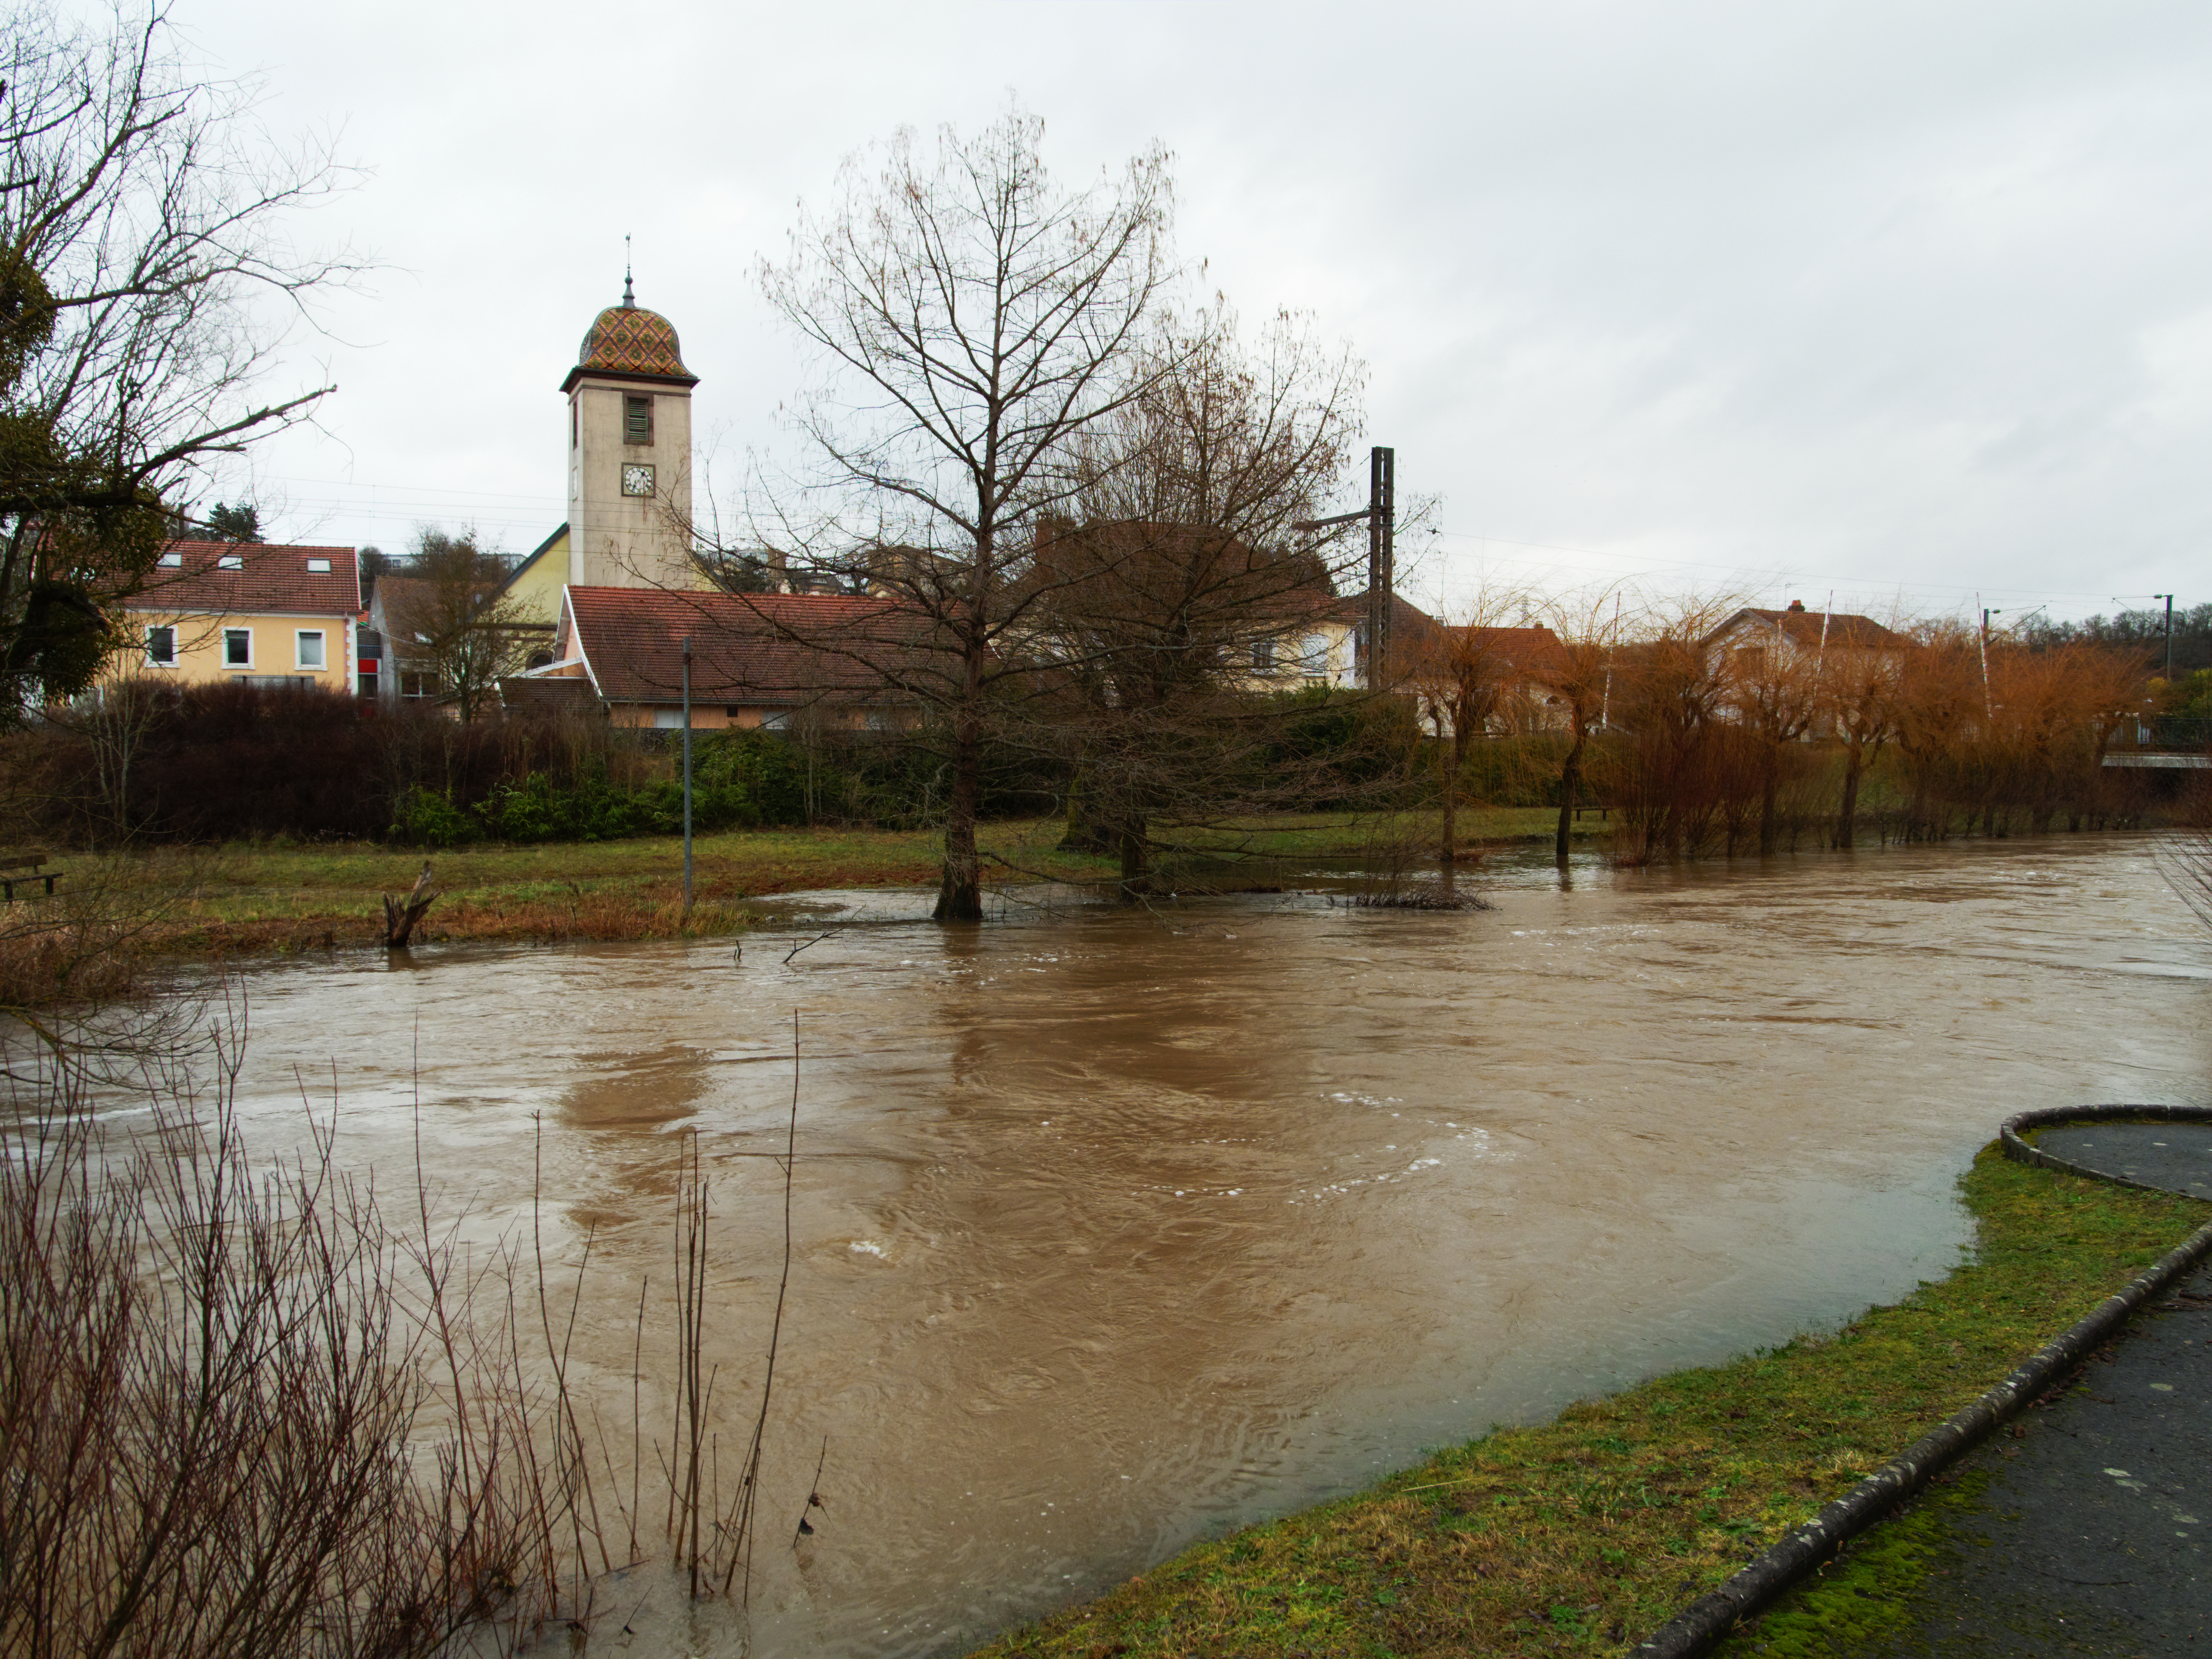
Natural Hazards Risk
Relative risk out of 10
| Hazard | Risk Level |
|---|---|
| Flood | Medium (7) |
| Earthquake | Low (2) |
* Risk, particularly concerning flood or landslide, may not be for the entire area.
- Dilley, M., R.S. Chen, U. Deichmann, A.L. Lerner-Lam, M. Arnold, J. Agwe, P. Buys, O. Kjekstad, B. Lyon, and G. Yetman. 2005. Natural Disaster Hotspots: A Global Risk Analysis. Washington, D.C.: World Bank. https://doi.org/10.1596/0-8213-5930-4.
- Center for Hazards and Risk Research - CHRR - Columbia University, Center for International Earth Science Information Network - CIESIN - Columbia University. 2005. Global Flood Hazard Frequency and Distribution. Palisades, NY: NASA Socioeconomic Data and Applications Center (SEDAC). https://doi.org/10.7927/H4668B3D.
- Center for Hazards and Risk Research - CHRR - Columbia University, Center for International Earth Science Information Network - CIESIN - Columbia University. 2005. Global Earthquake Hazard Distribution - Peak Ground Acceleration. Palisades, NY: NASA Socioeconomic Data and Applications Center (SEDAC). https://doi.org/10.7927/H4BZ63ZS.
Recent Nearby Earthquakes
Magnitude 3.0 and greater
| Date▼ | Time↕ | Magnitude↕ | Distance↕ | Depth↕ | Location↕ | Link |
|---|---|---|---|---|---|---|
| 5/4/18 | 9:36 PM | 3.1 | 52.5 km | 15,230 m | 2km W of Schliengen, Germany | usgs.gov |
| 3/21/07 | 4:45 PM | 3.1 | 53.2 km | 8,000 m | Switzerland | usgs.gov |
| 1/15/07 | 6:23 AM | 3.2 | 46.1 km | 16,000 m | France | usgs.gov |
| 3/29/06 | 9:49 AM | 3.6 | 79.3 km | 4,000 m | Switzerland | usgs.gov |
| 3/16/05 | 3:41 AM | 3.1 | 27.8 km | 8,000 m | Switzerland | usgs.gov |
| 1/19/05 | 2:46 PM | 3.1 | 40.1 km | 5,000 m | Switzerland | usgs.gov |
| 7/28/04 | 4:25 PM | 3 | 42.1 km | 4,000 m | France | usgs.gov |
| 7/27/04 | 11:05 PM | 3.2 | 41.8 km | 3,000 m | France | usgs.gov |
| 2/23/04 | 5:31 PM | 4.4 | 60.3 km | 17,400 m | France | usgs.gov |
| 2/16/04 | 9:58 AM | 3.5 | 78.3 km | 12,000 m | France | usgs.gov |
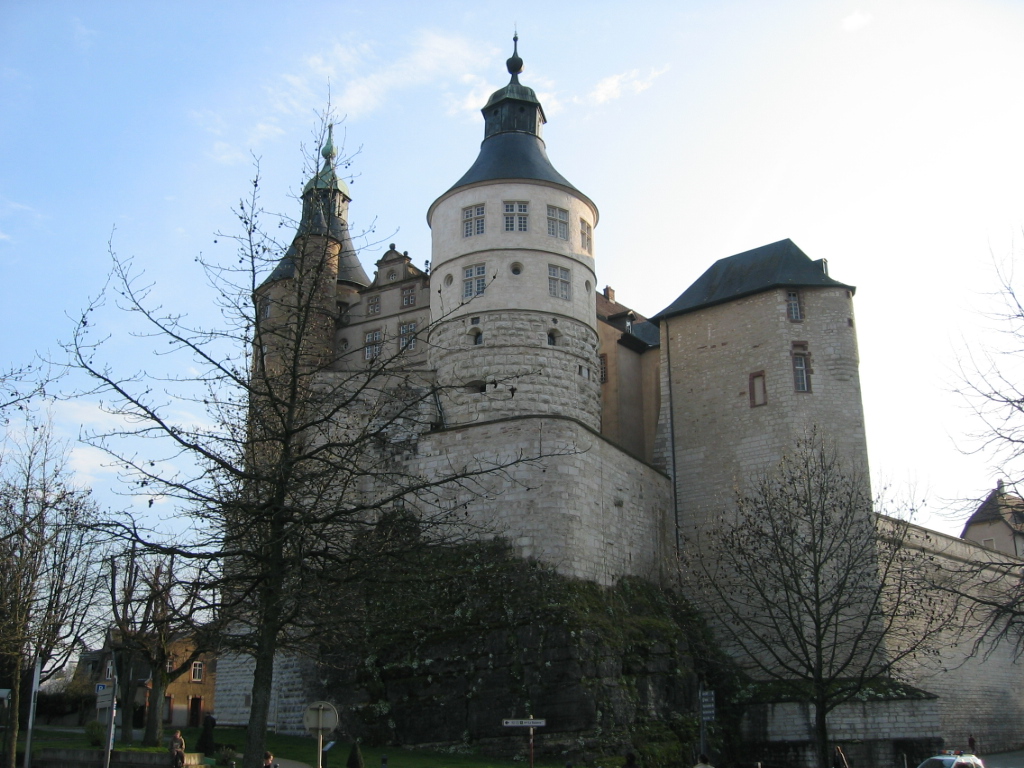
Belfort
Belfort [French pronunciation: [bɛl.fɔʁ]] (German: Beffert) is a city in northeastern France in the Franche-Comté région, situated between Lyon and Strasbourg. It is the biggest town and the administrative town of the Territoire de Belfort départeme..
Belfort Wikipedia Page

About Our Data
The data on this page is estimated using a number of publicly available tools and resources. It is provided without warranty, and could contain inaccuracies. Use at your own risk.