Categories in Cestas
Alternative Fuel StationAuto Machine ShopAuto Tune Up ServiceBody repairCar rentalCar repairCar Repair and MaintenanceCar WashGas StationMechanicNew car dealersUsed car dealersBoiler ManufacturerCrop GrowerHandicraftIndustrial Equipment SupplierMachine ShopMetal WorkshopSolar Energy Equipment SupplierWholesalersClothing storesDry CleanerLaundromatAssociation or OrganizationCity or Town HallCouncilCultural AssociationGovernment OfficePost OfficeRetirement HomeSalvage YardShipping and Mailing ServiceShipping ServiceVolunteer OrganizationWaste Management ServiceComputer ConsultantComputer Repair ServiceComputer Support and ServicesSoftware CompanyAir-conditioning installation and repairArchitectsBuilding Construction ContractorBuilding Materials StoreCarpenterConstruction of buildingsContractorCustom Home BuilderDeck BuilderDry Wall ContractorElectrical Installation Service
Showing 1-50 of 195
…
Industries
Business Distribution by Industry in Cestas
| Industry Description | Number of Establishments | Average Age of Business |
|---|---|---|
| Corporate management | 85 | 25 years |
| Health and medical | 79 | — |
| Shopping | 68 | 23 years |
| Restaurants | 57 | 13 years |
| Car repair | 56 | 18 years |
| Real estate | 52 | 20 years |
| Other construction | 41 | 27 years |
| Nurses | 37 | — |
| Public administration | 33 | 27 years |
| Shopping other | 33 | 19 years |
| Beauty salons | 31 | — |
| Alternative medicine | 31 | — |
| Electrical installation | 29 | — |
| Travel and transportation | 26 | 14 years |
Cestas Facts
| Area | 99.2 km² |
| Population | 16,188 |
| Male Population | 7,815 (48.3%) |
| Female Population | 8,373 (51.7%) |
| Population change (1975 to 2020) | -12.5% |
| Population change (2000 to 2020) | -4.5% |
| Median Age | 45.7 years (Male: 44.8, Female: 46.5) |
| Neighborhoods | Magonty, Bègles, Eysines, Pessac, Blanquefort |
| Local Time | |
| Timezone | Central European Summer Time |
| Lat & Lng | 44.74345, -0.67905 |
| Postal Codes | 33610, 33611 CEDEX, 33612 CEDEX, 33613 CEDEX, 33614 CEDEX, More |
Map of Cestas
Interactive Map
Cestas Population
Years 1975 to 2020
| Data | 1975 | 1990 | 2000 | 2015 | 2020 |
|---|---|---|---|---|---|
| Population | 18,492 | 17,754 | 16,943 | 15,778 | 16,188 |
| Population Density | 186.4 / km² | 179 / km² | 170.8 / km² | 159.1 / km² | 163.2 / km² |
Sources: JRC (European Commission's Joint Research Centre) work on the GHS built-up grid
Cestas Population change from 2000 to 2015
Decrease of 6.9% from year 2000 to 2015
| Location | Change since 1975 | Change since 1990 | Change since 2000 |
|---|---|---|---|
| Cestas | -14.7% | -11.1% | -6.9% |
| France | +22.7% | +13.8% | +8.8% |
Sources: JRC (European Commission's Joint Research Centre) work on the GHS built-up grid
Cestas Median Age
Median Age: 45.7 years
| Location | Median Age | Median Age (Female) | Median Age (Male) |
|---|---|---|---|
| Cestas | 45.7 yrs | 46.5 yrs | 44.8 yrs |
| France | 39.6 yrs | 41 yrs | 38.1 yrs |
Sources: CIESIN (Center for International Earth Science Information Network)
Cestas Population Density
Population Density: 163 / km²
| Location | Population | Area | Density |
|---|---|---|---|
| Cestas | 16,188 | 99.2 km² | 163 / km² |
| France | 65.9 million | 638,022.5 km² | 103 / km² |
Sources: JRC (European Commission's Joint Research Centre) work on the GHS built-up grid
Cestas Historical and Projected Population
Estimated Population from 0 to 2100
Sources:
- JRC (European Commission's Joint Research Centre) work on the GHS built-up grid
- CIESIN (Center for International Earth Science Information Network)
- [Link] Klein Goldewijk, K., Beusen, A., Doelman, J., and Stehfest, E.: Anthropogenic land use estimates for the Holocene – HYDE 3.2, Earth Syst. Sci. Data, 9, 927–953, https://doi.org/10.5194/essd-9-927-2017, 2017.
Area Codes
Percentage Area Codes used by businesses in Cestas
Price Distribution
Business distribution by price for Cestas
Human Development Index (HDI)
Statistic composite index of life expectancy, education, and per capita income.
Source: [Link] Kummu, M., Taka, M. &Guillaume, J. Gridded global datasets for Gross Domestic Product and Human Development Index over 1990–2015. Sci Data 5, 180004 (2018) doi:10.1038/sdata.2018.4
Cestas CO2 Emissions
Carbon Dioxide (CO2) Emissions Per Capita in Tonnes Per Year
| Location | CO2 Emissions | CO2 Emissions Per Capita | CO2 Emissions Intensity |
|---|---|---|---|
| Cestas | 128,313 tn | 7.93 tn | 1,293.6 tons/km² |
| France | 485,797,691 tn | 7.38 tn | 761.4 tons/km² |
Sources: [Link] Moran, D., Kanemoto K; Jiborn, M., Wood, R., Többen, J., and Seto, K.C. (2018) Carbon footprints of 13,000 cities. Environmental Research Letters DOI: 10.1088/1748-9326/aac72a
Cestas CO2 Emissions
| 2013 CO2 emissions (tonnes/year) | 128,313 tn |
| 2013 CO2 emissions (tonnes/year) per capita | 7.93 tn |
| 2013 CO2 emissions intensity (tonnes/km²/year) | 1,293.6 tons/km² |
Recent Nearby Earthquakes
Magnitude 3.0 and greater
| Date▼ | Time↕ | Magnitude↕ | Distance↕ | Depth↕ | Location↕ | Link |
|---|---|---|---|---|---|---|
| 4/6/19 | 4:44 AM | 3.2 | 78.1 km | 8,130 m | 7km ENE of Chevanceaux, France | usgs.gov |
| 3/20/19 | 9:56 AM | 4.5 | 69.6 km | 10,000 m | 5km NNE of Montendre, France | usgs.gov |
| 8/5/04 | 10:11 AM | 3 | 70.1 km | 5,000 m | France | usgs.gov |
| 12/11/97 | 2:29 AM | 3.1 | 96.4 km | 5,000 m | France | usgs.gov |
| 3/30/97 | 2:03 AM | 3.1 | 74.2 km | 5,000 m | France | usgs.gov |
| 12/9/94 | 1:24 AM | 3.3 | 89.8 km | 13,300 m | France | usgs.gov |
| 11/21/91 | 10:34 AM | 3 | 49.5 km | 10,000 m | France | usgs.gov |
| 1/2/91 | 8:29 PM | 3 | 81.9 km | 10,000 m | France | usgs.gov |
| 3/31/89 | 2:05 AM | 3.1 | 66.1 km | 10,000 m | France | usgs.gov |
| 3/28/89 | 7:01 AM | 3.3 | 96.7 km | 10,000 m | France | usgs.gov |
Source: U.S. Geological Survey (USGS)
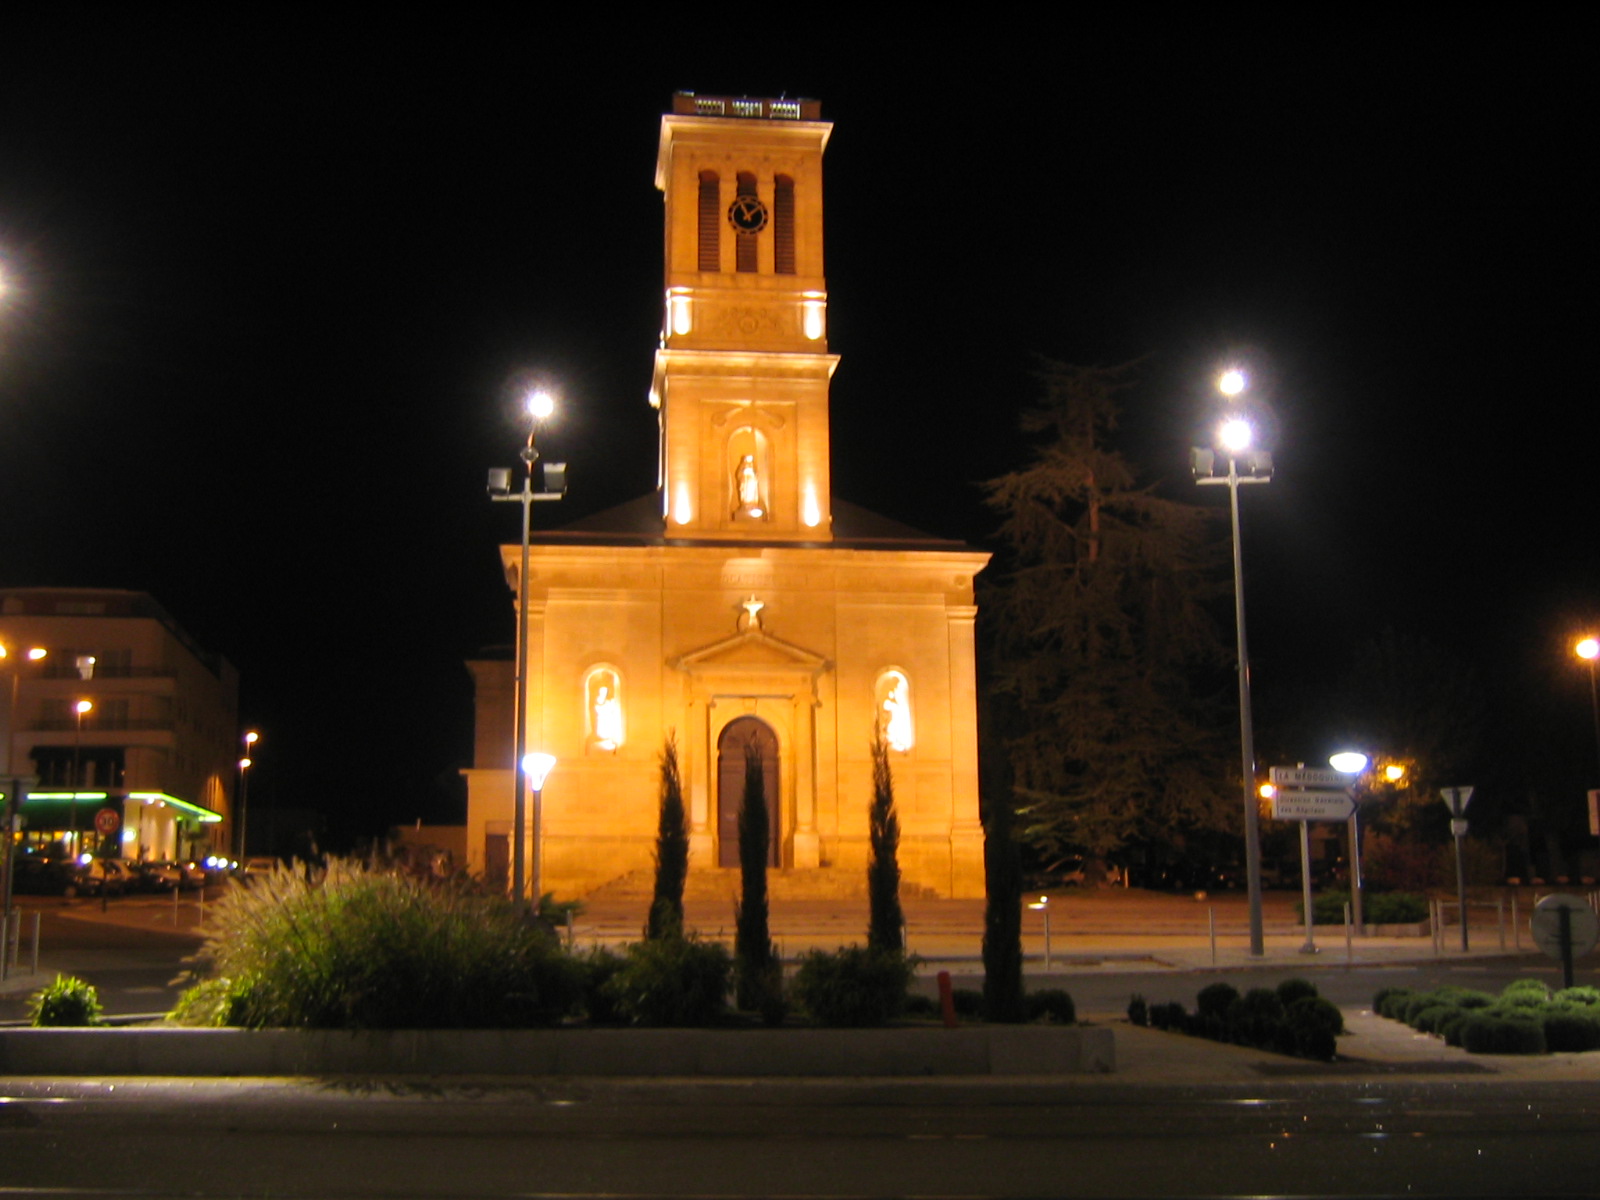
Cestas
Cestas is a commune in the Gironde department in Aquitaine in southwestern France.
Cestas Wikipedia Page


About Our Data
The data on this page is estimated using a number of publicly available tools and resources. It is provided without warranty, and could contain inaccuracies. Use at your own risk.